Introduction to Figures in Matplotlib
Overview
Matplotlib provides the module and functions to create a figure. We can create a new figure by using the function matplotlib.pyplot.figure(). Also, we can change the visual appearance of the figure by changing its size, color, dpi, etc. Adding subplots to a figure can be done using the function matplotlib.pyplot.figure().add_subplot(), which will add multiple plots on the same figure.
Introduction to Figures in Matplotlib
The figure is the top-level container of all the axes and properties of a plot, or we can say that it is a canvas that holds the drawings (graphs or plots) on it. For example, all the plots and properties are shown in the figure in matplotlib.
Transform Your Career
Choose from our industry-leading programs designed for career success
Modern Software and AI Engineering Program
Master full-stack development with AI integration

Modern Data Science and ML with specialisation in AI
Advanced data science techniques with AI specialization
Advanced AIML with Specialisation in Agentic AI
Deep dive into AIML with focus on Agentic systems
DevOps, Cloud & AI Platform Engineering
Build and manage AI-powered cloud infrastructure
AI Engineering Advanced Certification by IIT-Roorkee
Premier AI engineering certification from IIT-Roorkee
What is matplotlib.pyplot.figure() in Python?
Introduction
The figure is the very basic foundation for plotting data in matplotlib. When we plot data on a graph, that graph will be drawn on a figure. By default, a figure is automatically generated during plotting in matplotlib. We can create multiple figures, change the figure's properties, and add subplots to a figure. All these things can be done using the matplotlib.pyplot.figure() function.
Syntax
Parameters
| Parameters | Datatype and default values | Description |
|---|---|---|
| num | int or str | It is the unique ID of a figure. It is an optional parameter, upon calling, creates a new figure. Still, if a figure already exists with a given identifier, then that figure is made active by passing the identifier as a parameter in the function. |
| figsize | (float,float), default: (6.4,4.8) | dimension of the figure in inches |
| dpi | float, default: rcParams["figure.dpi"] (default: 100.0) | resolution of the figure in dot per inch. |
| face color | color, default: rcParams["figure.edgecolor"] (default: 'white') | background color |
| edge color | color, default: rcParams["figure.edgecolor"] (default: 'white') | border color |
| frameon | bool, default: True | suppress drawing the figure from if false. |
| clear | bool, default: False | It is used to clear the existing figure like a duster on a blackboard |
| FigureClass | subclass of Figure | optionally use a custom Figure instance. |
| tight_layout | bool or dict, default: rcParams["figure.autolayout"] (default: False) | If False use subplotpars. If True adjust subplot parameters using tight_layout with default padding. When providing a dict containing the keys pad, w_pad, h_pad, and rect, the default tight_layout paddings will be overridden. |
| constrained_layout | bool, default: rcParams["figure.constrained_layout.use"] (default: False) | If True, use constrained layout to adjust the positioning of plot elements. Like tight_layout, but designed to be more flexible. See the Constrained Layout Guide for examples. (Note: Does not work with add_subplot or subplot2grid.) |
| kwargs | N/A | optional parameter |
Turn Learning into Career Growth
Return
matplotlib.pyplot.figure() function returns Figure
How to Set the Figure Properties?
For example, matplotlib.pyplot.figure() is the function by which we can change the properties of a figure like size, dpi, face color, edge color, etc. We must pass these parameters with specific values to set the figure properties.
Example: Changing the figure size
Output:

Example: Changing resolution of the plot We can plot figures in high resolution by changing the value of the parameter dpi (dot per inch) in figure() function. The higher the value of dpi higher the resolution of the figure in matplotlib.
Example: Without using the parameter image generated is of low resolution
Output:

Example: With dpi
Output:

How to Add Subplots to a Figure?
Subplot() function visualizes multiple plots in one figure. It takes three arguments that describe the layout of the figure. The first and second arguments are rows and columns used to format the figure. The third argument represents the index of the current plot.
plt.subplot(1,2,1)
#means 1 row and two columns, and according to the index, it is the first plot
plt.subplot(1,2,2)
#means 1 row and two columns, and according to the index, it is the second plot
So that the two plots will be displayed side by side with each other.
Example: Subplot to a figure
Output:

Example: Multiple plots on the same figure
Output:

Code explanation:
- Importing the required modules
- figure() function is used to create a new figure of size (10,6)
- By using the add_subplot() function, we add four plots to a figure, where the first plot lies on the 1st row 1st column, the second plot lies on the 1st-row 2nd column, the third plot lies on the 2nd-row first column, the fourth plot lies on 2nd row 2nd column
- We use the function subtitle() to add a common title to a figure.
- show() function is used to show the figure.
Example: Multiple scatter plot on same figure
Output:

Examples
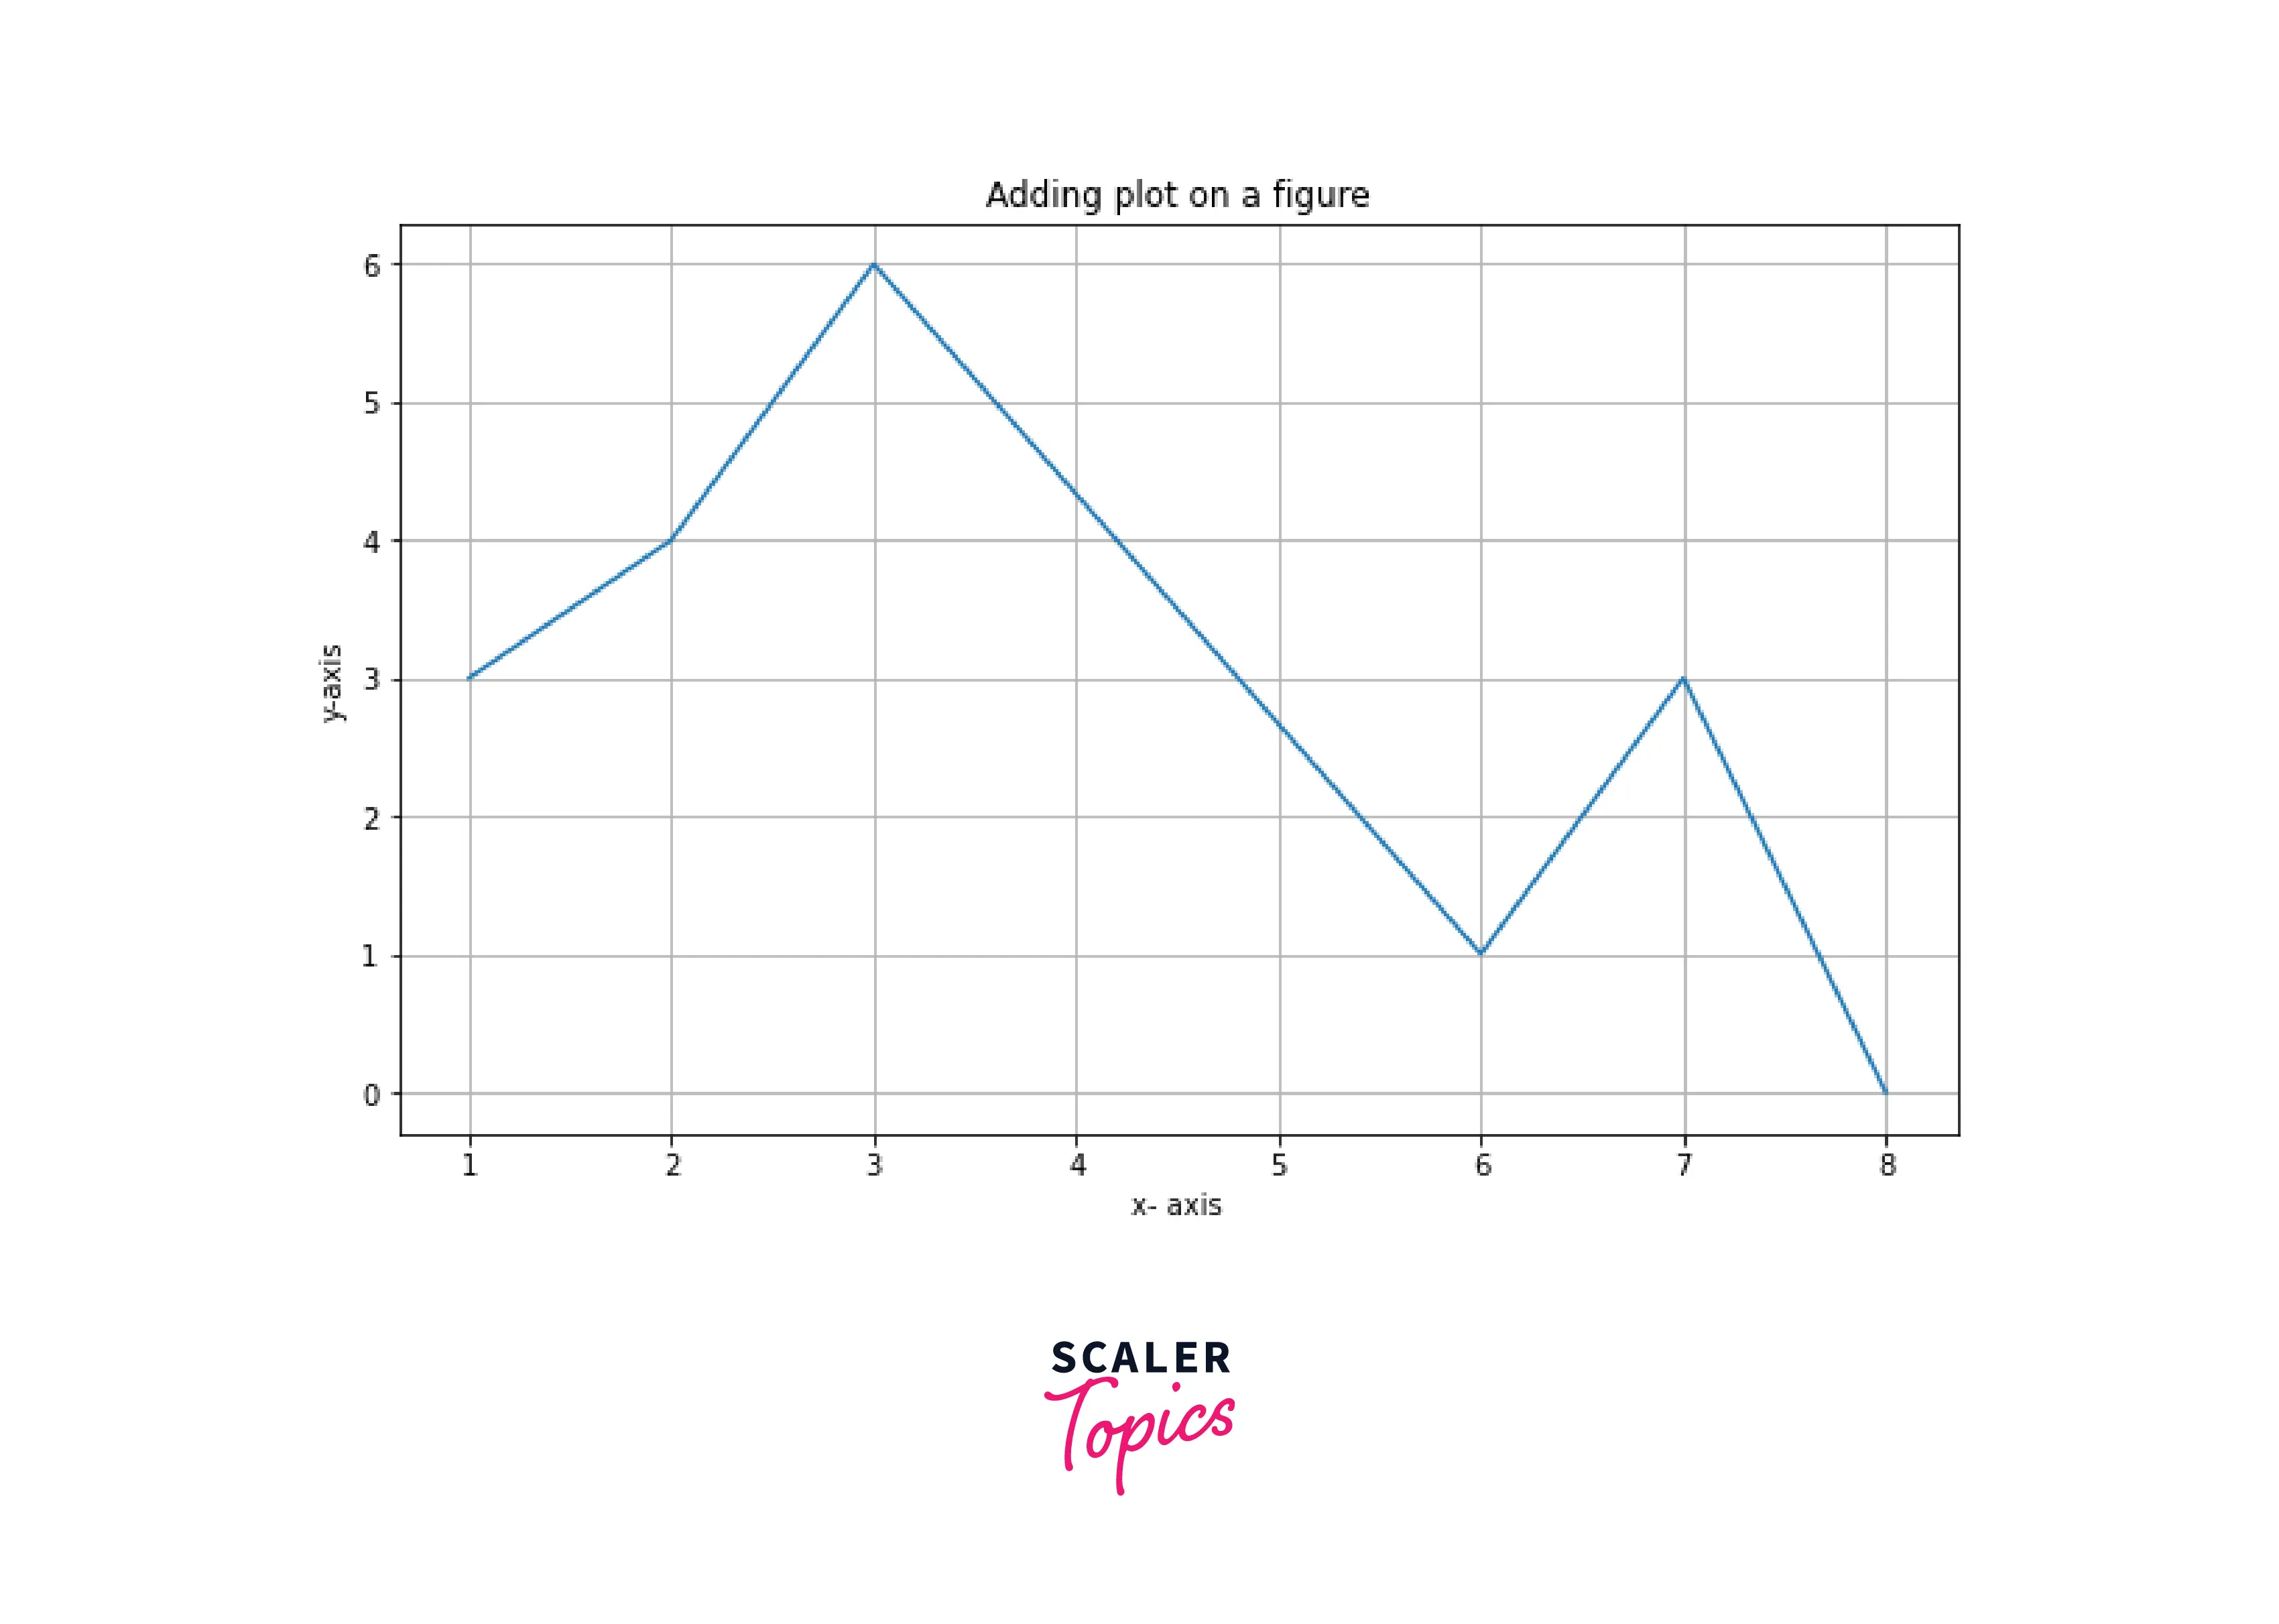
Example: Adding a plot on a figure
Output:
Example: Changing the face color and edge color of the figure
Output:

Example: Subplots in a figure
Output:

Code Explanation
- Importing the required modules.
- Using figure() function to create a new figure of size (10,8), and face color is light blue.
- Generating evenly spaced numbers between the bound and storing them in the list x.
- fig1 is the first figure on the 1st row 1st column.
- fig2 is the second figure on the 2nd row 1st column.
- subtitle() function adds a common title to the figure.
- show() function is used to show the figure.
Accelerate Your Data Science Career with Our Industry-Expert-Led Data Science Online Course. Enroll Now and Earn Your Certification!
Scaler Placement Report and Statistics
Scaler learners achieved 2.5x salary growth with average post-Scaler CTC reaching ₹23L.
Conclusion
- matplotlib.pyplot.figure() is the function to create a new figure.
- Detailed analysis of the parameters of the figure() function for better understanding.
- We can use different parameters in the figure() function to change its properties like color, size, dpi, etc.
- Subplots can be added to a figure using the add_subplots() function.