Making a User-controllable Plot
Overview
Data Visualization displays and visualizes data using common images like infographics, charts, and animations. There are many jobs in high demand for Data Visualization skills, like Data Analysts and Data Scientists.
The Matplotlib library available in Python is the right module that helps us to create meaningful and accurate plots and visualizations. The only thing that could top a plot in Matplotlib is a user-controlled plot.
This article will go through various methods to create user-controlled plots. To clarify our concepts, we will also understand the process of creating user-controllable plots with the help of some code examples.
Transform Your Career
Choose from our industry-leading programs designed for career success
Modern Software and AI Engineering Program
Master full-stack development with AI integration

Modern Data Science and ML with specialisation in AI
Advanced data science techniques with AI specialization
Advanced AIML with Specialisation in Agentic AI
Deep dive into AIML with focus on Agentic systems
DevOps, Cloud & AI Platform Engineering
Build and manage AI-powered cloud infrastructure
AI Engineering Advanced Certification by IIT-Roorkee
Premier AI engineering certification from IIT-Roorkee
Introduction
As discussed earlier in this article, Matplotlib is the one-stop library for all our plotting purposes. But when it comes to making Matplotlib interactive, there are only a handful of things it can do. For example, controllers and sliders are basic interactive elements we can add to our plots using Matplotlib.
Apart from the standard interactive elements in Matplotlib, we will be looking at IPyWidget, an extension in Matplotlib, with the help of which we can create full-fledged interactive plots.
Without further ado, let's go on and learn the basics of making interactive user-controllable plots using Matplotlib.
Making Interactive User-Controllable Plot with Matplotlib
To make innovative and interactive plots that are user-controlled in Matplotlib, there are four aspects that we need to understand briefly; Event Loops, Event Connection, Adding Widgets, and Object Picking.
-
Event Loops Event Loops are one of the most fundamental steps of creating user-controllable plots and interactive GUIs. These loops help us to capture user interactions and pass them back to the program. These loops are considered the runner code of any GUI/plotting program, as they start the whole process of running the applications.
Event Loops can range from a single function to a whole block of while/for loops that end after a certain condition.
Here's an example in which we use a single function to create an event loop:
And here's how we use a conditional loop (while/for) to create an event loop:
-
Event Connections
Creating connections between various events is a part of Event Handling and Picking. Since Matplotlib is compatible with many GUI applications (Tkinter, wxWidgets, GTK), creating APIs/functions for different purposes is a good practice.
Key presses and mouse hovering are some basic functionalities that might require event handling. Next, we need to write a callback function and then connect the said function to an event manager if we want our application to receive an event.
Here's an event connection that allows us to print the location of a mouse click and button press.
-
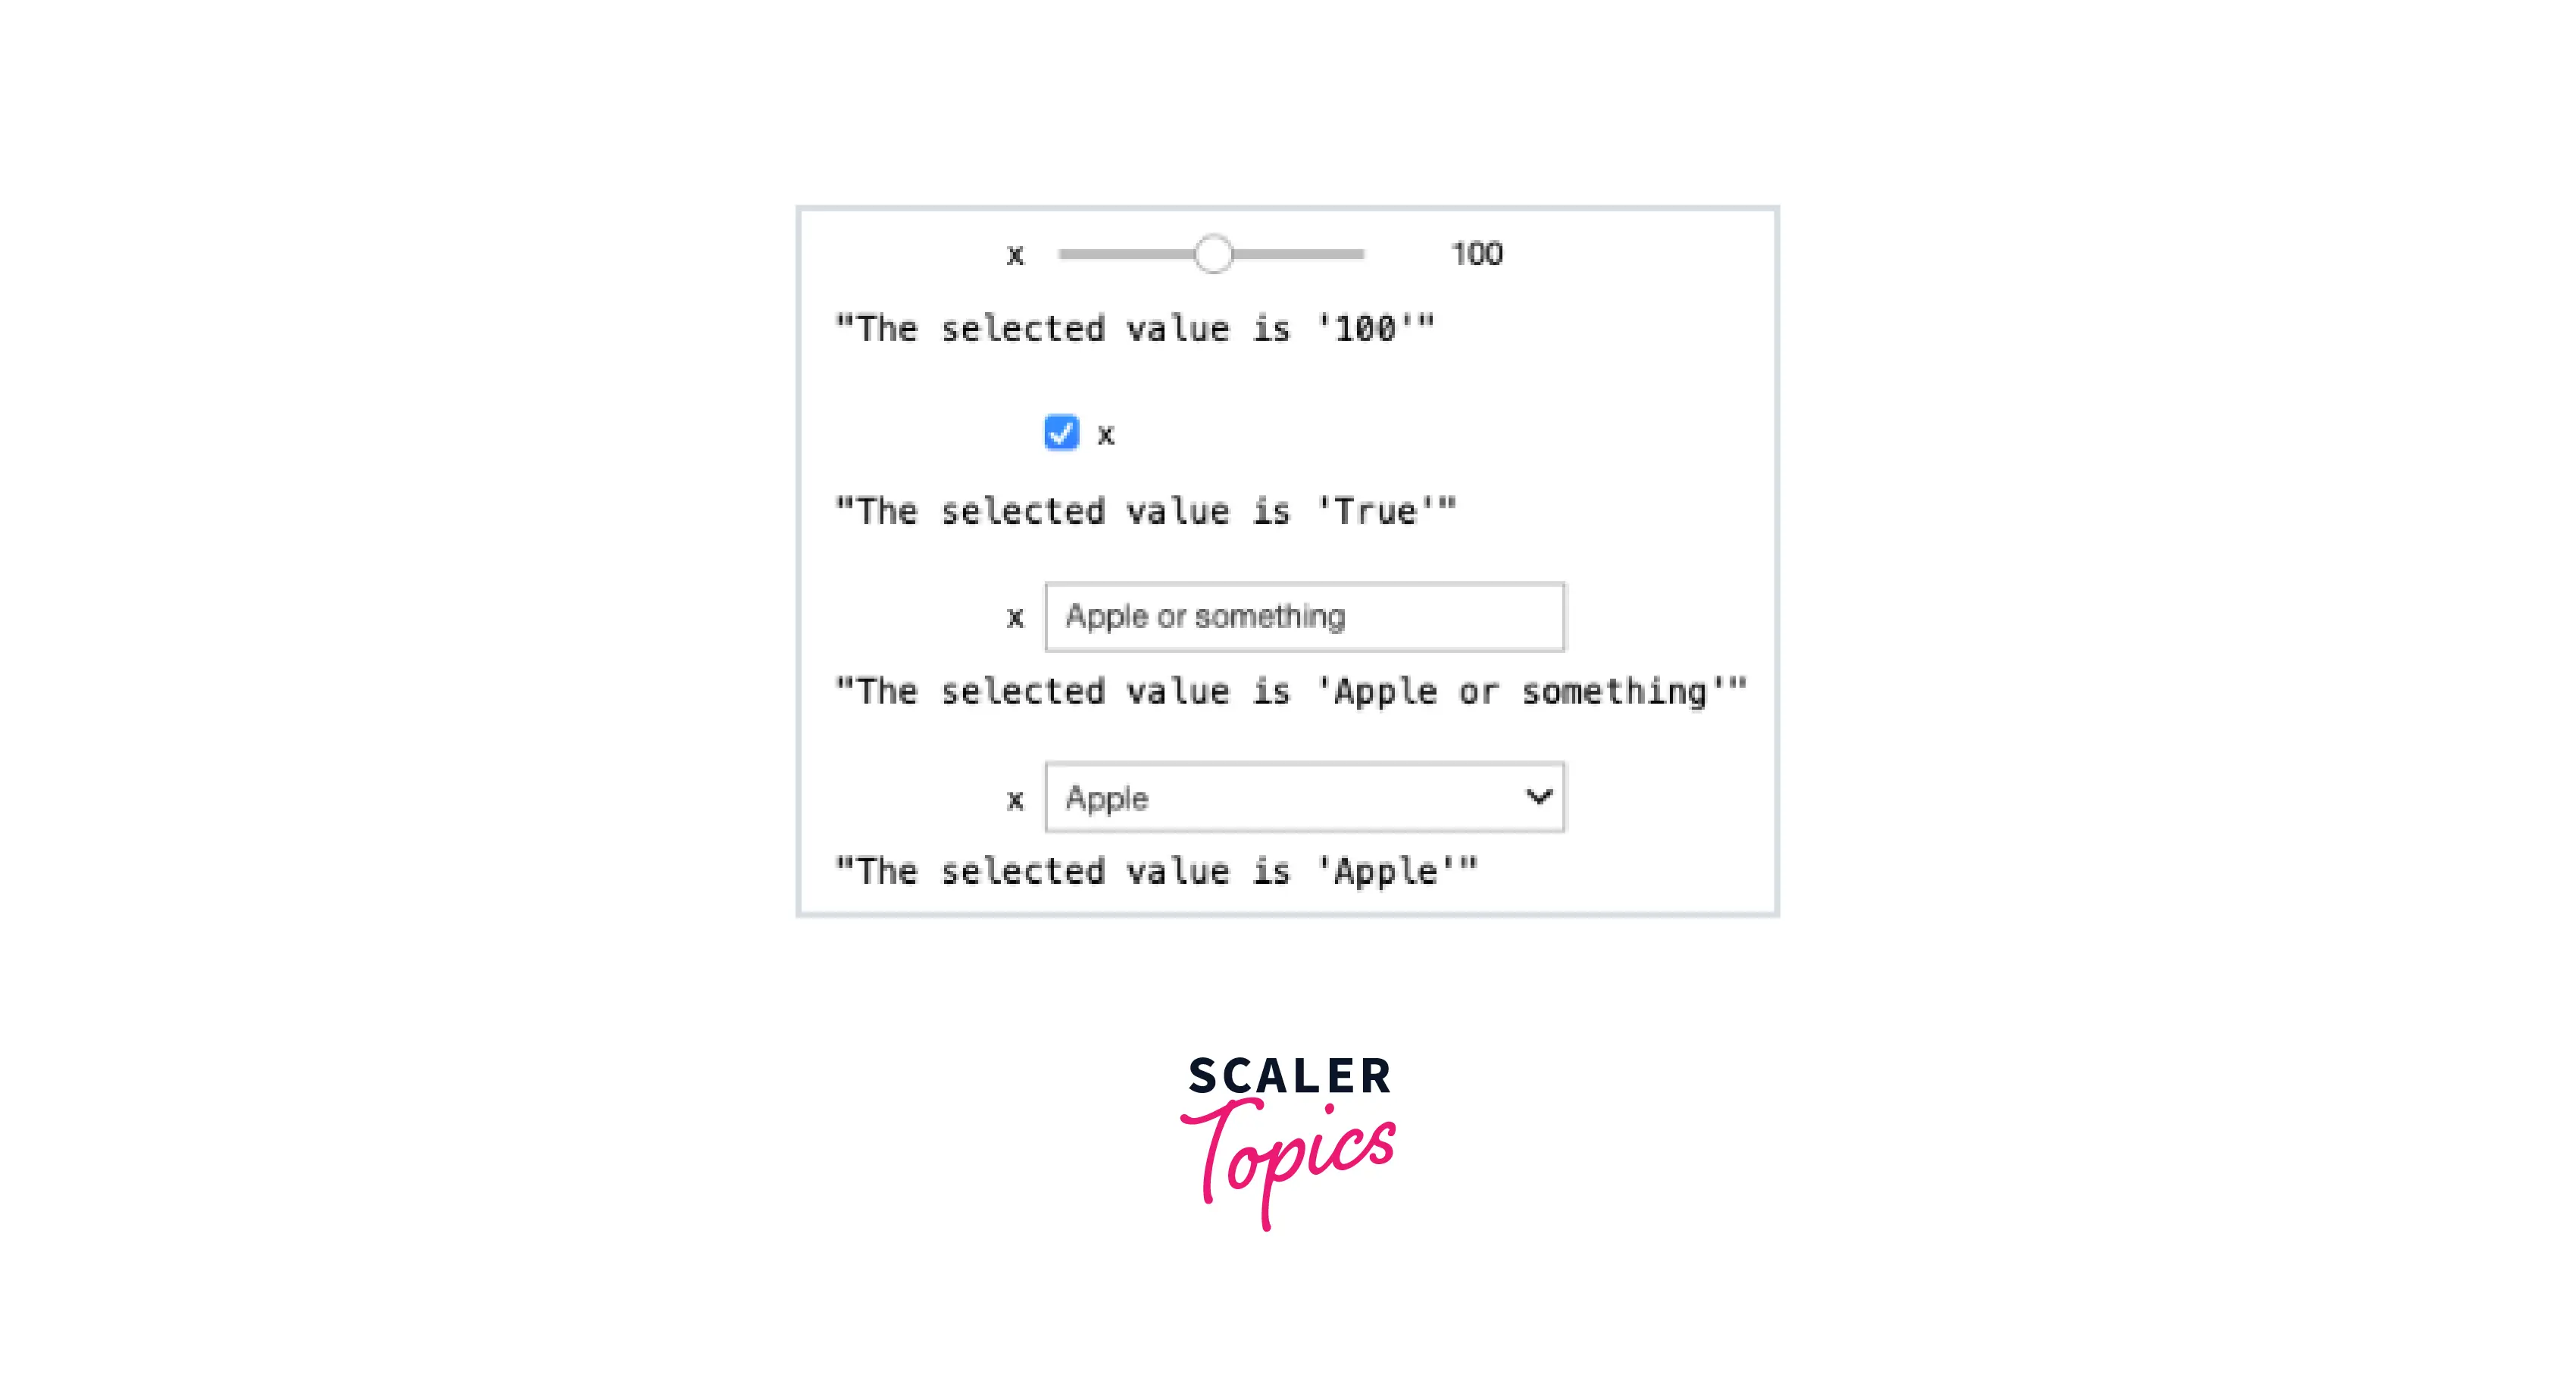
Adding Widgets Adding Widgets allows us to be creative and find ways to increase/decrease various sliders in charts and plots. To add some widgets in Matplotlib, we use the ipywidgets module in Python.
The ipywidgets module contains many functions just to be called to work with widgets in Matplotlib. For example, the interact function is used to create an interactive widget.
Here are some of the widgets created using ipywidgets:
Output:

-
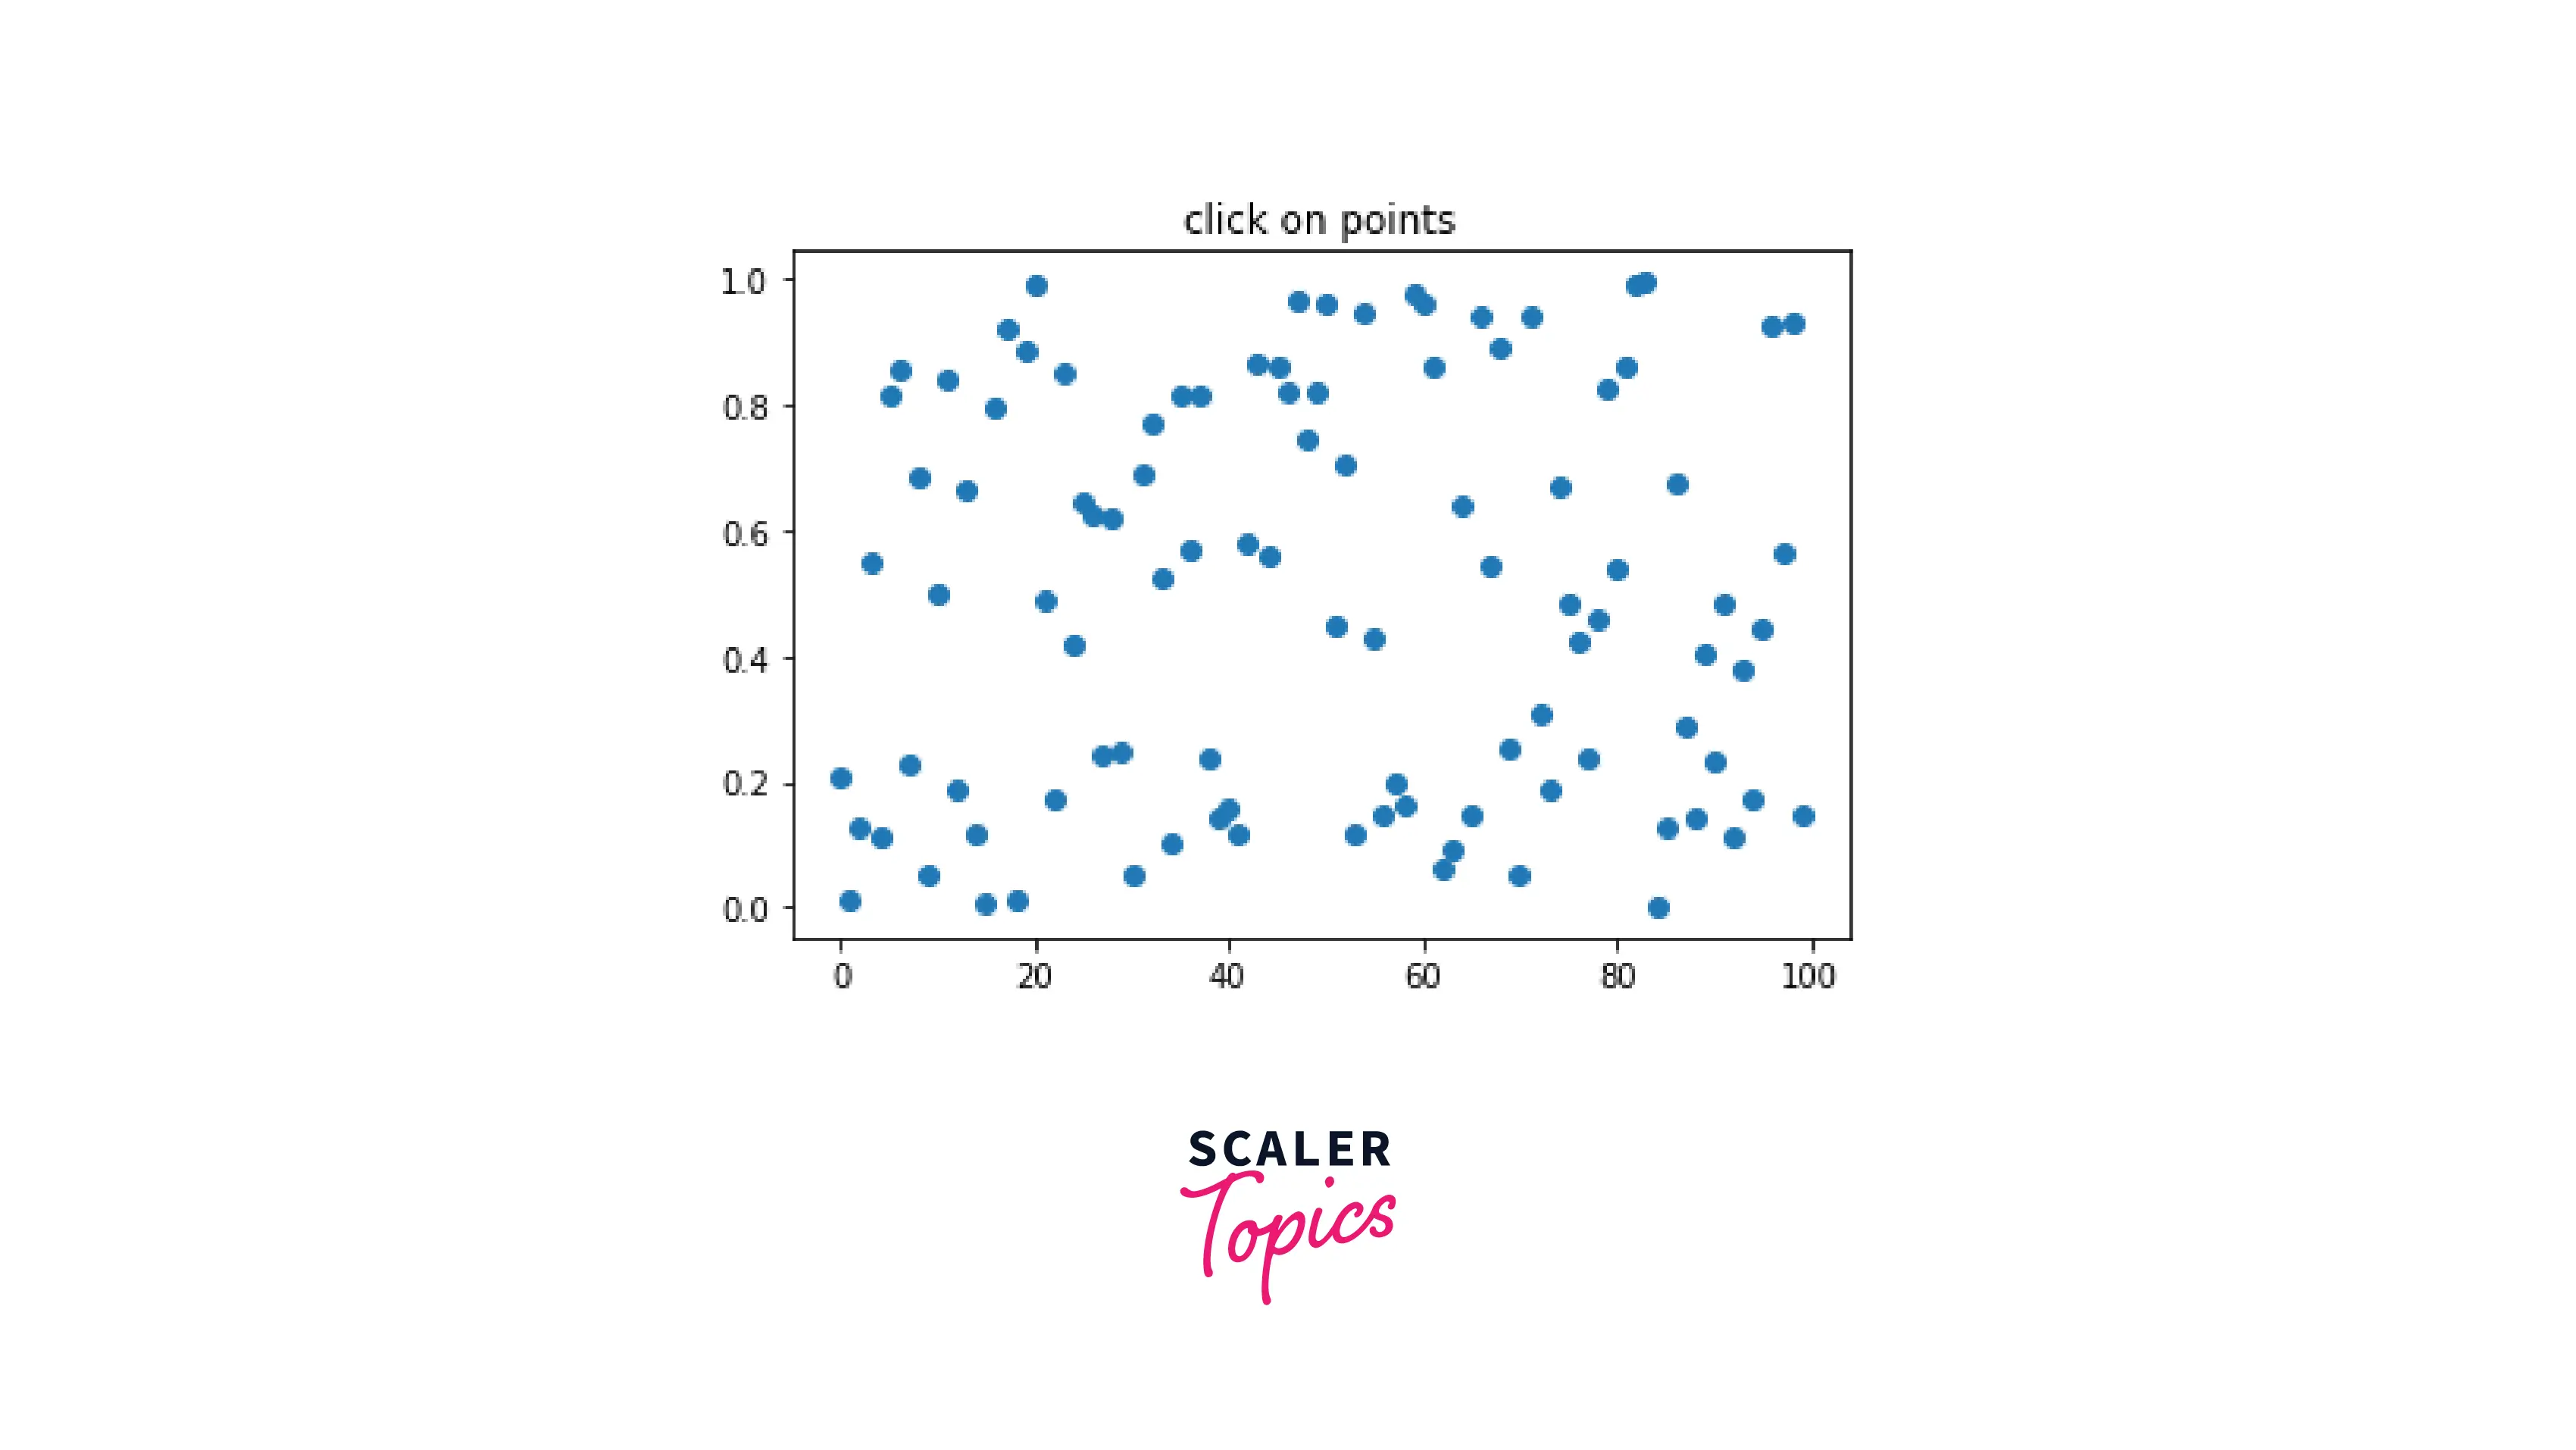
Object Picking Object Picking helps us to select the widgets that we want to be displayed. This allows our application to be precise, clear, and free of code repetitions. We can pick various objects by setting the picking property of an Artist object. The Artist's object can be anything ranging from Line2D, Polygon etc.
In this example, we will pick a line and set a radius in points using the Object Picking method.
In the code snippet, two variables are returned when we use the Axes.plot() function. For object picking, we do not need to use the second value, hence we don't assign a variable to it.
Output:
Scaler Placement Report and Statistics
Scaler learners achieved 2.5x salary growth with average post-Scaler CTC reaching ₹23L.
Code Examples
-
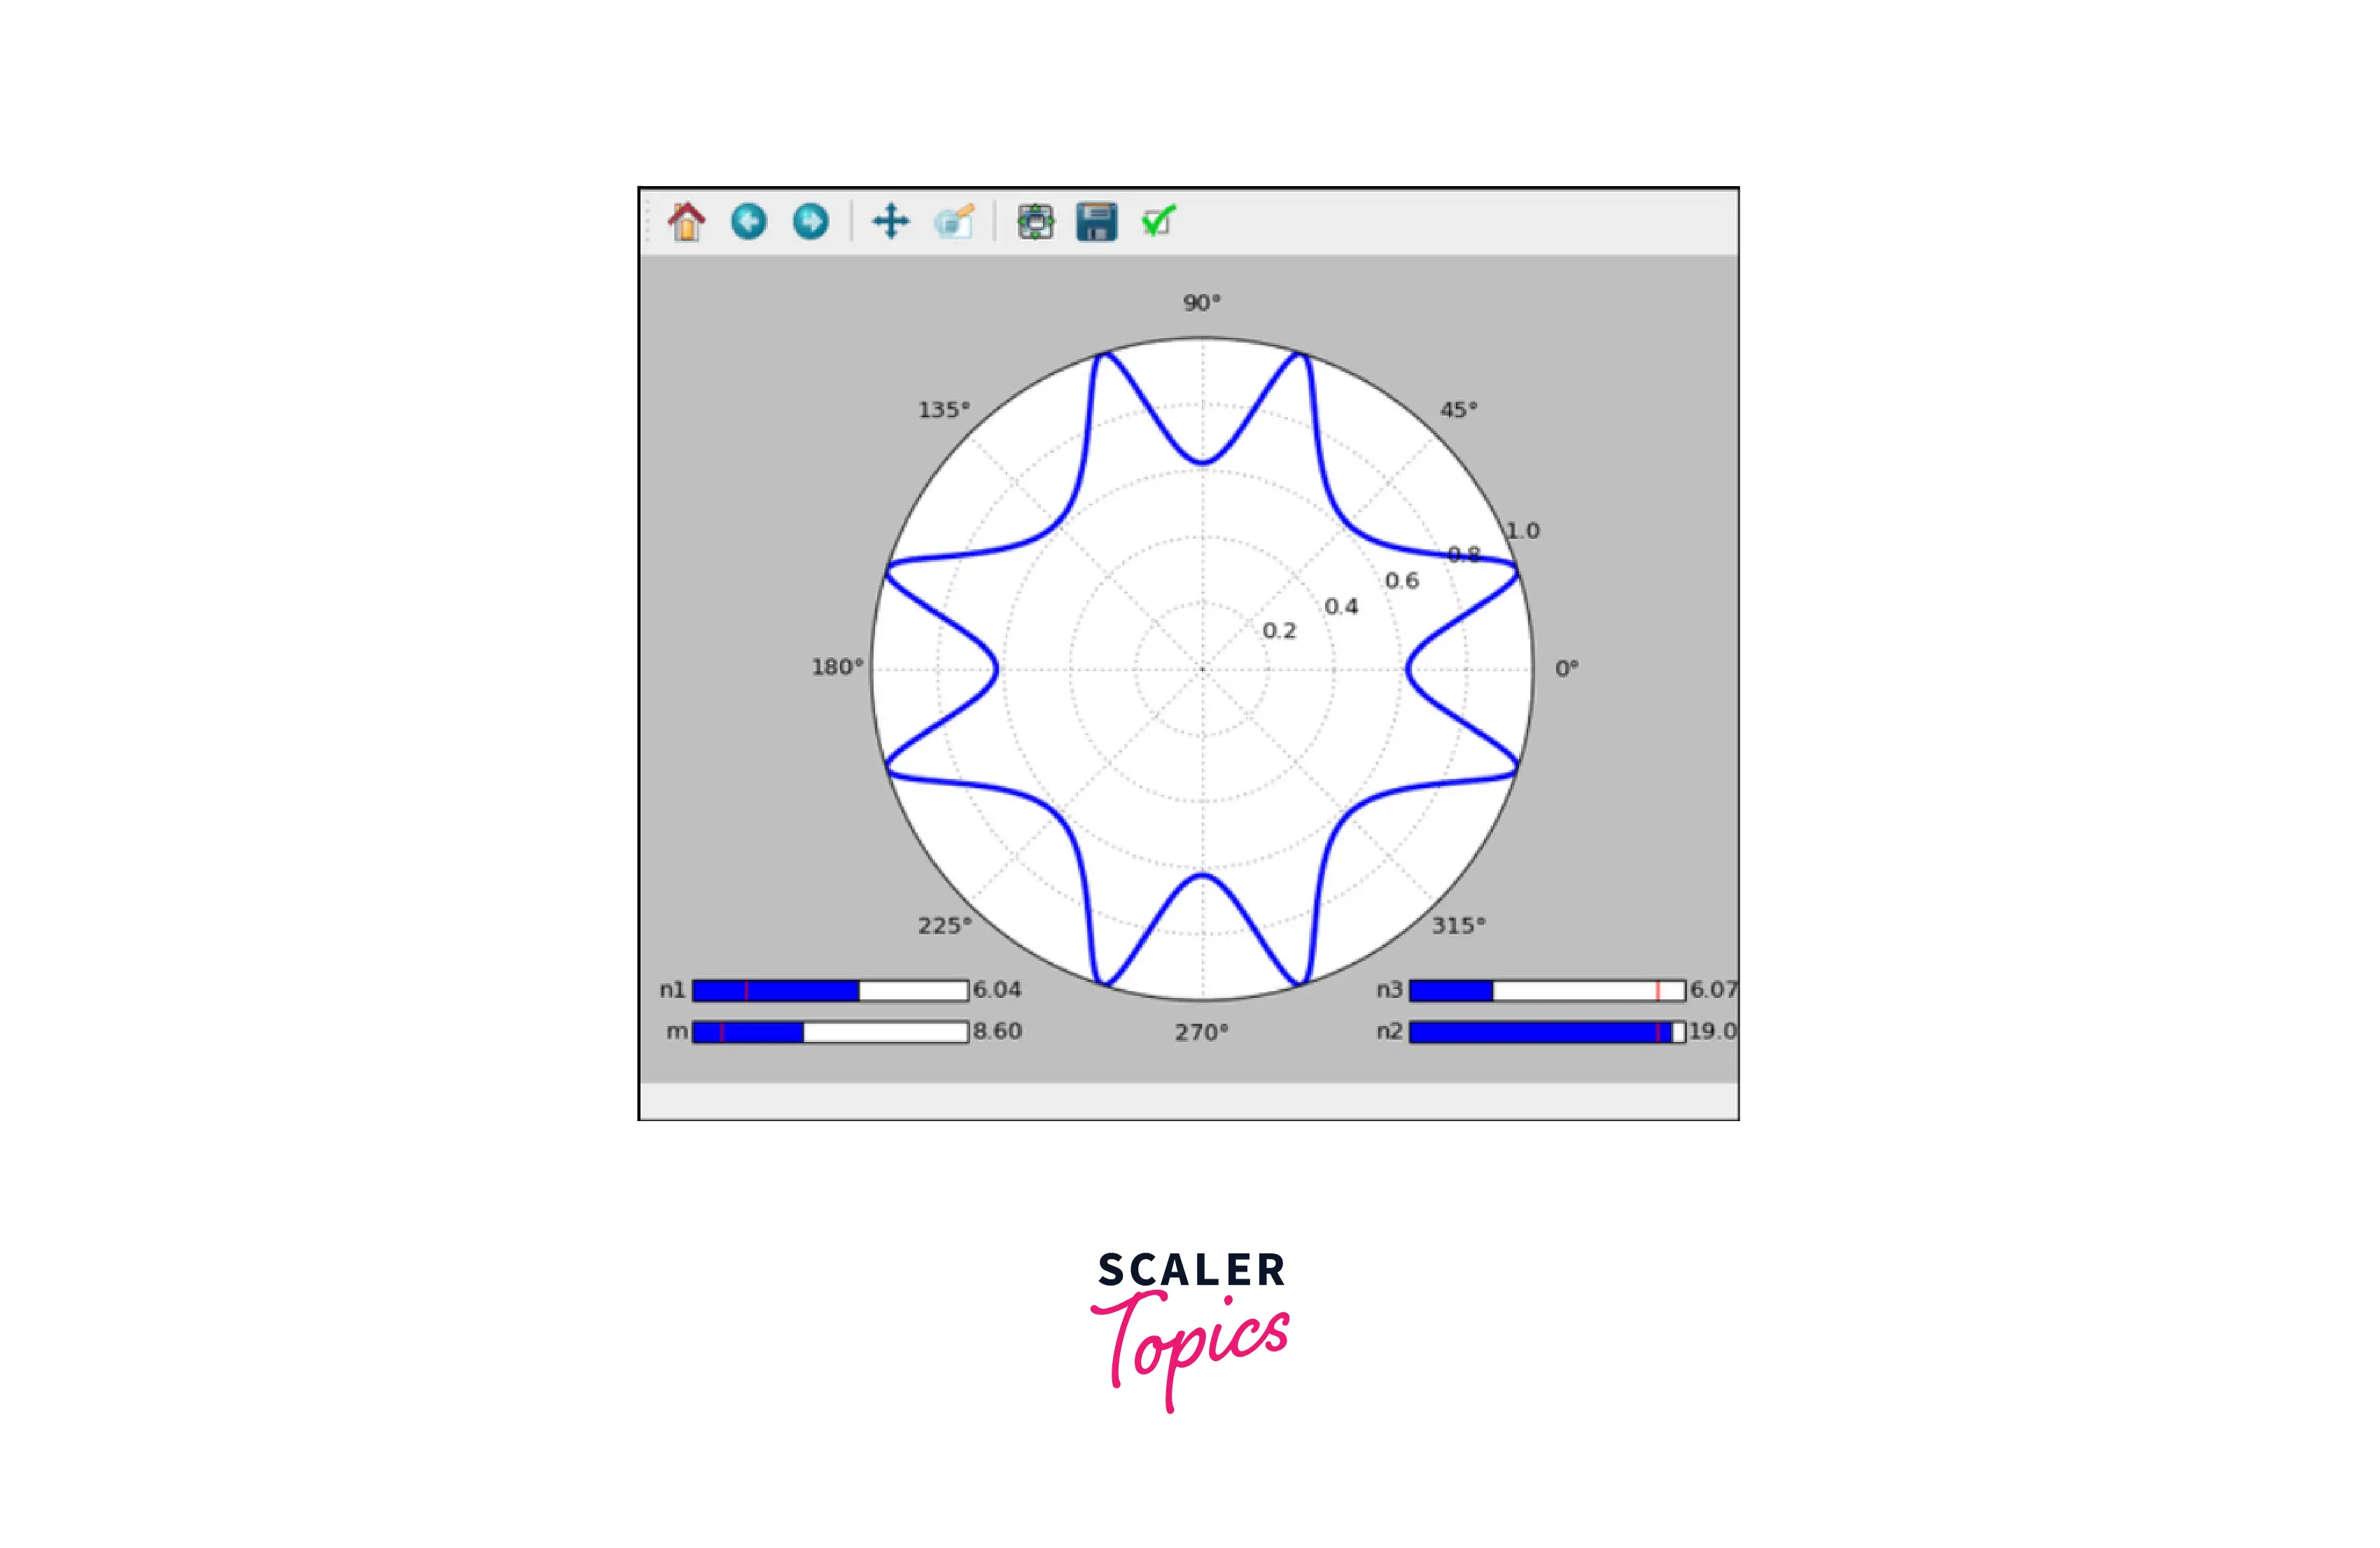
Creating a SuperShape User-Controllable Plot
With the concepts we learned in this article, we will now create a SuperShape; a polar curve created when we compute a radius for every angle.
Output:
Conclusion
- In this article, we learned about user-controllable plots; a type of plot in which users can adjust values/labels using sliders and other widgets.
- We learned about the various concepts required to create user-controllable plots and deeply understood various code examples.
- To conclude, we created the SuperShape curve using the concepts we understood in this article.