How to Visualize a 2D Array?
Overview
Matplotlib and Numpy provide the modules and functions to visualize a 2D array in Python. To visualize an array or list in matplotlib, we have to generate the data, which the NumPy library can do, and then plot the data using matplotlib. There are many functions by which we can add data to the array numpy.array(), numpy.arange(), numpy.linspace(), etc. Post that, using the matplotlib library, we can plot multiple graphs using the arrays.
Introduction
NumPy is a Python library using which we can generate arrays, and these arrays can be plotted using matplotlib in Python to visualize them as a graph. NumPy arrays can be visualized as line plots, scatter plots, color mesh, etc.
Scaler Placement Report and Statistics
Scaler learners achieved 2.5x salary growth with average post-Scaler CTC reaching ₹23L.
NumPy Array Functions
Before visualizing the NumPy array in matplotlib, we need to know all the functions used to generate the NumPy array to understand the topic better.
- numpy.array() This function generates a NumPy array to store data in numpy.array() we have to give a list as a parameter.
Example:
Output:
- numpy.arange() The numpy.arange() function allows us to initialize a sequence of integers based on the range (starting point, stopping point, and interval).
Example:
Output:
- numpy.ones() The numpy.ones() function allows us to generate an array of ones of user-specific size.
Output:
- numpy.zeros() The numpy.zeros() function allows us to generate an array of zeros of user-specific size.
Output:
- numpy.linspace() The numpy.linspace() function allows us to generate N evenly spaced points within a user-specified interval where both starting and stopping points are inclusive. This function is different from numpy.arange() because this function generates N evenly spaced number between intervals where we have to pass N as a parameter in the function but in numpy.arange() function, we pass the interval as the parameter. Example:
Output:
Transform Your Career
Choose from our industry-leading programs designed for career success
Modern Software and AI Engineering Program
Master full-stack development with AI integration

Modern Data Science and ML with specialisation in AI
Advanced data science techniques with AI specialization
Advanced AIML with Specialisation in Agentic AI
Deep dive into AIML with focus on Agentic systems
DevOps, Cloud & AI Platform Engineering
Build and manage AI-powered cloud infrastructure
AI Engineering Advanced Certification by IIT-Roorkee
Premier AI engineering certification from IIT-Roorkee
Visualize Different Types of 2D Arrays
Plot NumPy Array
In matplotlib, we can plot the NumPy array on the graph. We need two NumPy 1-D arrays of equal size for the simple plot to plot data on the graph. We can visualize it on different plots such as line plots, scatter plots, bar graphs, etc.
Example: Plot Numpy array
Output:

Code explanation:
- Importing the required modules.
- Creating the figure and increasing the resolution using the parameter dpi.
- Storing the x-axis and y-axis data points in a numpy array.
- matplotlib.pyplot.plot() function to plot the data.
- Adding details to the plot by using matplotlib.pyplot.title(), matplotlib.pyplot.xlabel() and matplotlib.pyplot.ylabel() functions.
- matplotlib.pyplot.show() function to display the plot.
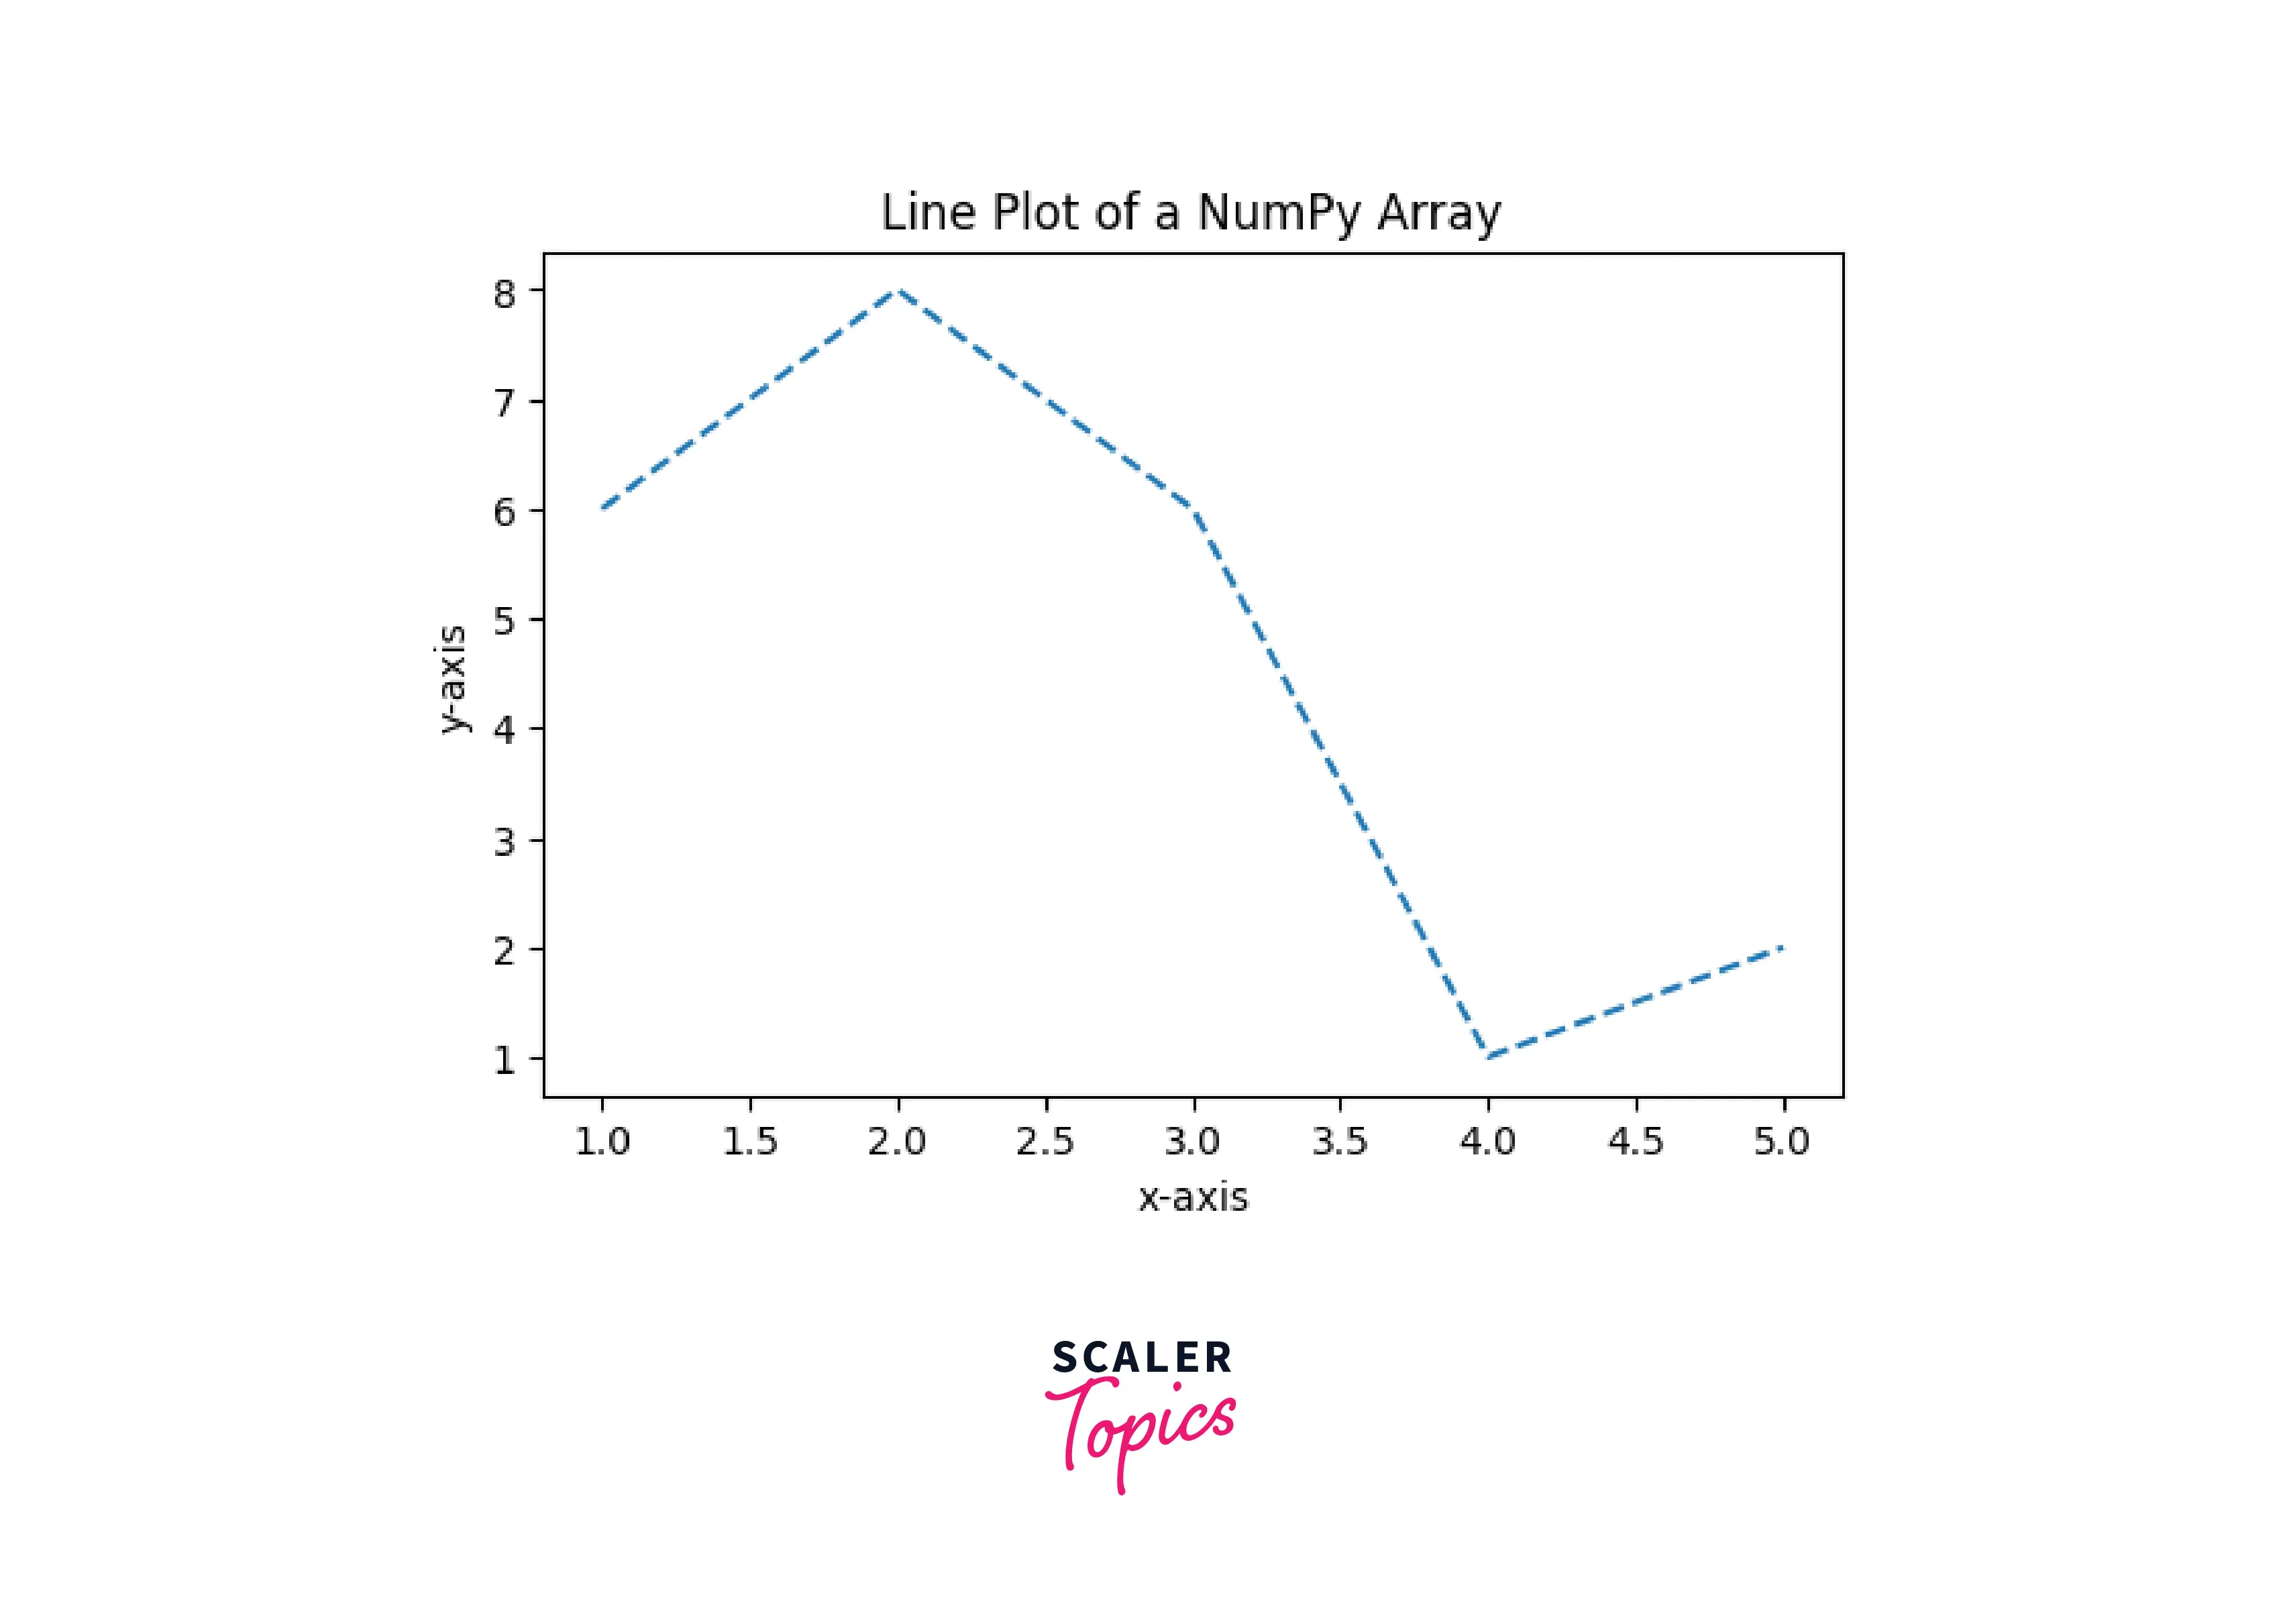
Plot NumPy Array as Line
For plotting a numpy array as a line plot. First, we have to generate data (2 arrays of the same size), then plot data using matplotlib.pyplot.plt() function.
Example:
Output:
Plot NumPy Array as Scatter Plot
As we have plotted the data as a line plot in matplotlib. Similarly, we can plot the data as a scatter plot.
Output:

Turn Learning into Career Growth
Plot NumPy Array as Multiple Lines
We can plot a numpy array as multiple lines. We must generate two arrays` for each plot.
Example:
Output:

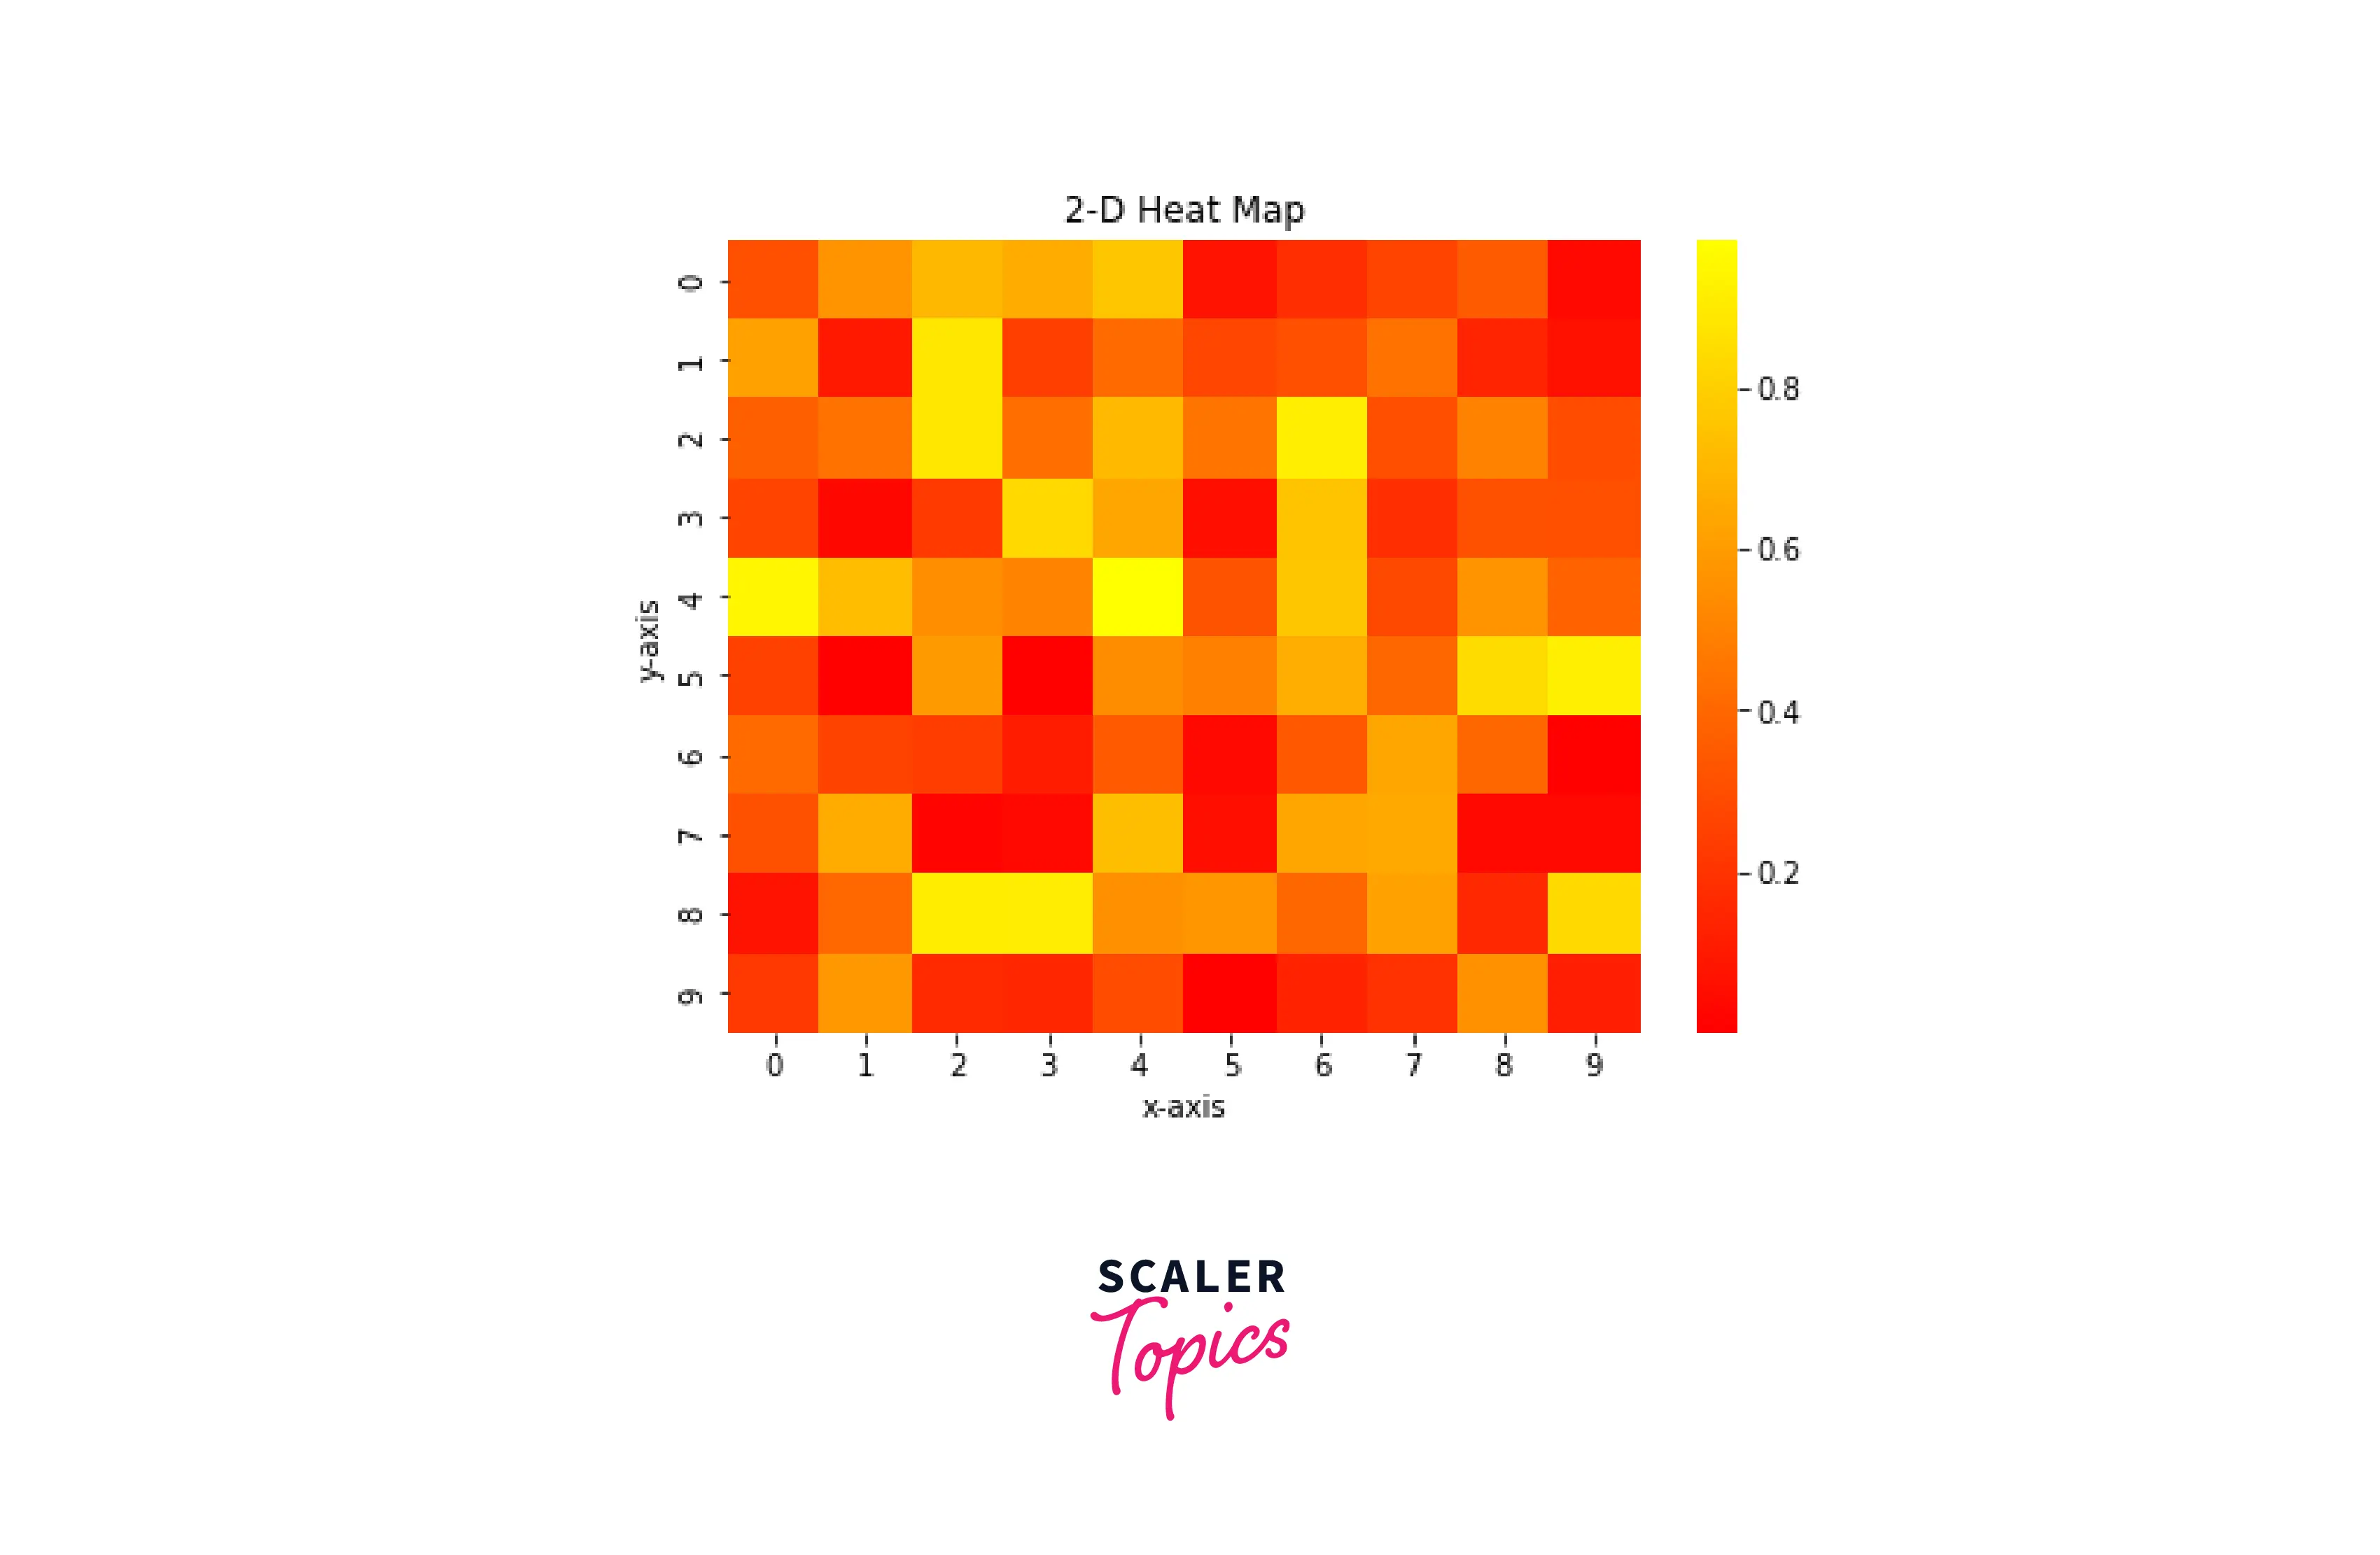
Plot NumPy Array as a Heatmap
To generate a heat map using a numpy array, first, we must generate data for a 2-D array, then show that array as an image file. Here is the Example of the same.
Example1: Using imshow() method
Output:

Code explanation:
- Importing the required modules.
- Generating 2x2 matrix of random values using numpy.random.random() function.
- matplotlib.pyplot.imshow() function takes data of the array and shows the color according to the heatmap.
- Adding details to the plot by using matplotlib.pyplot.title(), matplotlib.pyplot.xlabel() and matplotlib.pyplot.ylabel() functions.
- Then, adding colorbar to the plot using matplotlib.pyplot.colorbar() function.
- matplotlib.pyplot.show() function to display the plot.
Example2: Using Seaborn library
Output:
Plot NumPy Array as Image
A numpy array can be read as an image where the array index acts like a single pixel and the value at that index as color. Here is the Example of the same.
Example:
Output:

Plot NumPy Array as a Matrix
The matplotlib.pyplot.matshow() function displays an array as a matrix in a new figure window.
Syntax
Example:
Output:

Scaler Placement Report and Statistics
Scaler learners achieved 2.5x salary growth with average post-Scaler CTC reaching ₹23L.
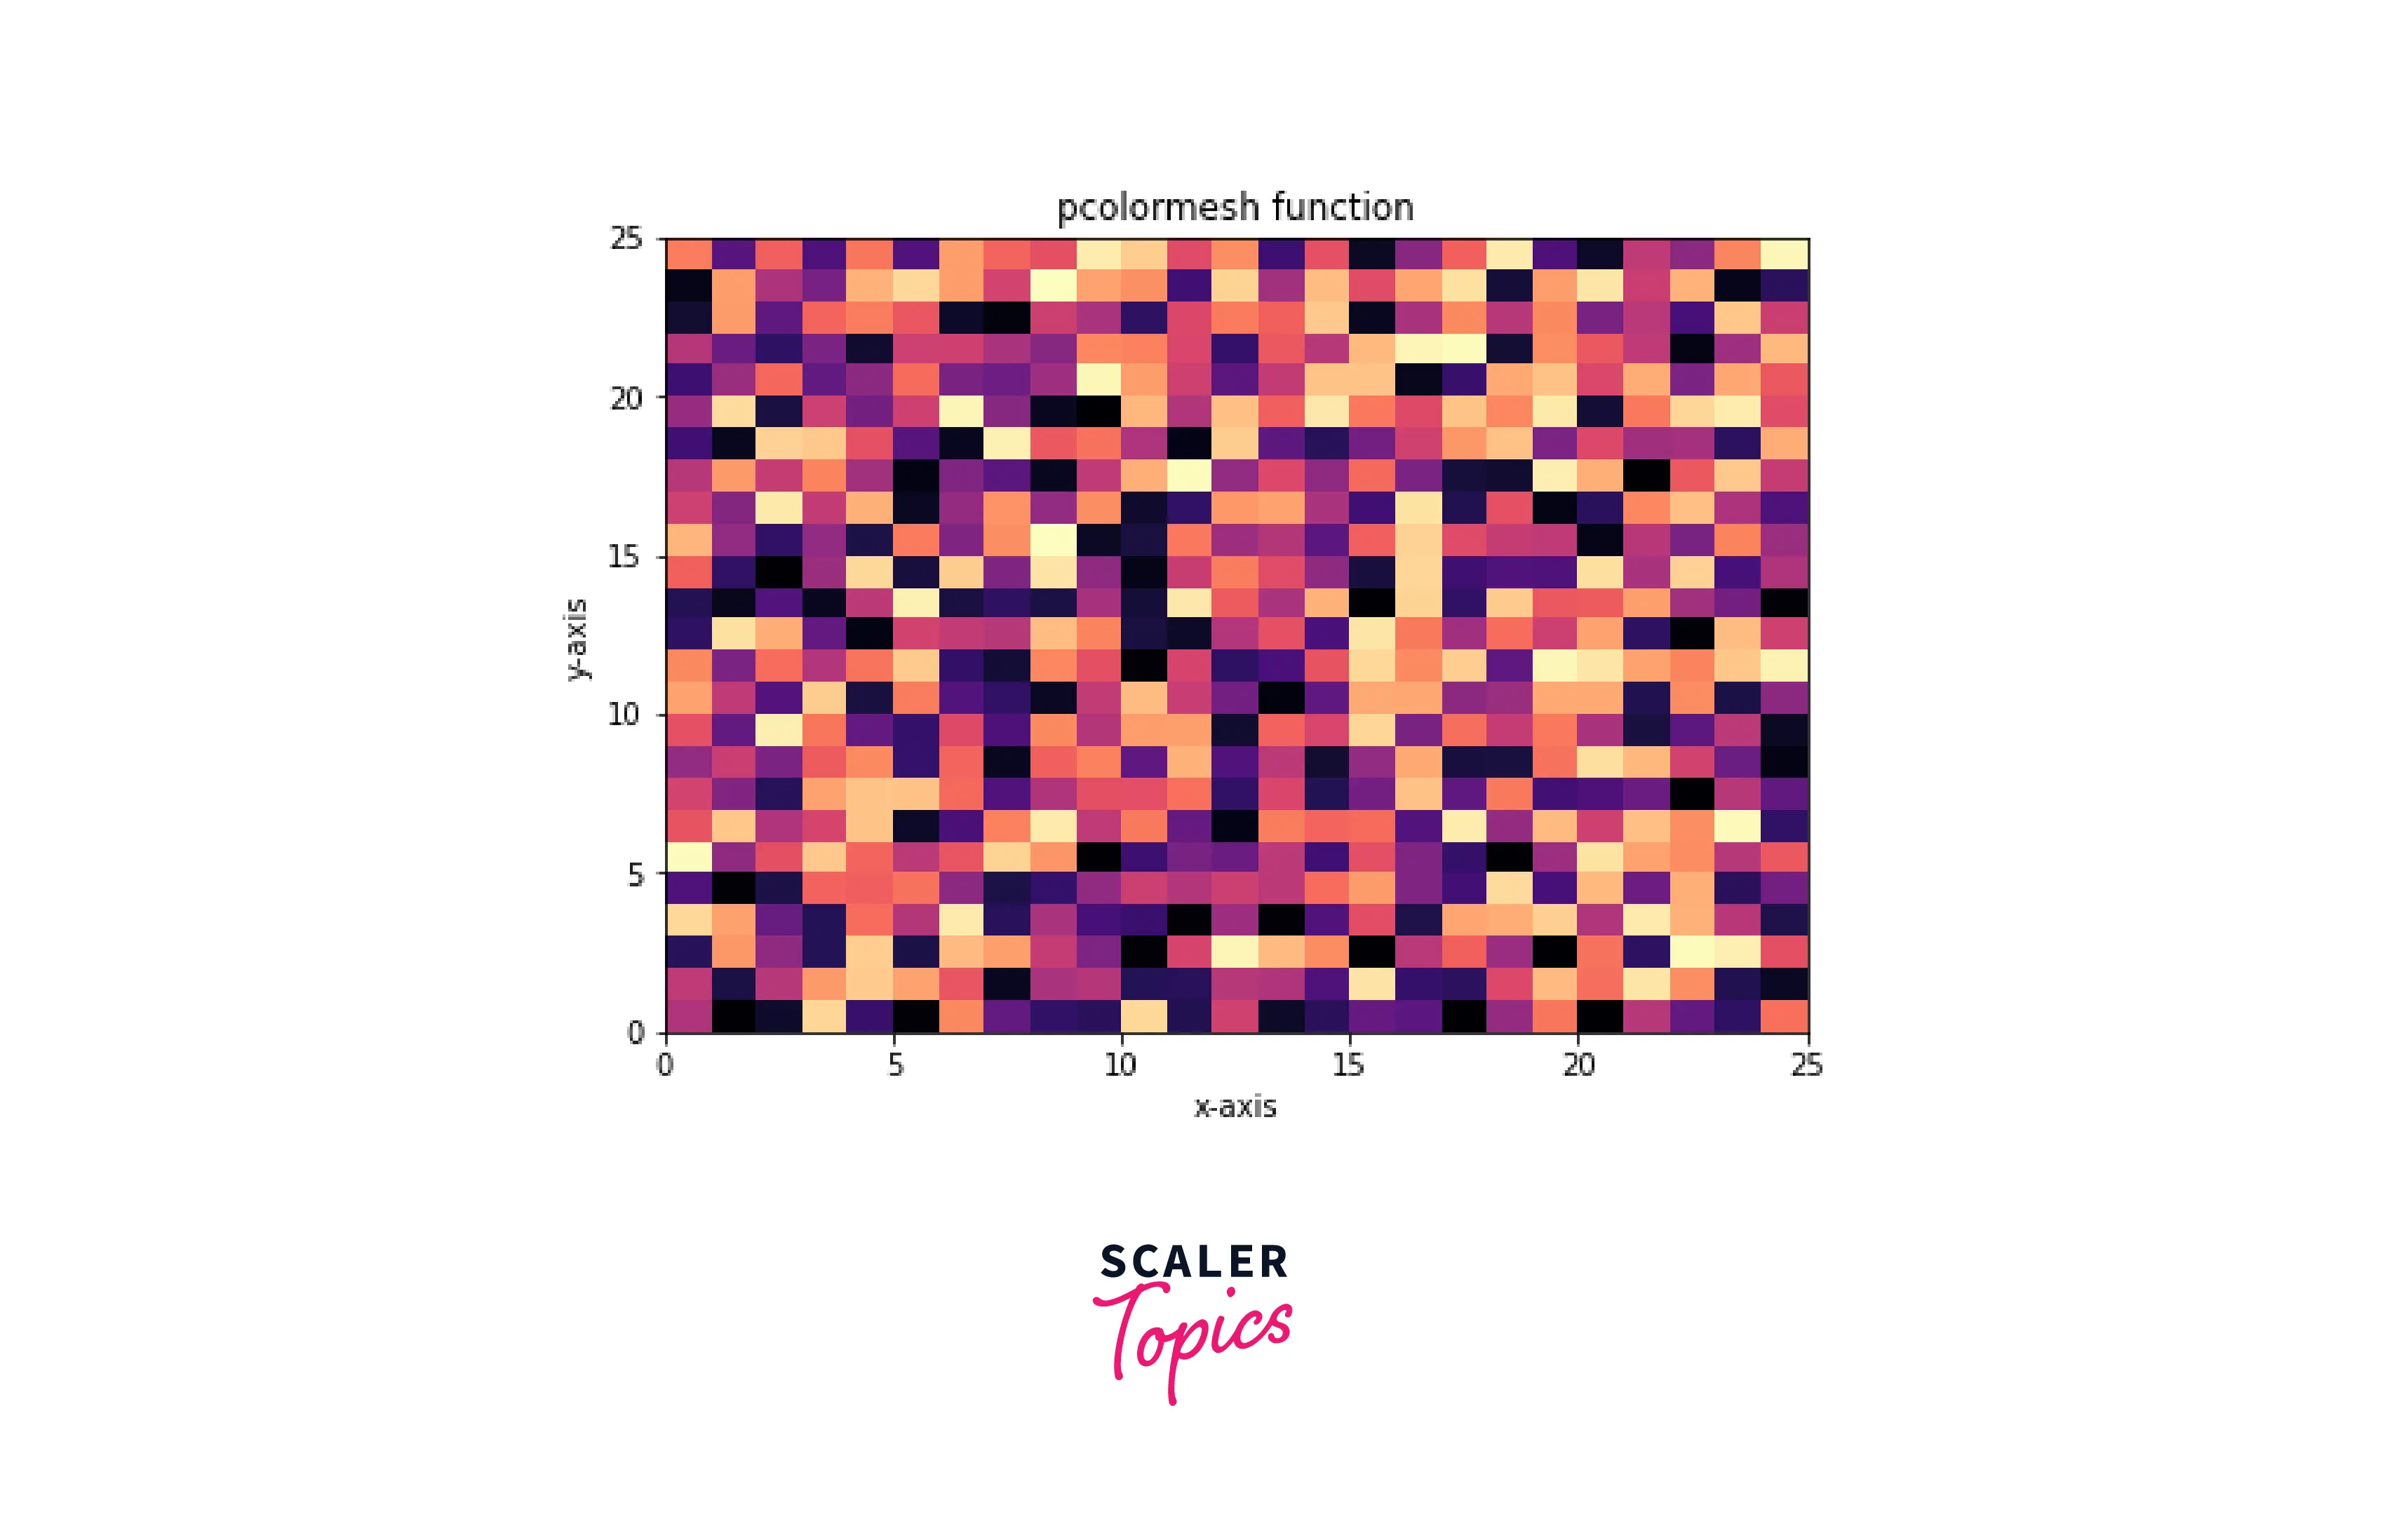
Using pcolormesh() Function
The pcolormesh() function creates a pseudocolor plot with a non-regular rectangular grid.
Syntax
*Example :
Output:
Eager to Explore Further? Enroll in Our Industry-Expert-Led Data Scientist Course and Bridge the Gap Between Theory and Application.
Conclusion
- First, we generate the data and store it in an array for plotting on the graph.
- We visualize the numpy array by plotting the data on the graph or making a heat map using it.
- When we visualize a 2D array on the graph, each index is the coordinate, and the data at that index is the value of the color.