Plotting a Parametric 3D Surface in Matplotlib
Overview
Data Analysis is a field of Computer Science that examines raw data to make conclusions about it. Many data analytics methodologies and processes have been automated into mechanical processes and algorithms to act on raw data for human consumption.
One of the most used programming languages for this purpose is Python. Out of many reasons, being home to many useful and powerful libraries is why developers tend to stick with it for Data Analytics. This article will unravel parametric equations, 3D plots, and various ways to plot them using Matplotlib.
Transform Your Career
Choose from our industry-leading programs designed for career success
Modern Software and AI Engineering Program
Master full-stack development with AI integration

Modern Data Science and ML with specialisation in AI
Advanced data science techniques with AI specialization
Advanced AIML with Specialisation in Agentic AI
Deep dive into AIML with focus on Agentic systems
DevOps, Cloud & AI Platform Engineering
Build and manage AI-powered cloud infrastructure
AI Engineering Advanced Certification by IIT-Roorkee
Premier AI engineering certification from IIT-Roorkee
Introduction
As discussed earlier in this article, Python has many amazing and powerful libraries. However, the most well-known and sought-after module for plotting is Matplotlib. A wide variety of graphs, plots, charts, histograms, and other visual representations of data can be created with the help of this module.
One of the most important concepts in Mathematics is parametric equations. These equations help us to disintegrate complex and computationally expensive mathematical expressions using a third variable. Later in this article, we will dive deep into parametric equations and various plotting methods using Matplotlib.
What are Parametric Equations?
According to mathematics, a parametric equation is a unique way of mapping multiple variables in one variable. So if we have an equation consisting of x and y coordinates, we would use a third coordinate, t, and convert x and y into the t coordinate.
Consider a circle as an illustration. A circle's equation in Cartesian coordinates
To convert this equation into its parametric form, we only need to rewrite x and y as a factor of another variable (t).
These parametric equations represent a convenient way to represent various lines and curves, and the curves/lines obtained from this method are known as parametric lines/curves.
How to Plot a Parametric 3D Surface
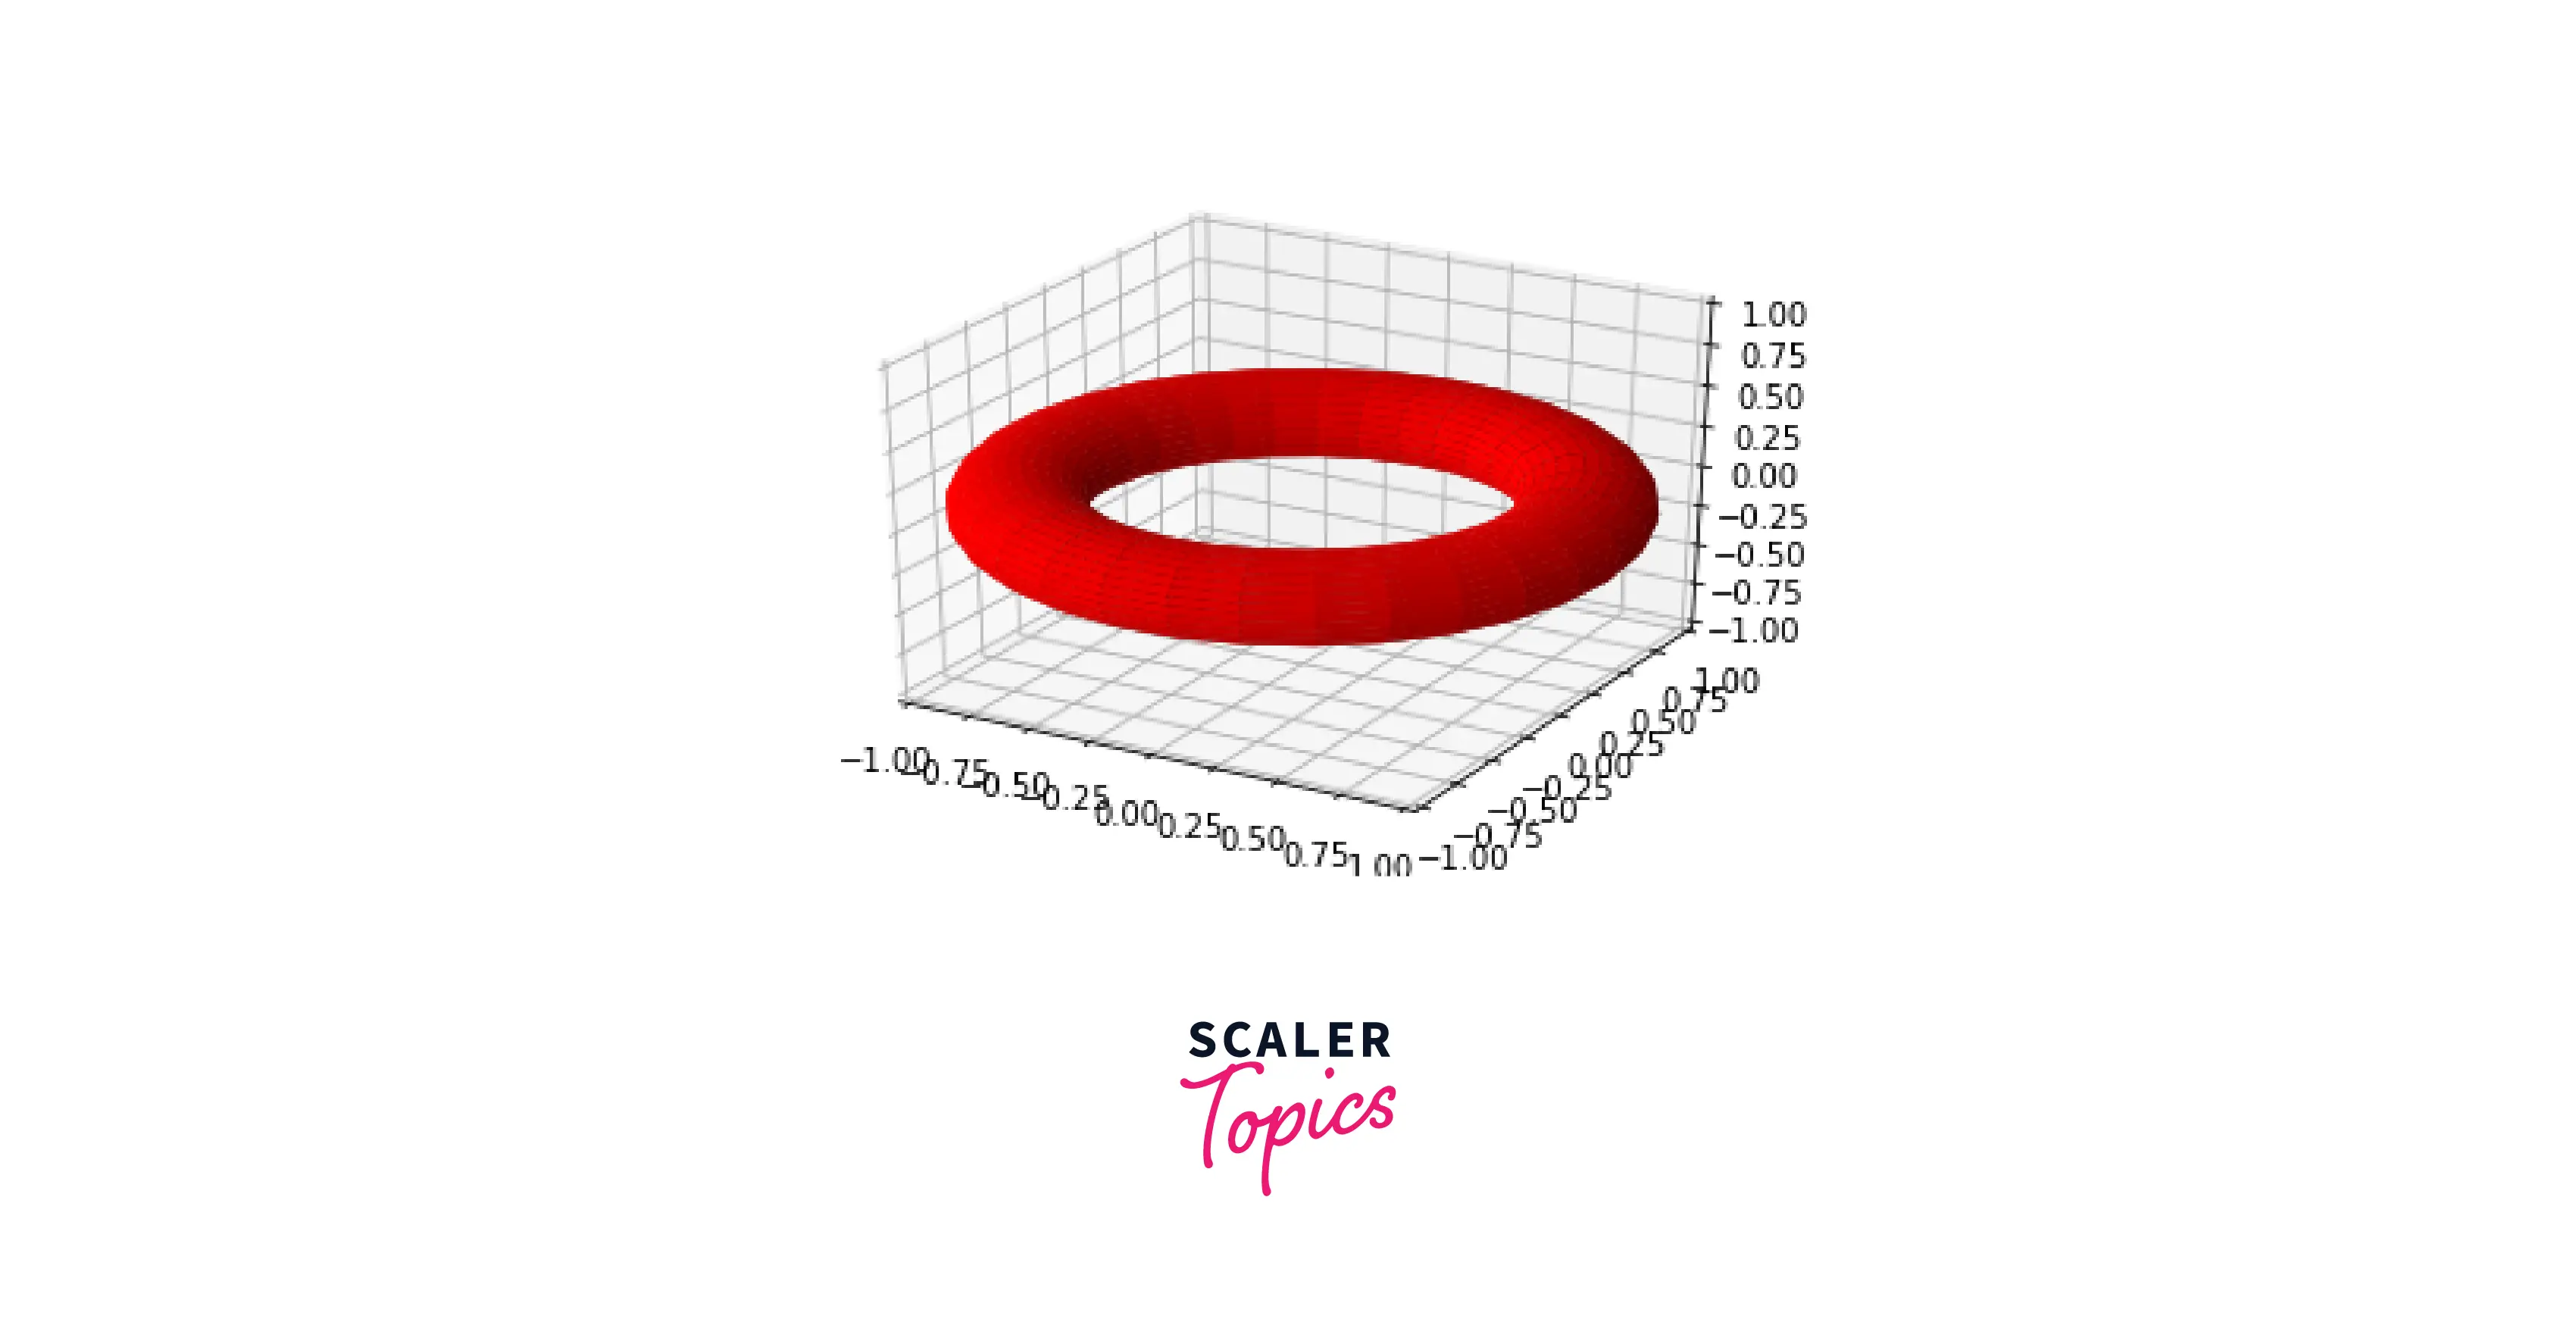
Using the dynamic and powerful plotting abilities of Matplotlib, we can plot parametric 3D surfaces. Parametric 3D surfaces are defined by a vector that traces a shape. For example, a Mobius Strip is a one-sided figure created by tracing a rectangle and a circle.
In this example, we will create a Torus, a parametric 3D surface created using two parameters; theta and phi.
Output:
Plotting a Parametric Curve
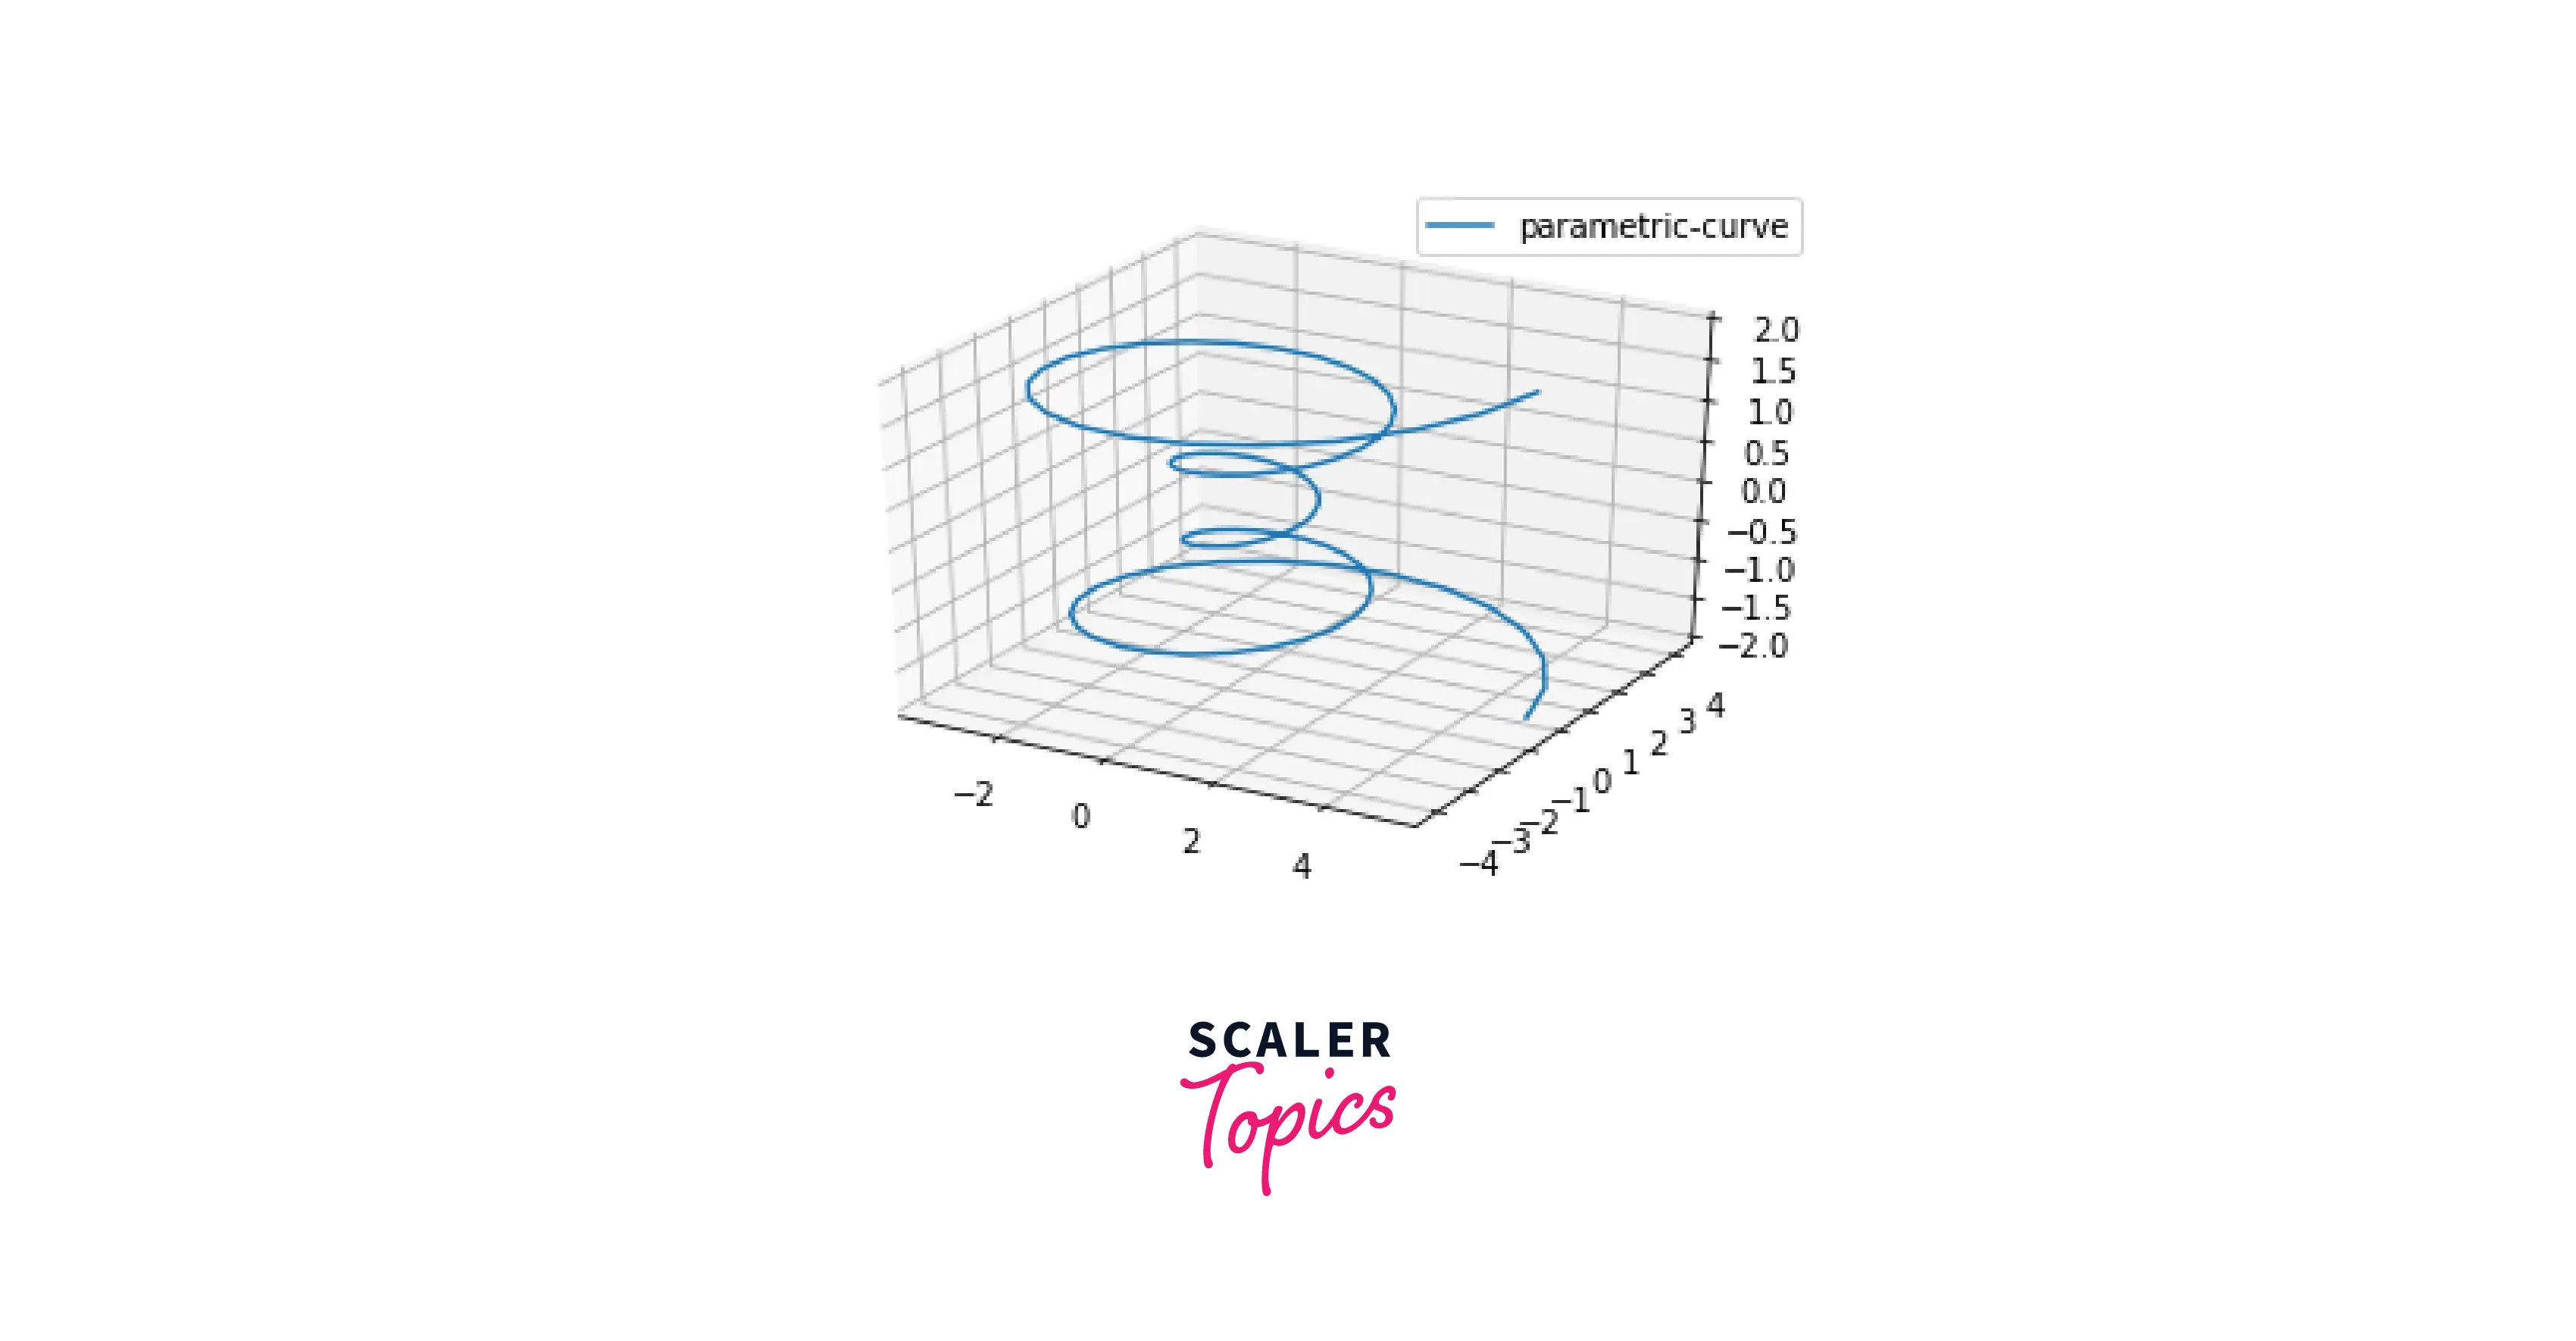
As we plotted a parametric 3D surface using Matplotlib, we can plot parametric curves too. Parametric curves are created by converting standard equations to their respective parametric forms. The noteworthy aspect of parametric curves is how they emphasize how each set of quantities is oriented concerning time.
Output:
Code Examples
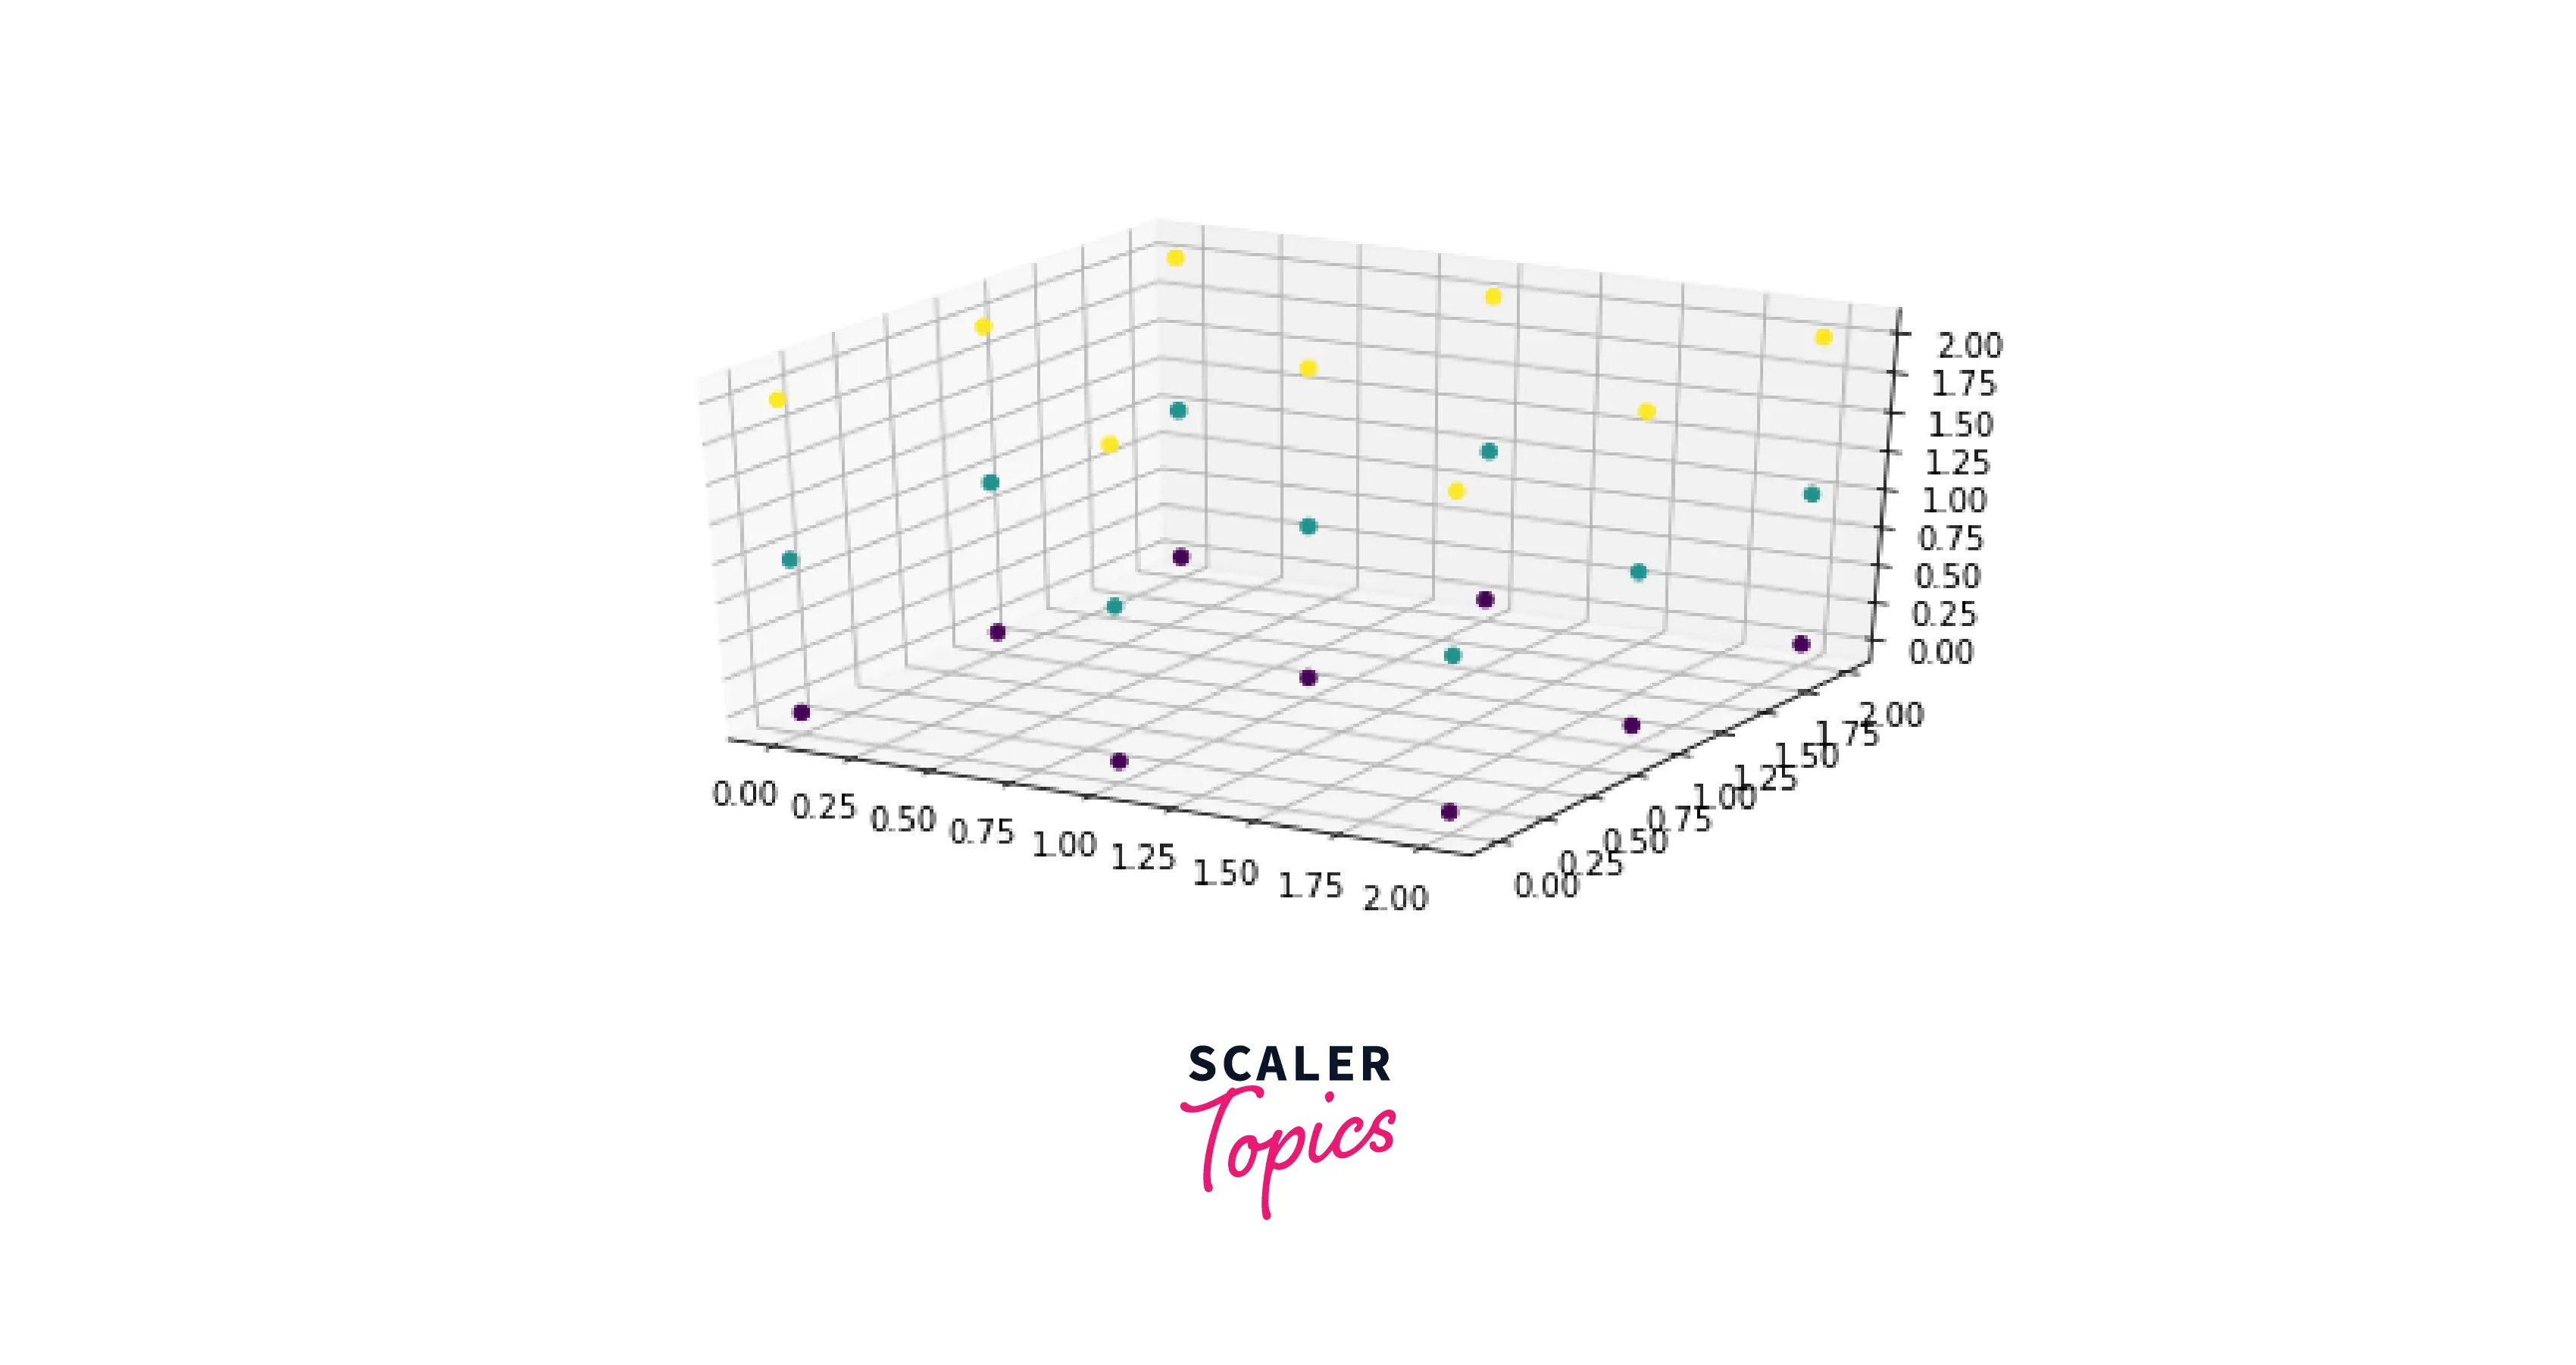
- Creating a 3D parametric plot from a 3D NumPy array
Using the plotting prowess of Matplotlib, we will plot a 3D parametric plot using a 3D NumPy array consisting of data points.
Output:
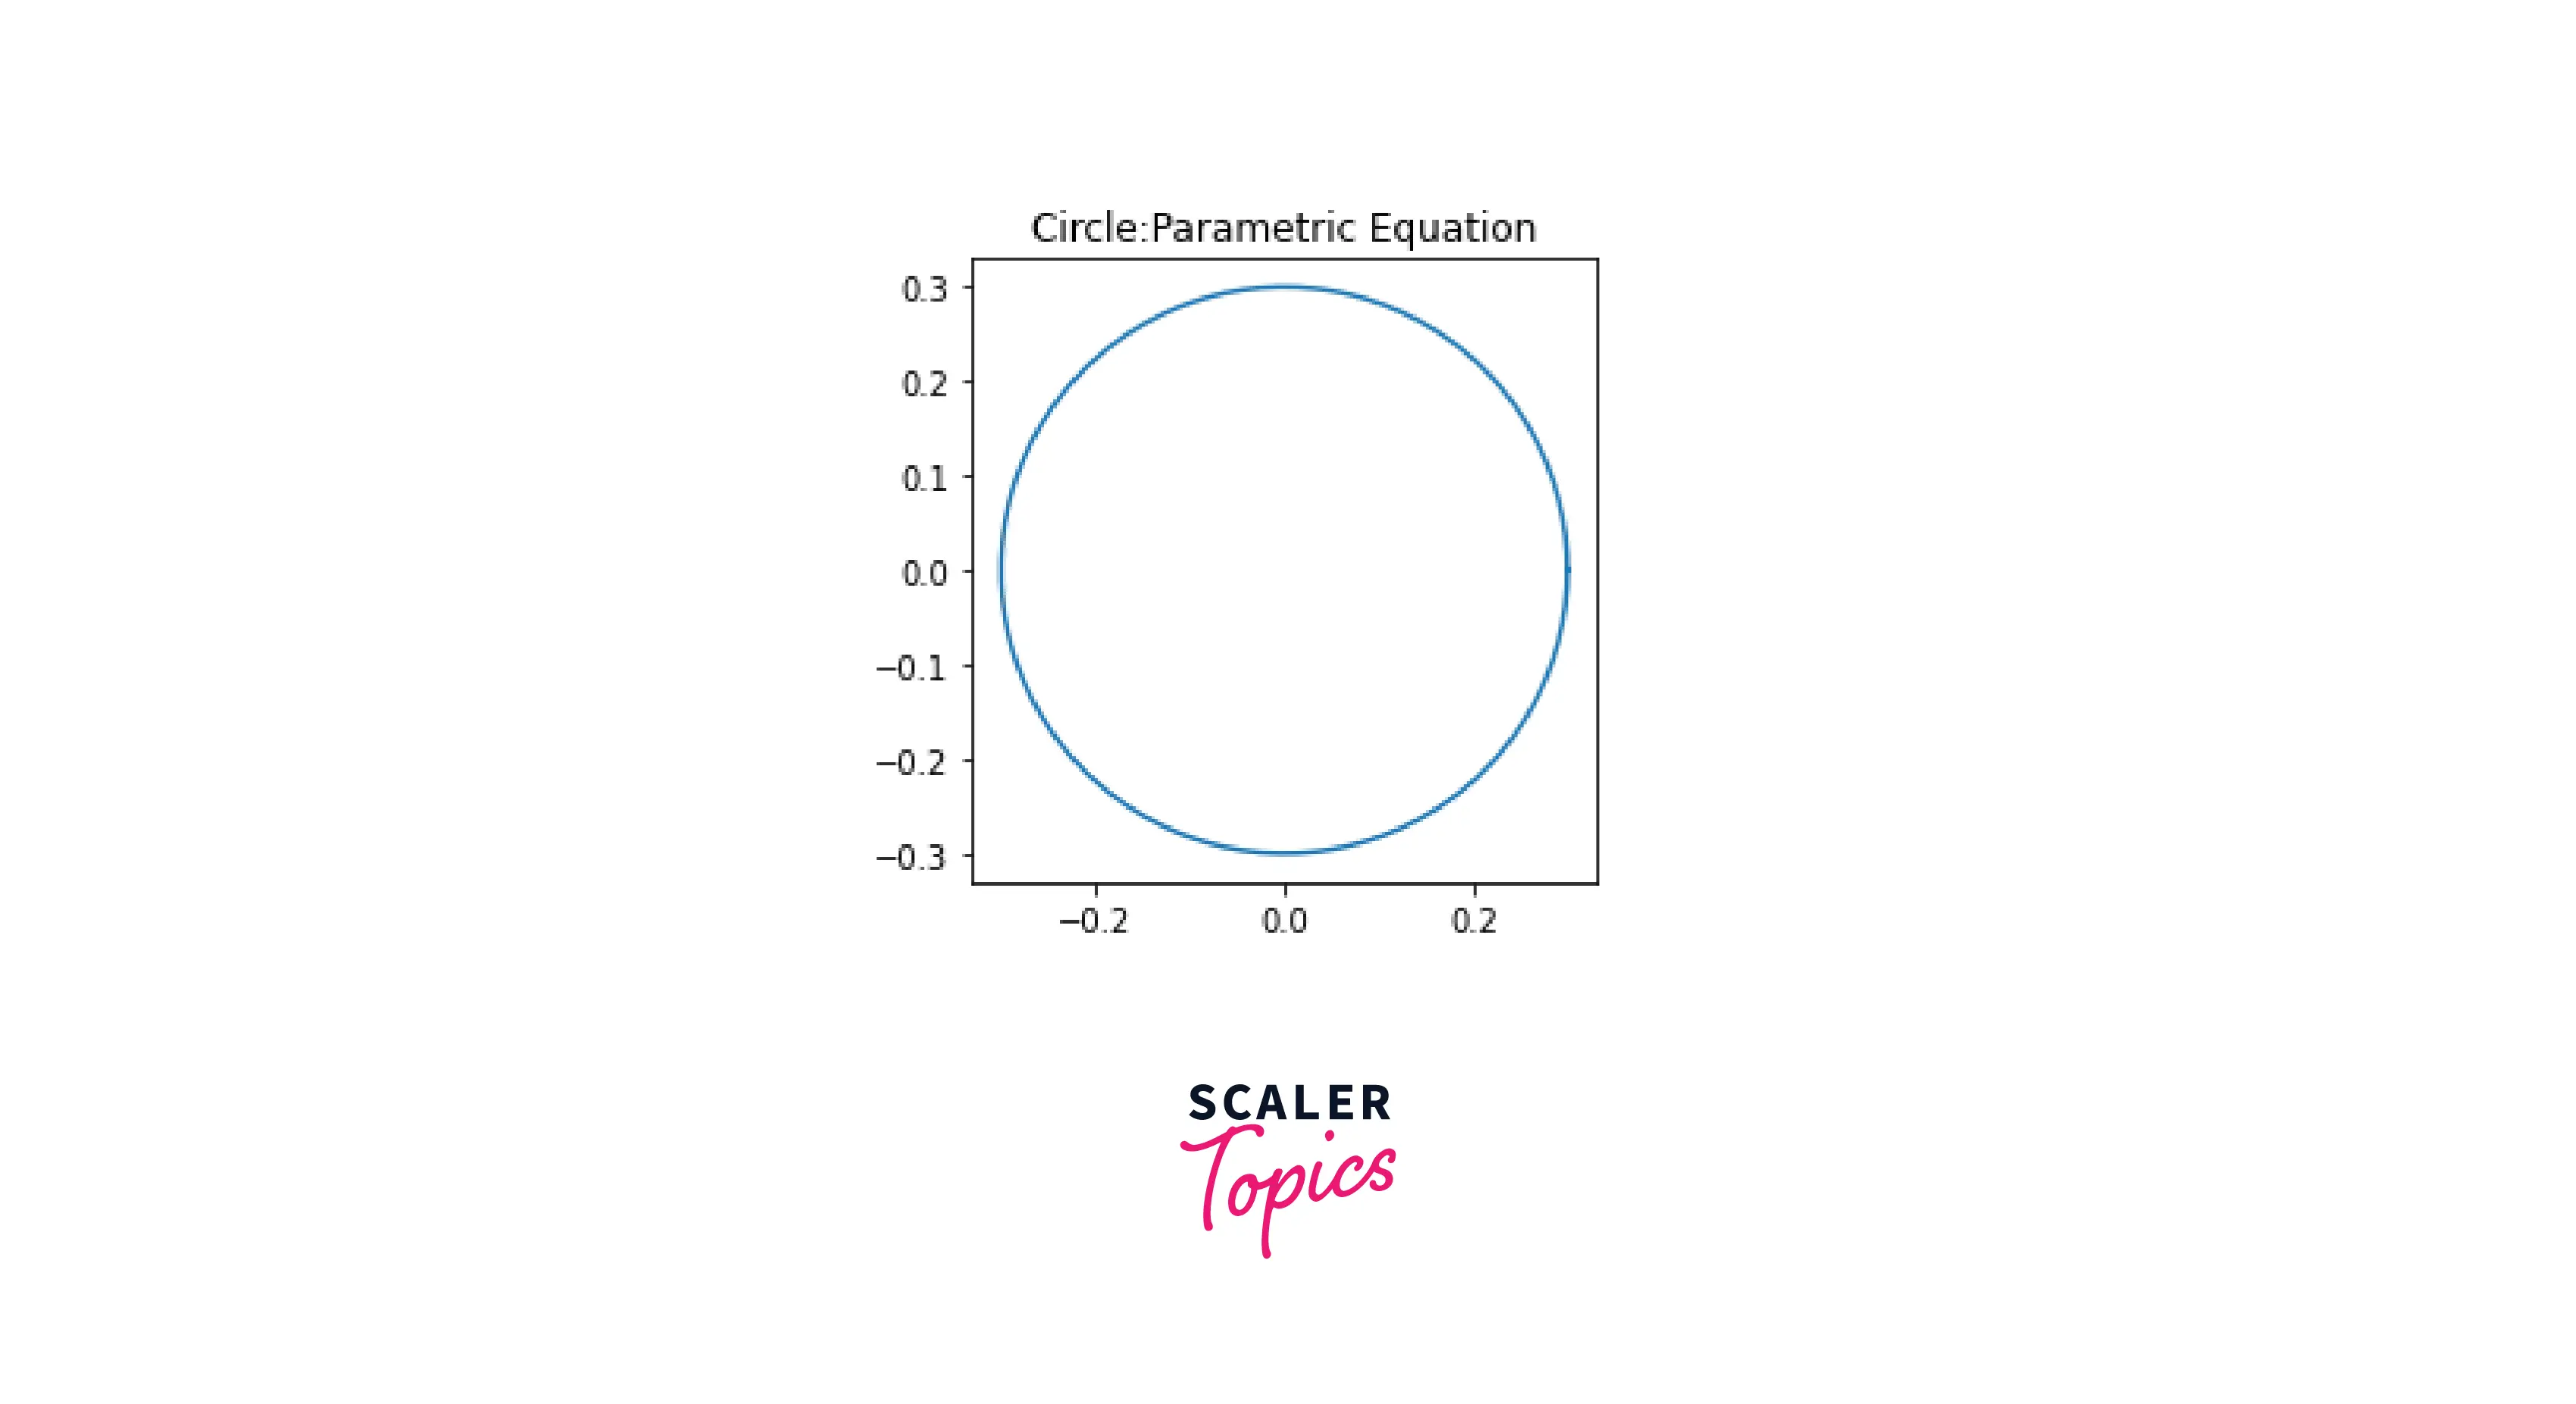
- Plotting a parametrized circle using Matplotlib
Just as we took a circle as an example to demonstrate parametric equations, we will create a plot and visualize our parametrized circle.
Output:
Conclusion
- In this article, we learned about parametric equations, where we map multiple variables in a single variable.
- To learn about working with Matplotlib and parametric equations, we created a parametric 3D surface and visualized it.
- To solidify our knowledge, we used many examples to integrate parametric curves/lines with Matplotlib.