Matplotlib | Set the aspect ratio
Overview
In monitor production, aspect ratio is the ratio between a screen's width and height. It helps us customize a screen's width and height according to our needs.
In this article, we will cover the meaning of aspect ratio in matplotlib, its purpose, and various parameters that help us to set the aspect ratio of our plots to whatever we want.
Apart from this, we will also see some intriguing examples containing three-dimensional plots.
Introduction
Matplotlib is a popular Python tool for data visualization. As defined above, the matplotlib aspect ratio will help us to change the width and the height of our plots according to our needs. To explain this clearly, let's take an example:
This is a normal plot in matplotlib:

If we want to change the shape of our plot, we will set its matplotlib aspect ratio as custom:
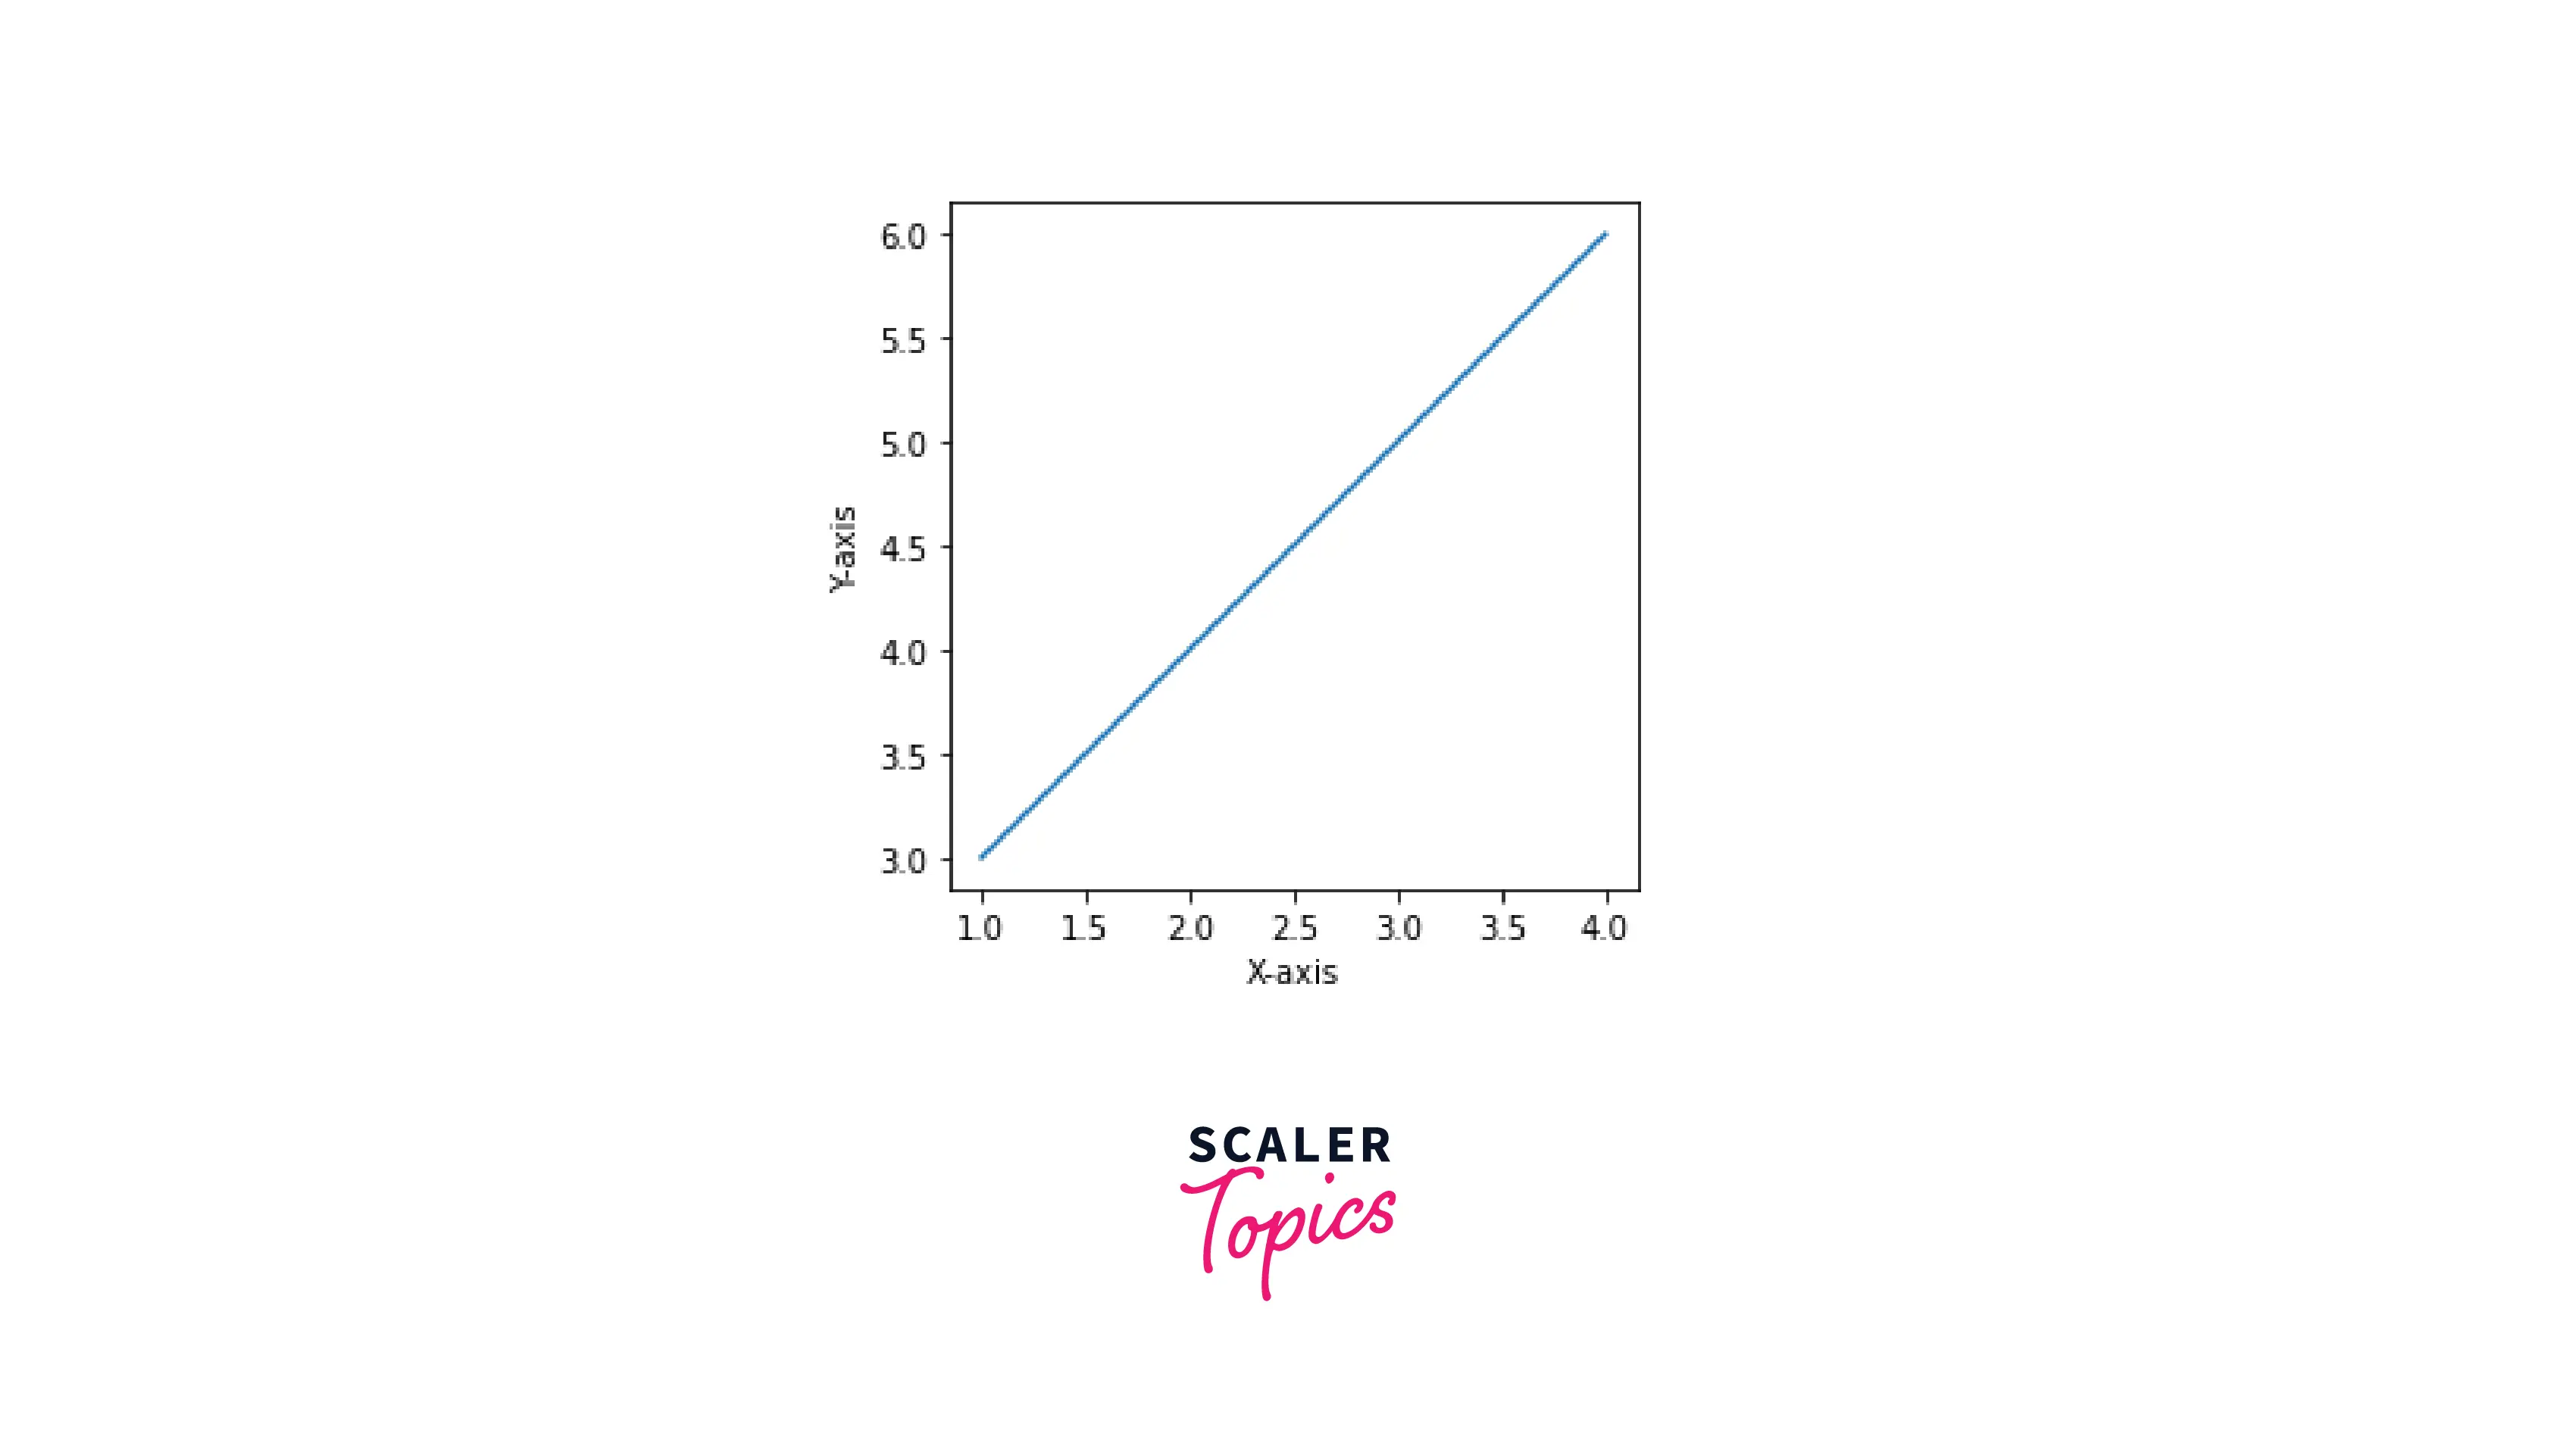
In the above figure, the matplotlib aspect ratio has changed; The x and y axes have been reduced by 4. Hence, we can see the difference between the two plots. Further, in this article, we will understand the parameters and different attributes of aspect ratio in matplotlib.
Set Aspect Ratio in Matplotlib
Scaler Placement Report and Statistics
Scaler learners achieved 2.5x salary growth with average post-Scaler CTC reaching ₹23L.
a) How does it work?
Matplotlib aspect ratio is set using the set_aspect() function. When using the function, it basically manipulates the data-coordinate system of matplotlib. It changes the axes of our plots according to the parameter we pass in the function.
b) Syntax
Transform Your Career
Choose from our industry-leading programs designed for career success
Modern Software and AI Engineering Program
Master full-stack development with AI integration

Modern Data Science and ML with specialisation in AI
Advanced data science techniques with AI specialization
Advanced AIML with Specialisation in Agentic AI
Deep dive into AIML with focus on Agentic systems
DevOps, Cloud & AI Platform Engineering
Build and manage AI-powered cloud infrastructure
AI Engineering Advanced Certification by IIT-Roorkee
Premier AI engineering certification from IIT-Roorkee
c) Parameters
aspect: Can be auto or equal. When auto is selected, data is automatically filled into the rectangle.
adjustable: None by default.
anchor: This determines where the axes will be drawn if there is excess space due to aspect limits.
Cases of Setting the Aspect Ratio in Matplotlib
This section will go through different cases for setting up the matplotlib aspect ratio.
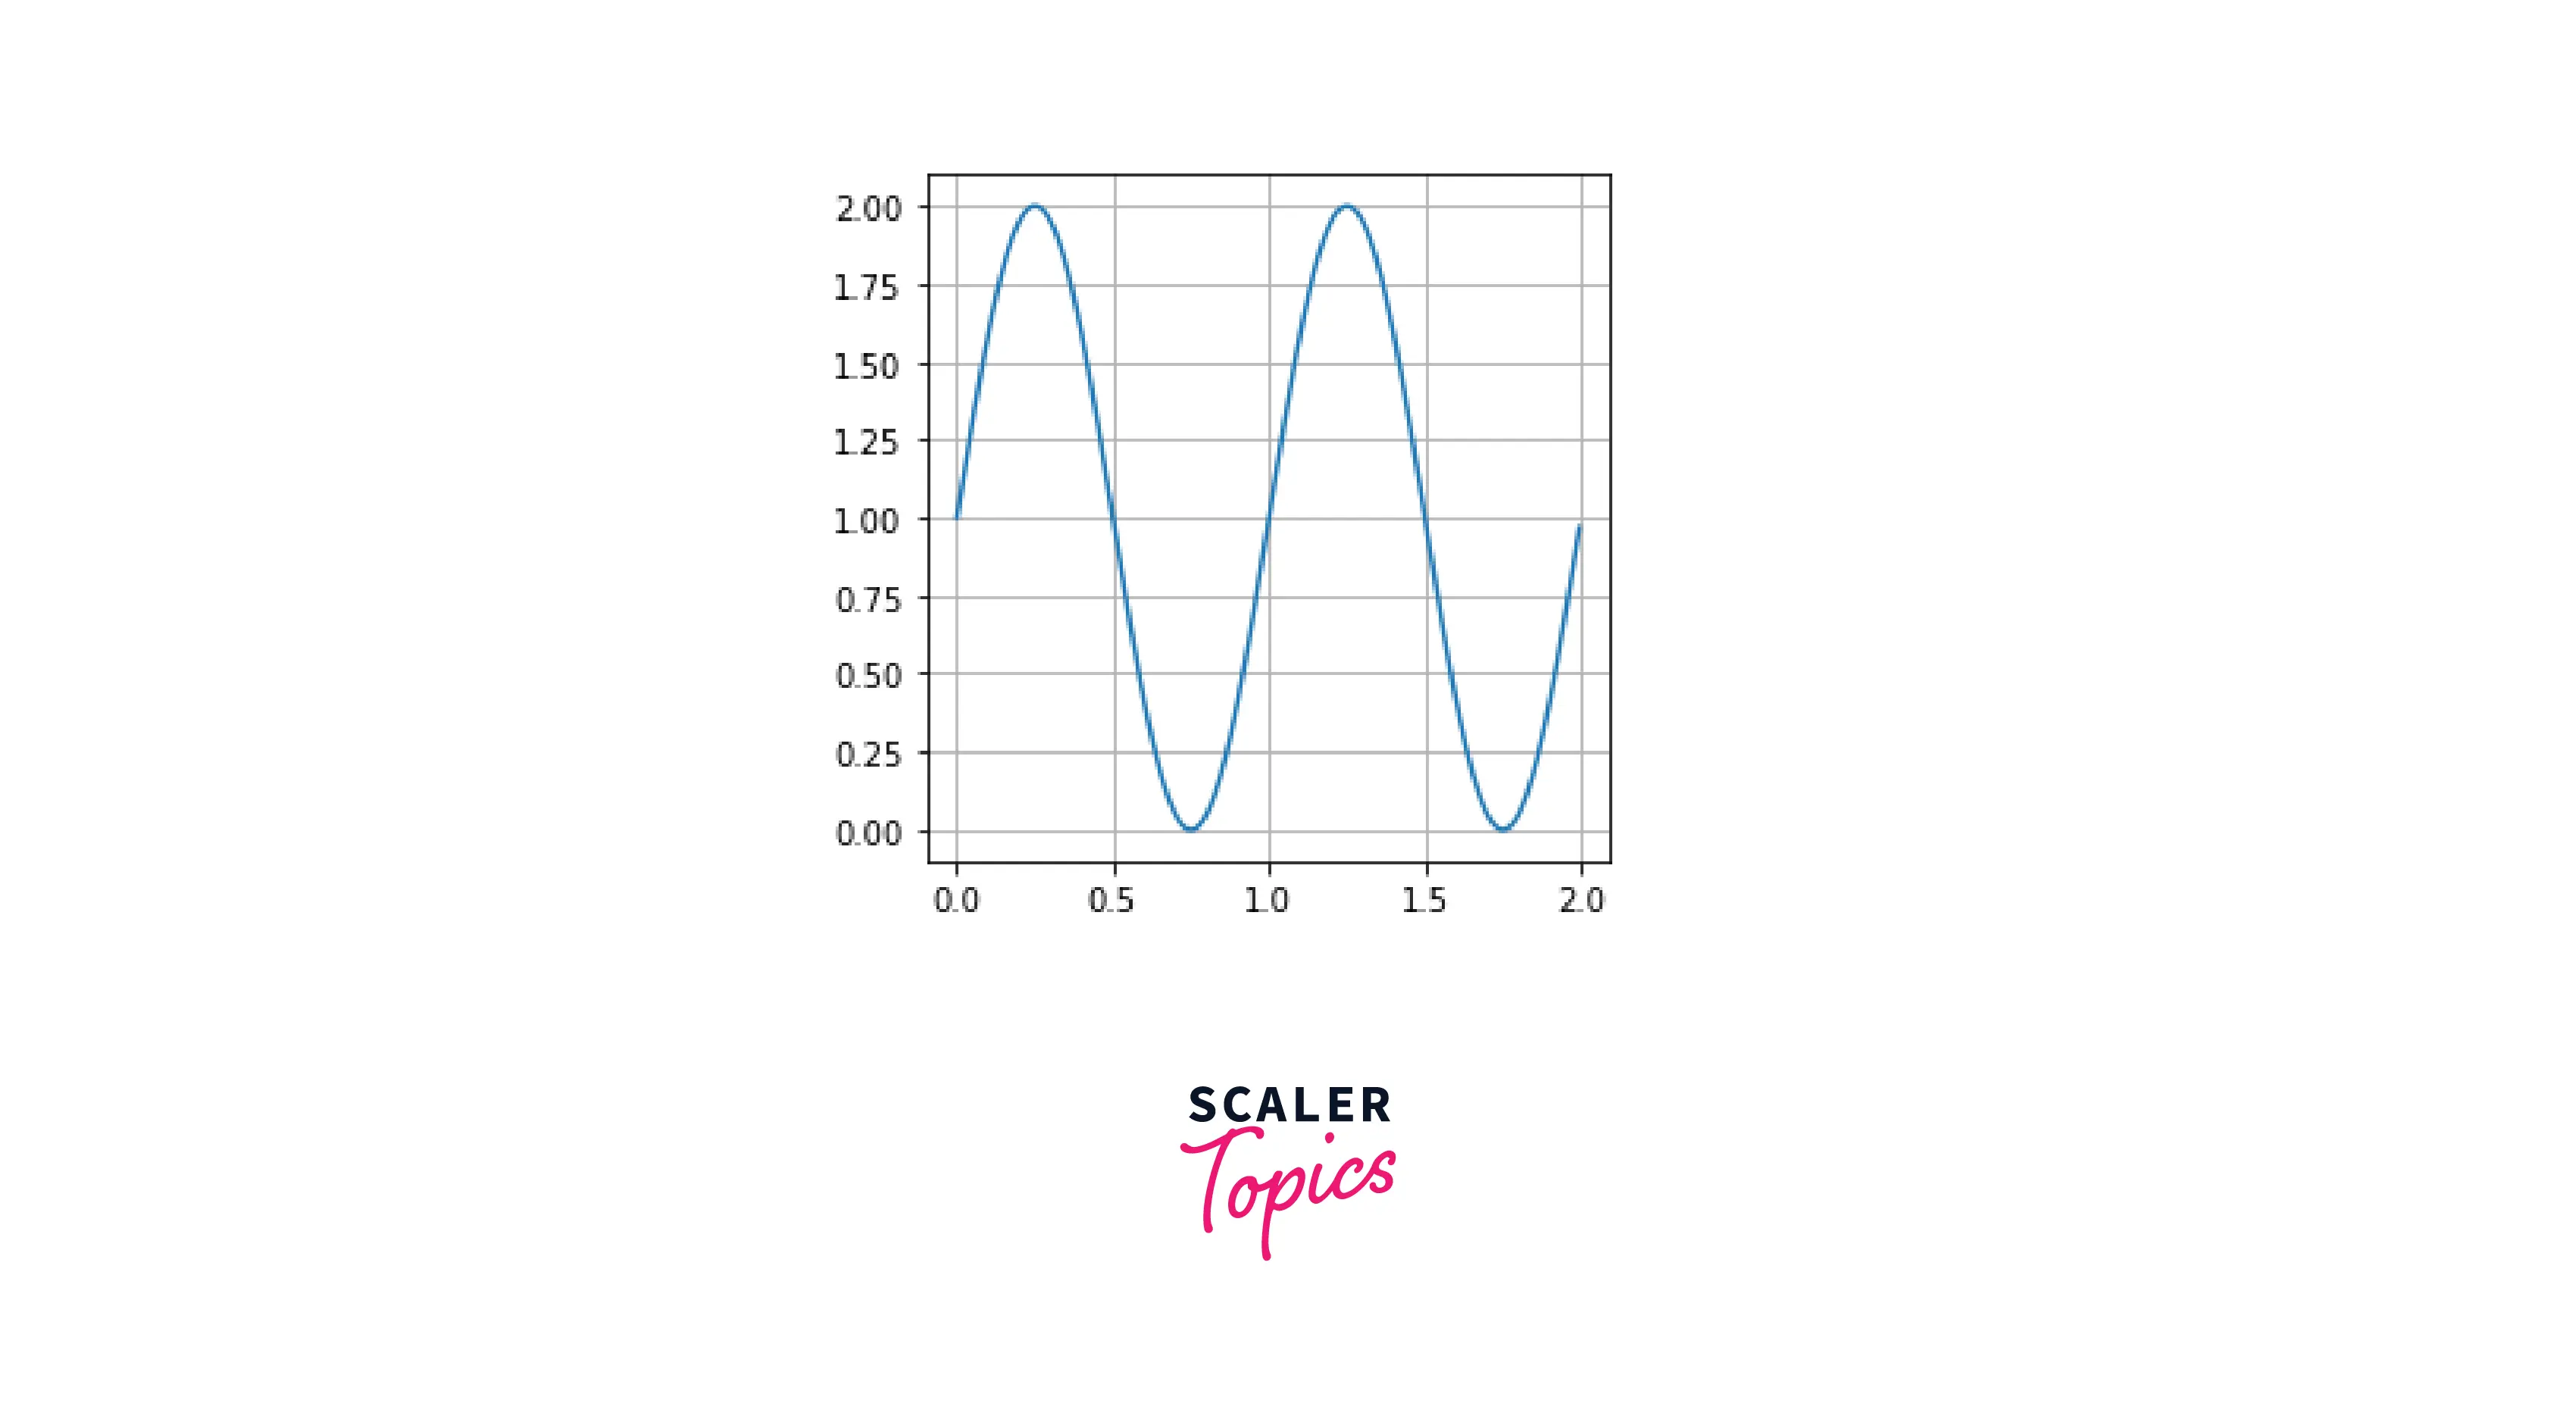
Square Aspect Ratio
In the square aspect ratio, we try to convert our x and y axes into the same number to make the axes appear like a square. This is because all the axes have the same starting and ending points.
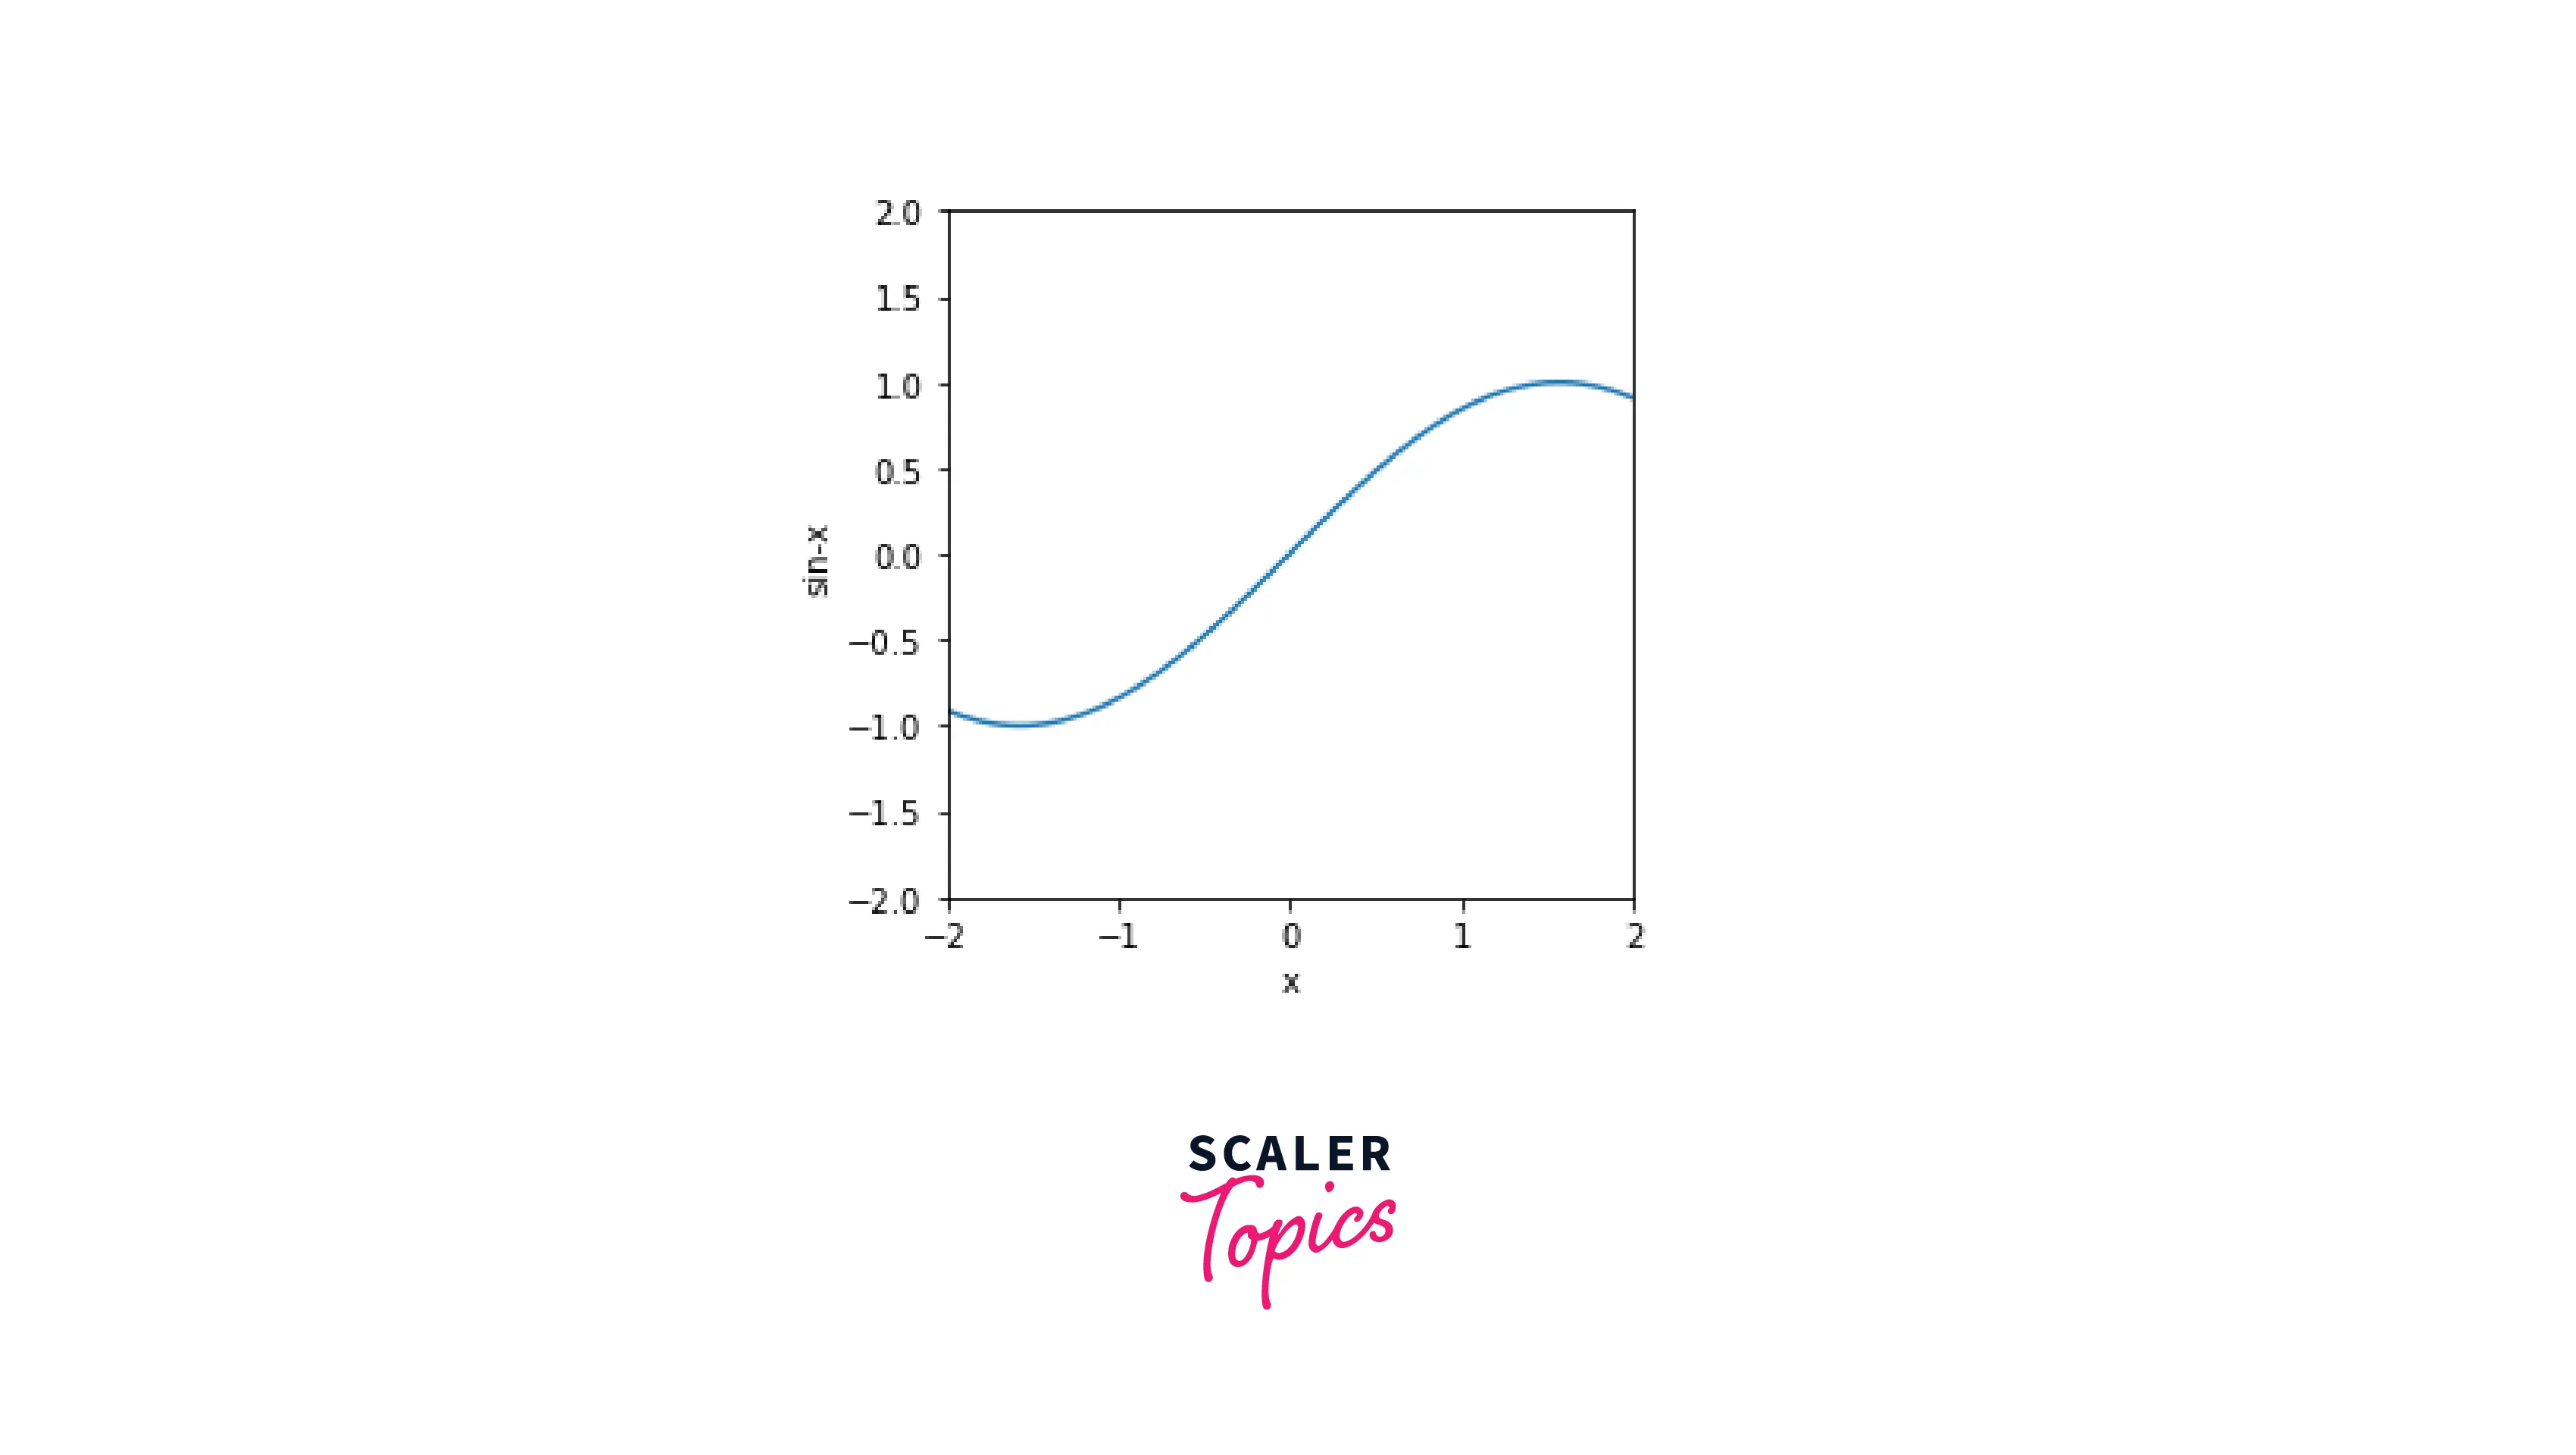
Explanation
To explain this process, we will create a sine-wave plot. First, we create our sine wave by using the sin() function in NumPy, and after that, we initialize our axes. After initializing, we set our x and y axes to be similar (square has the same axes). Then, we use the 'equal' parameter in set_aspect() to equalize our axes.
Output:
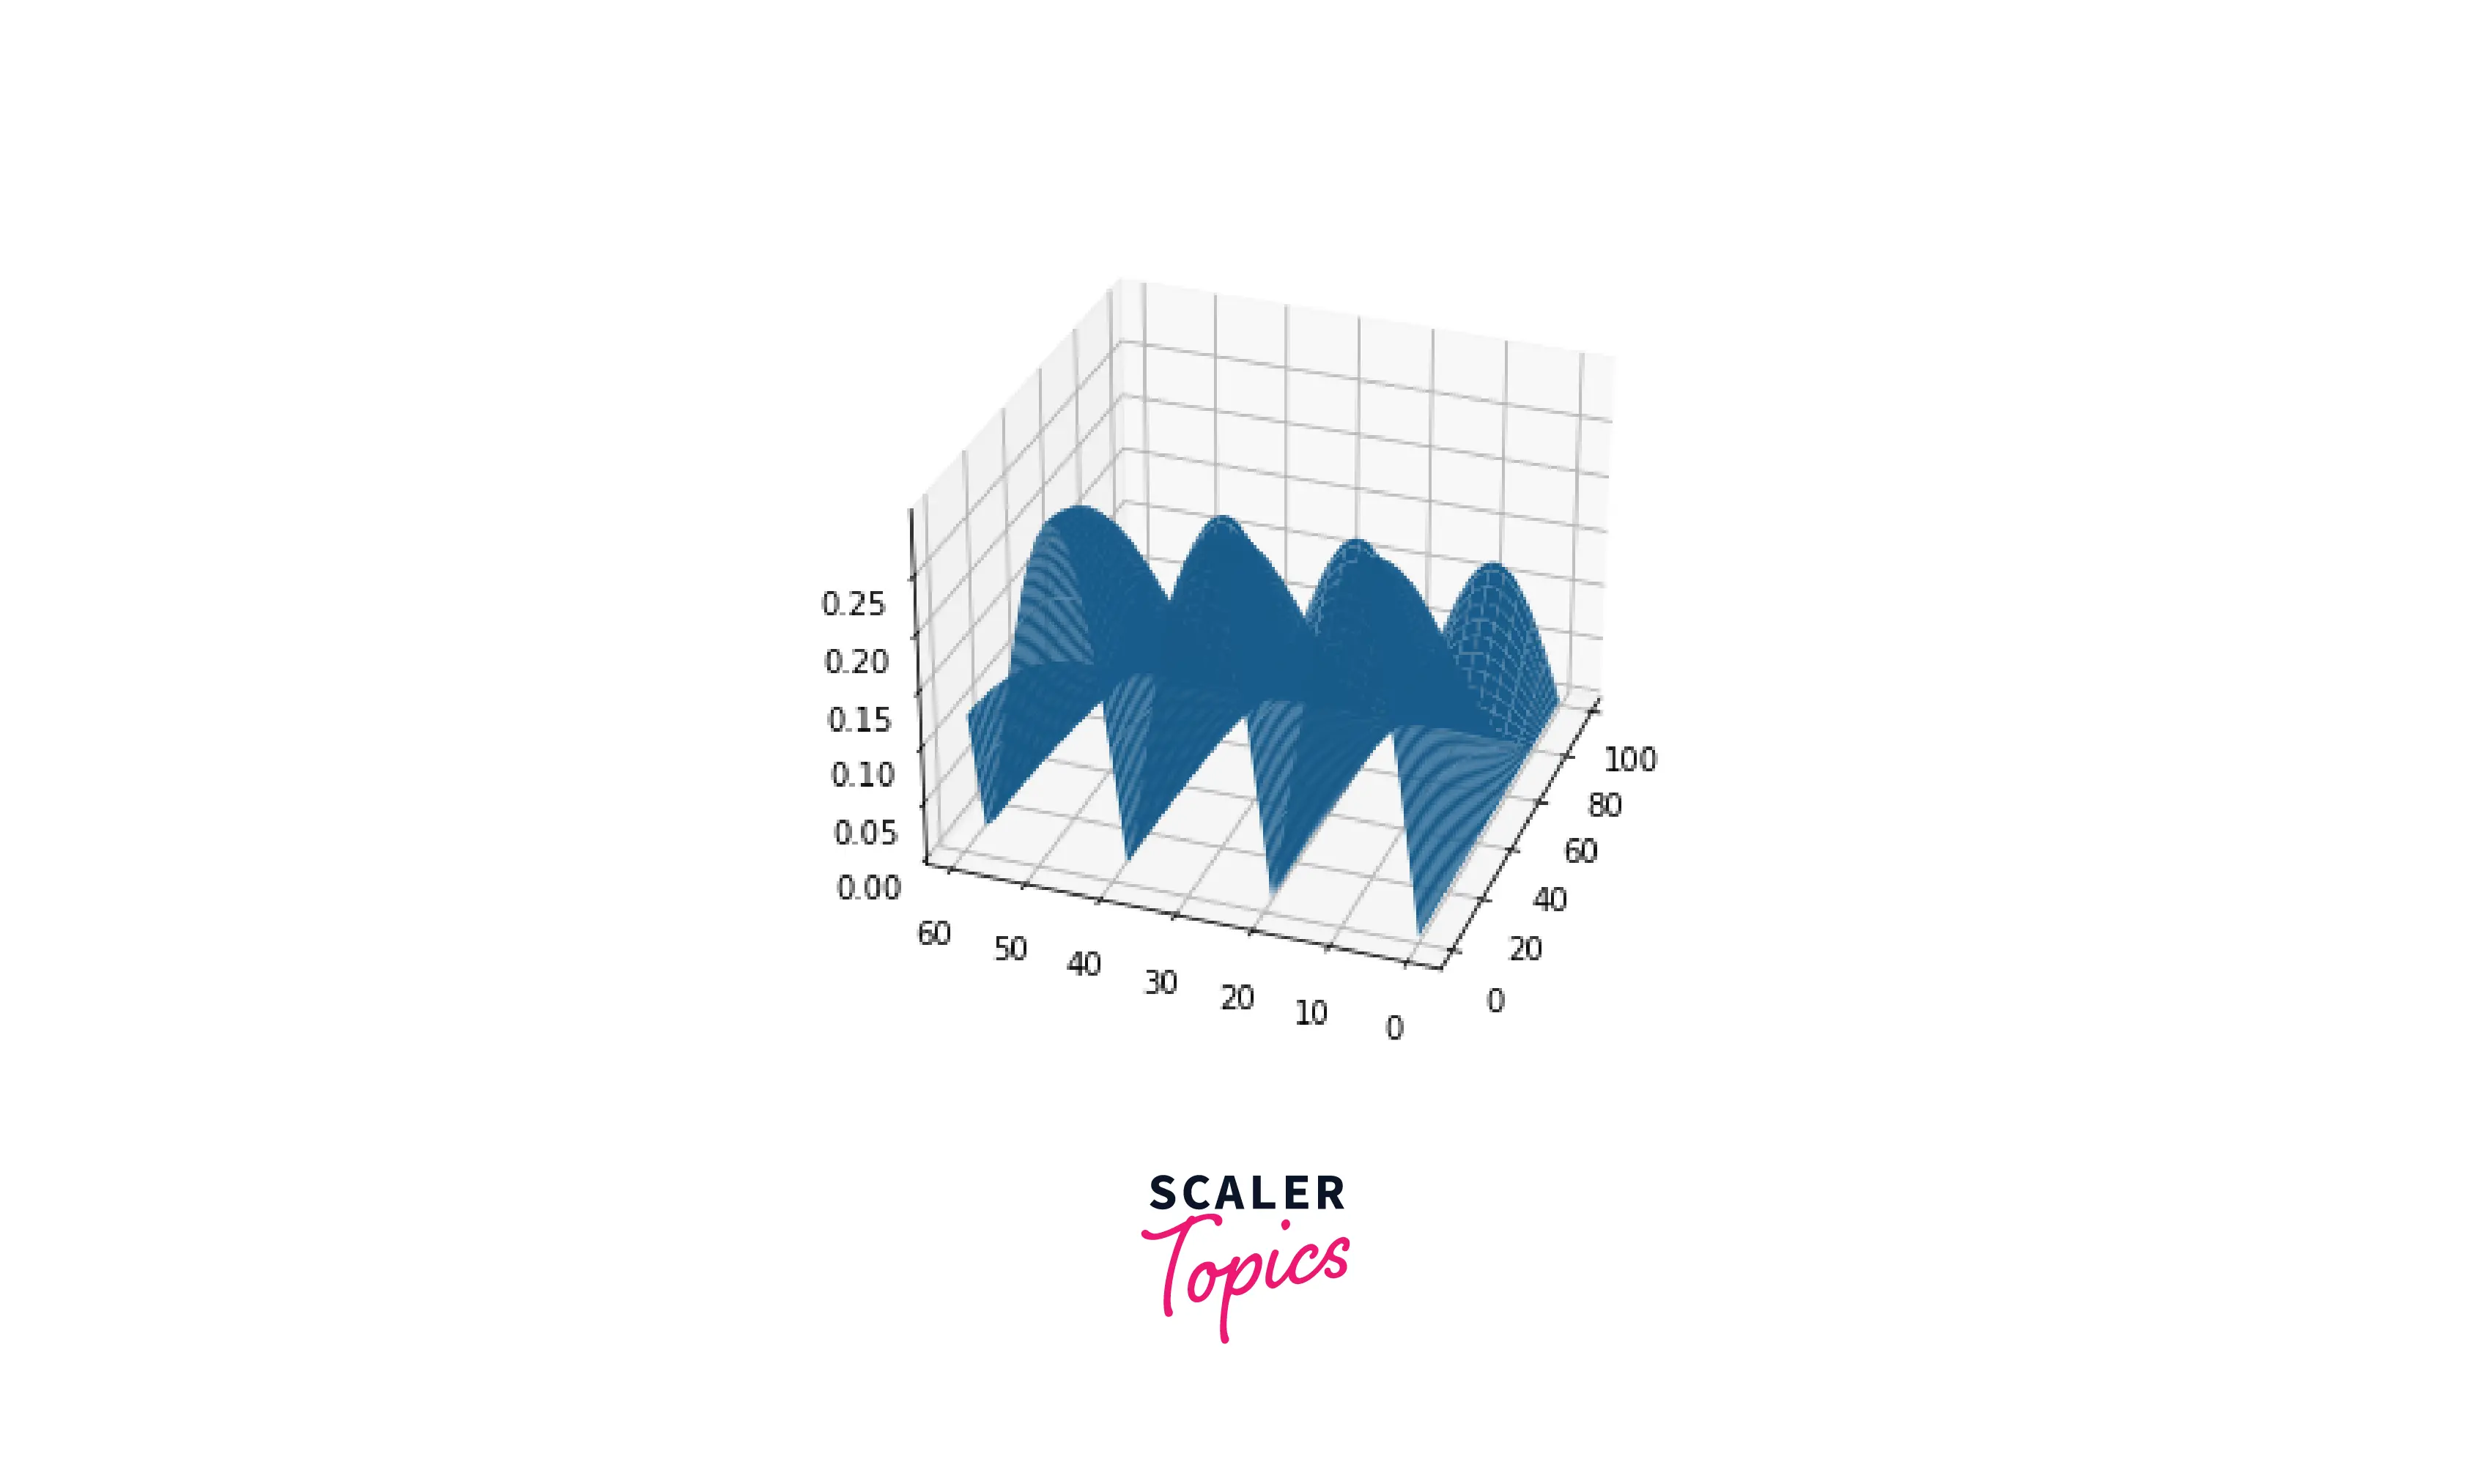
3-D Plot Aspect Ratio
Matplotlib is a powerful graphing tool in Python that allows us to create three-dimensional plots in no time. We will use that functionality to create a three-dimensional figure, and then change its orientation using the set_aspect() function.
Explanation
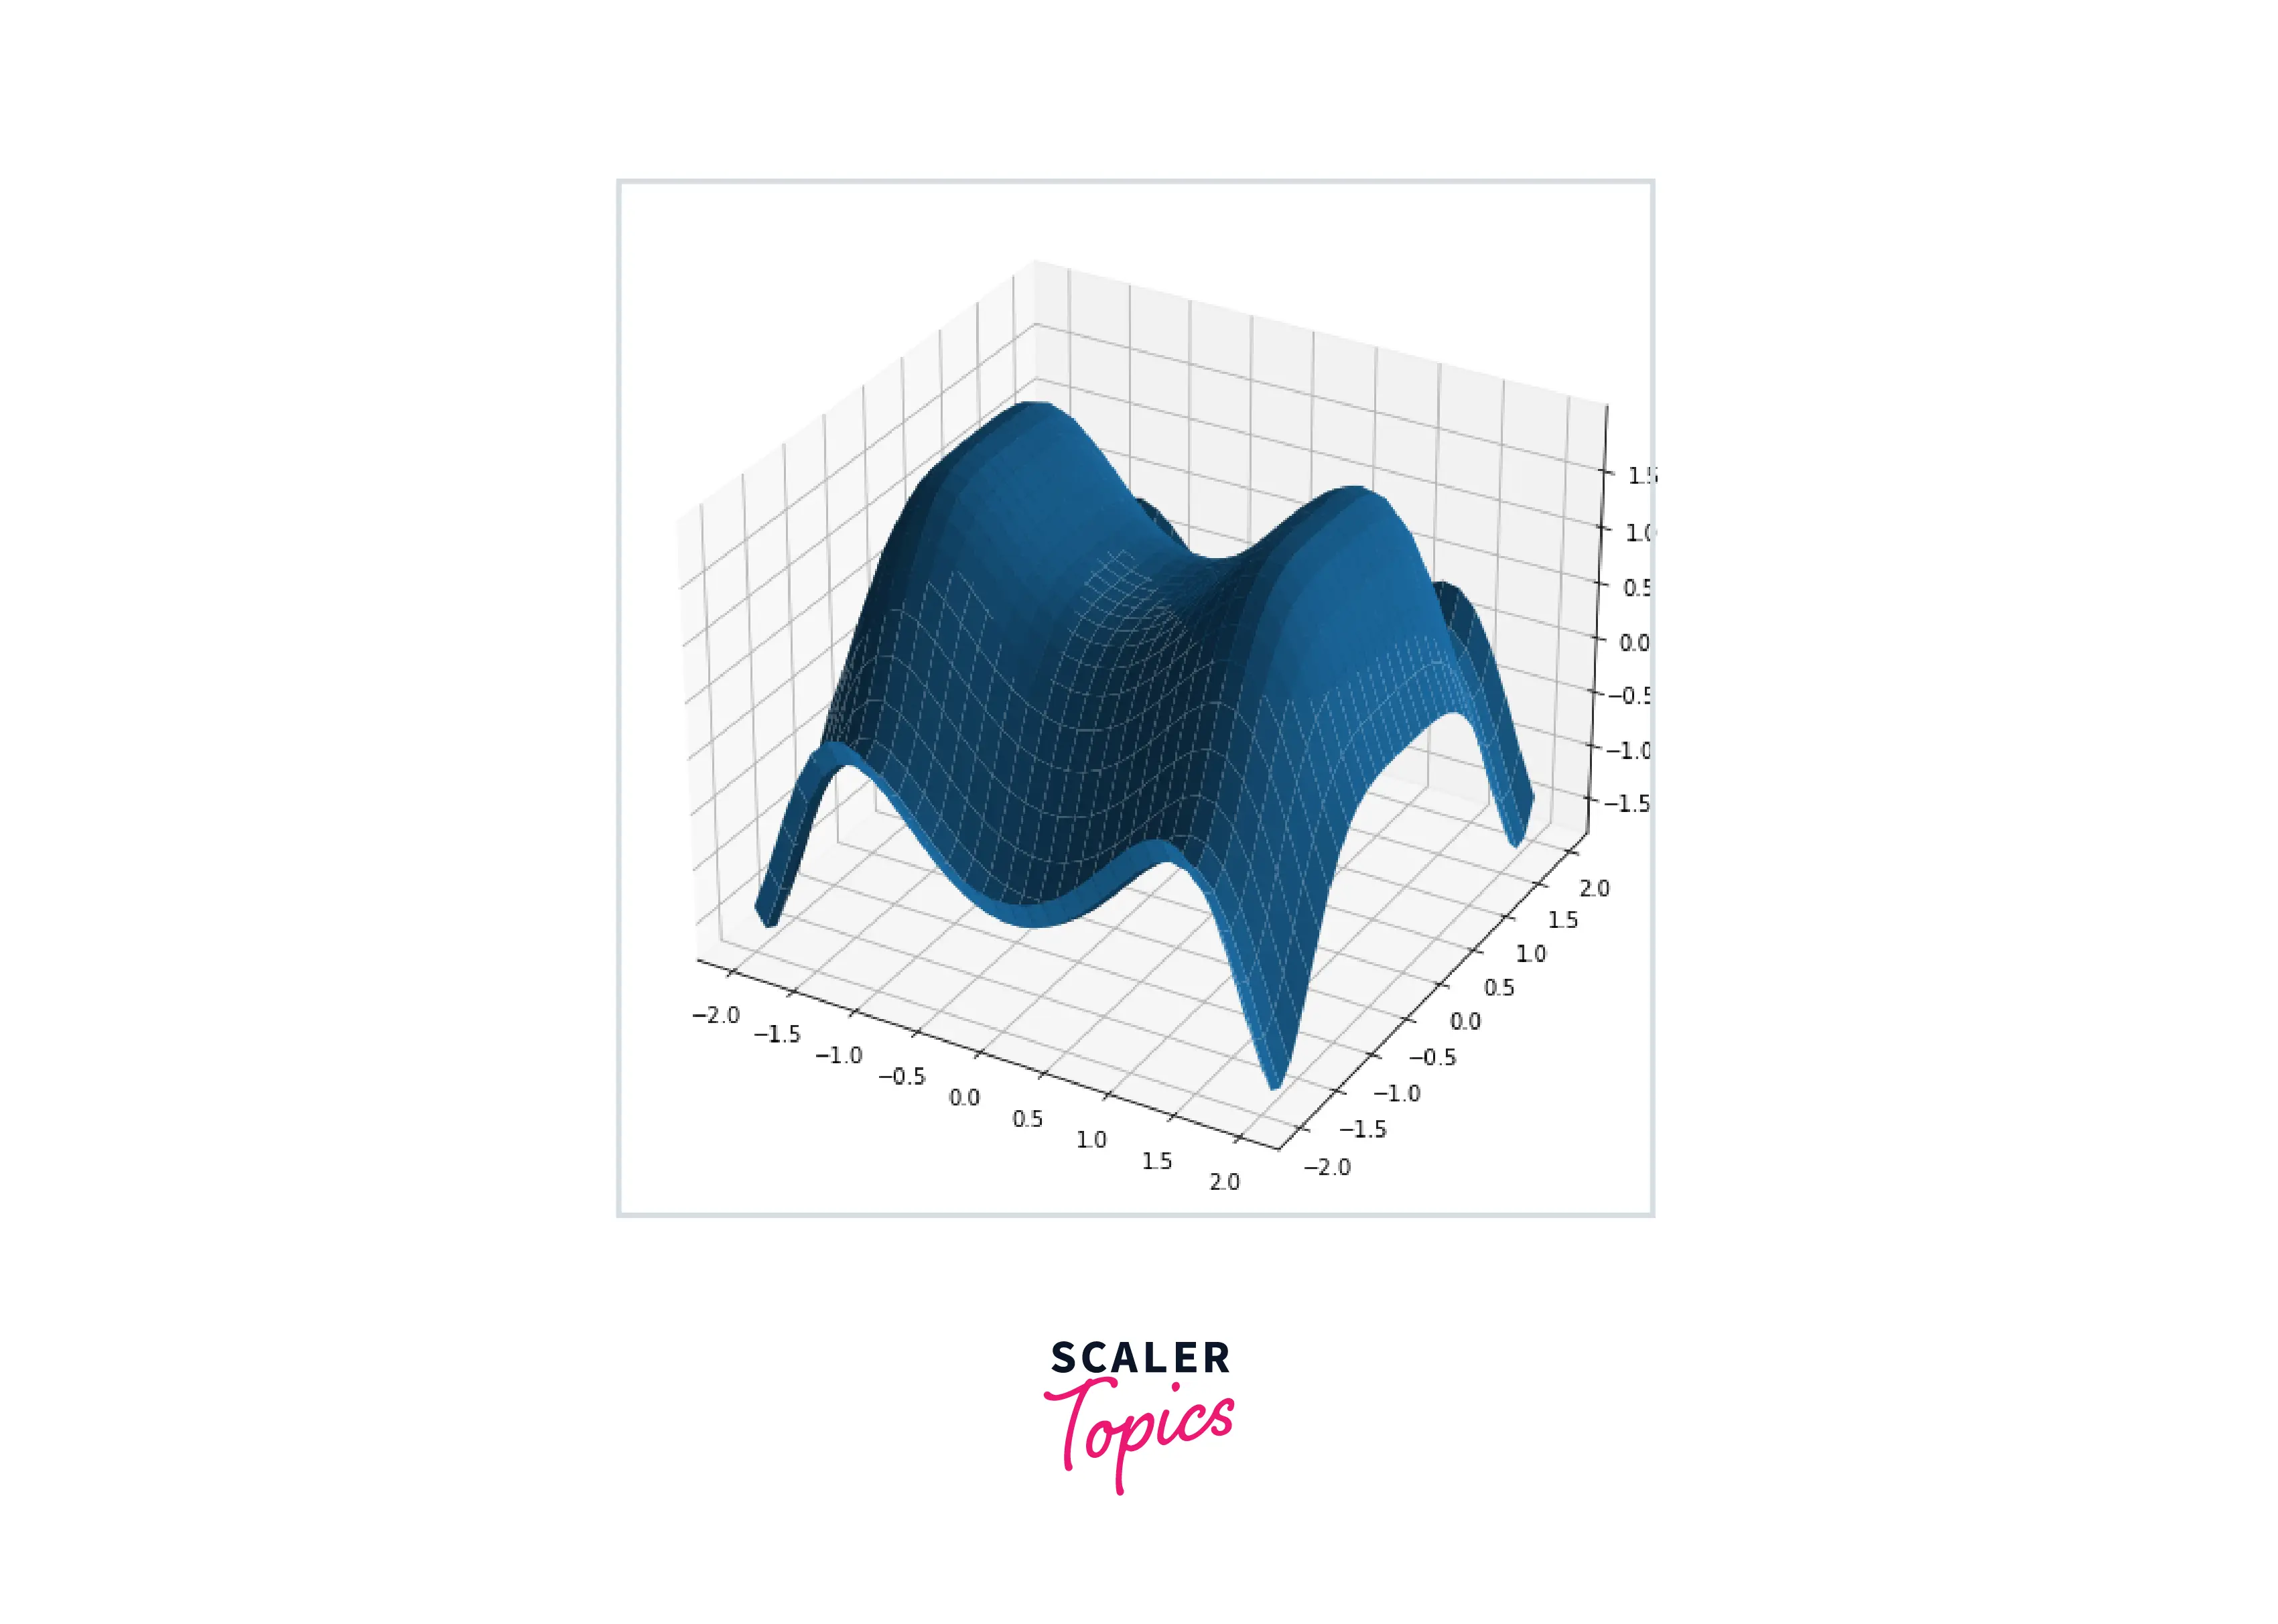
We will create a three-dimensional plot in matplotlib using the "projection" parameter in the axes() function. As you can see below, the axes of this plot are not equalized.
To change its matplotlib aspect ratio, we will use the set_aspect() function. We will also use the ptp() function in NumPy to get the peak-to-peak value range from the minimum to the maximum.
Output:
Before setting the aspect ratio:
After setting aspect-ratio:
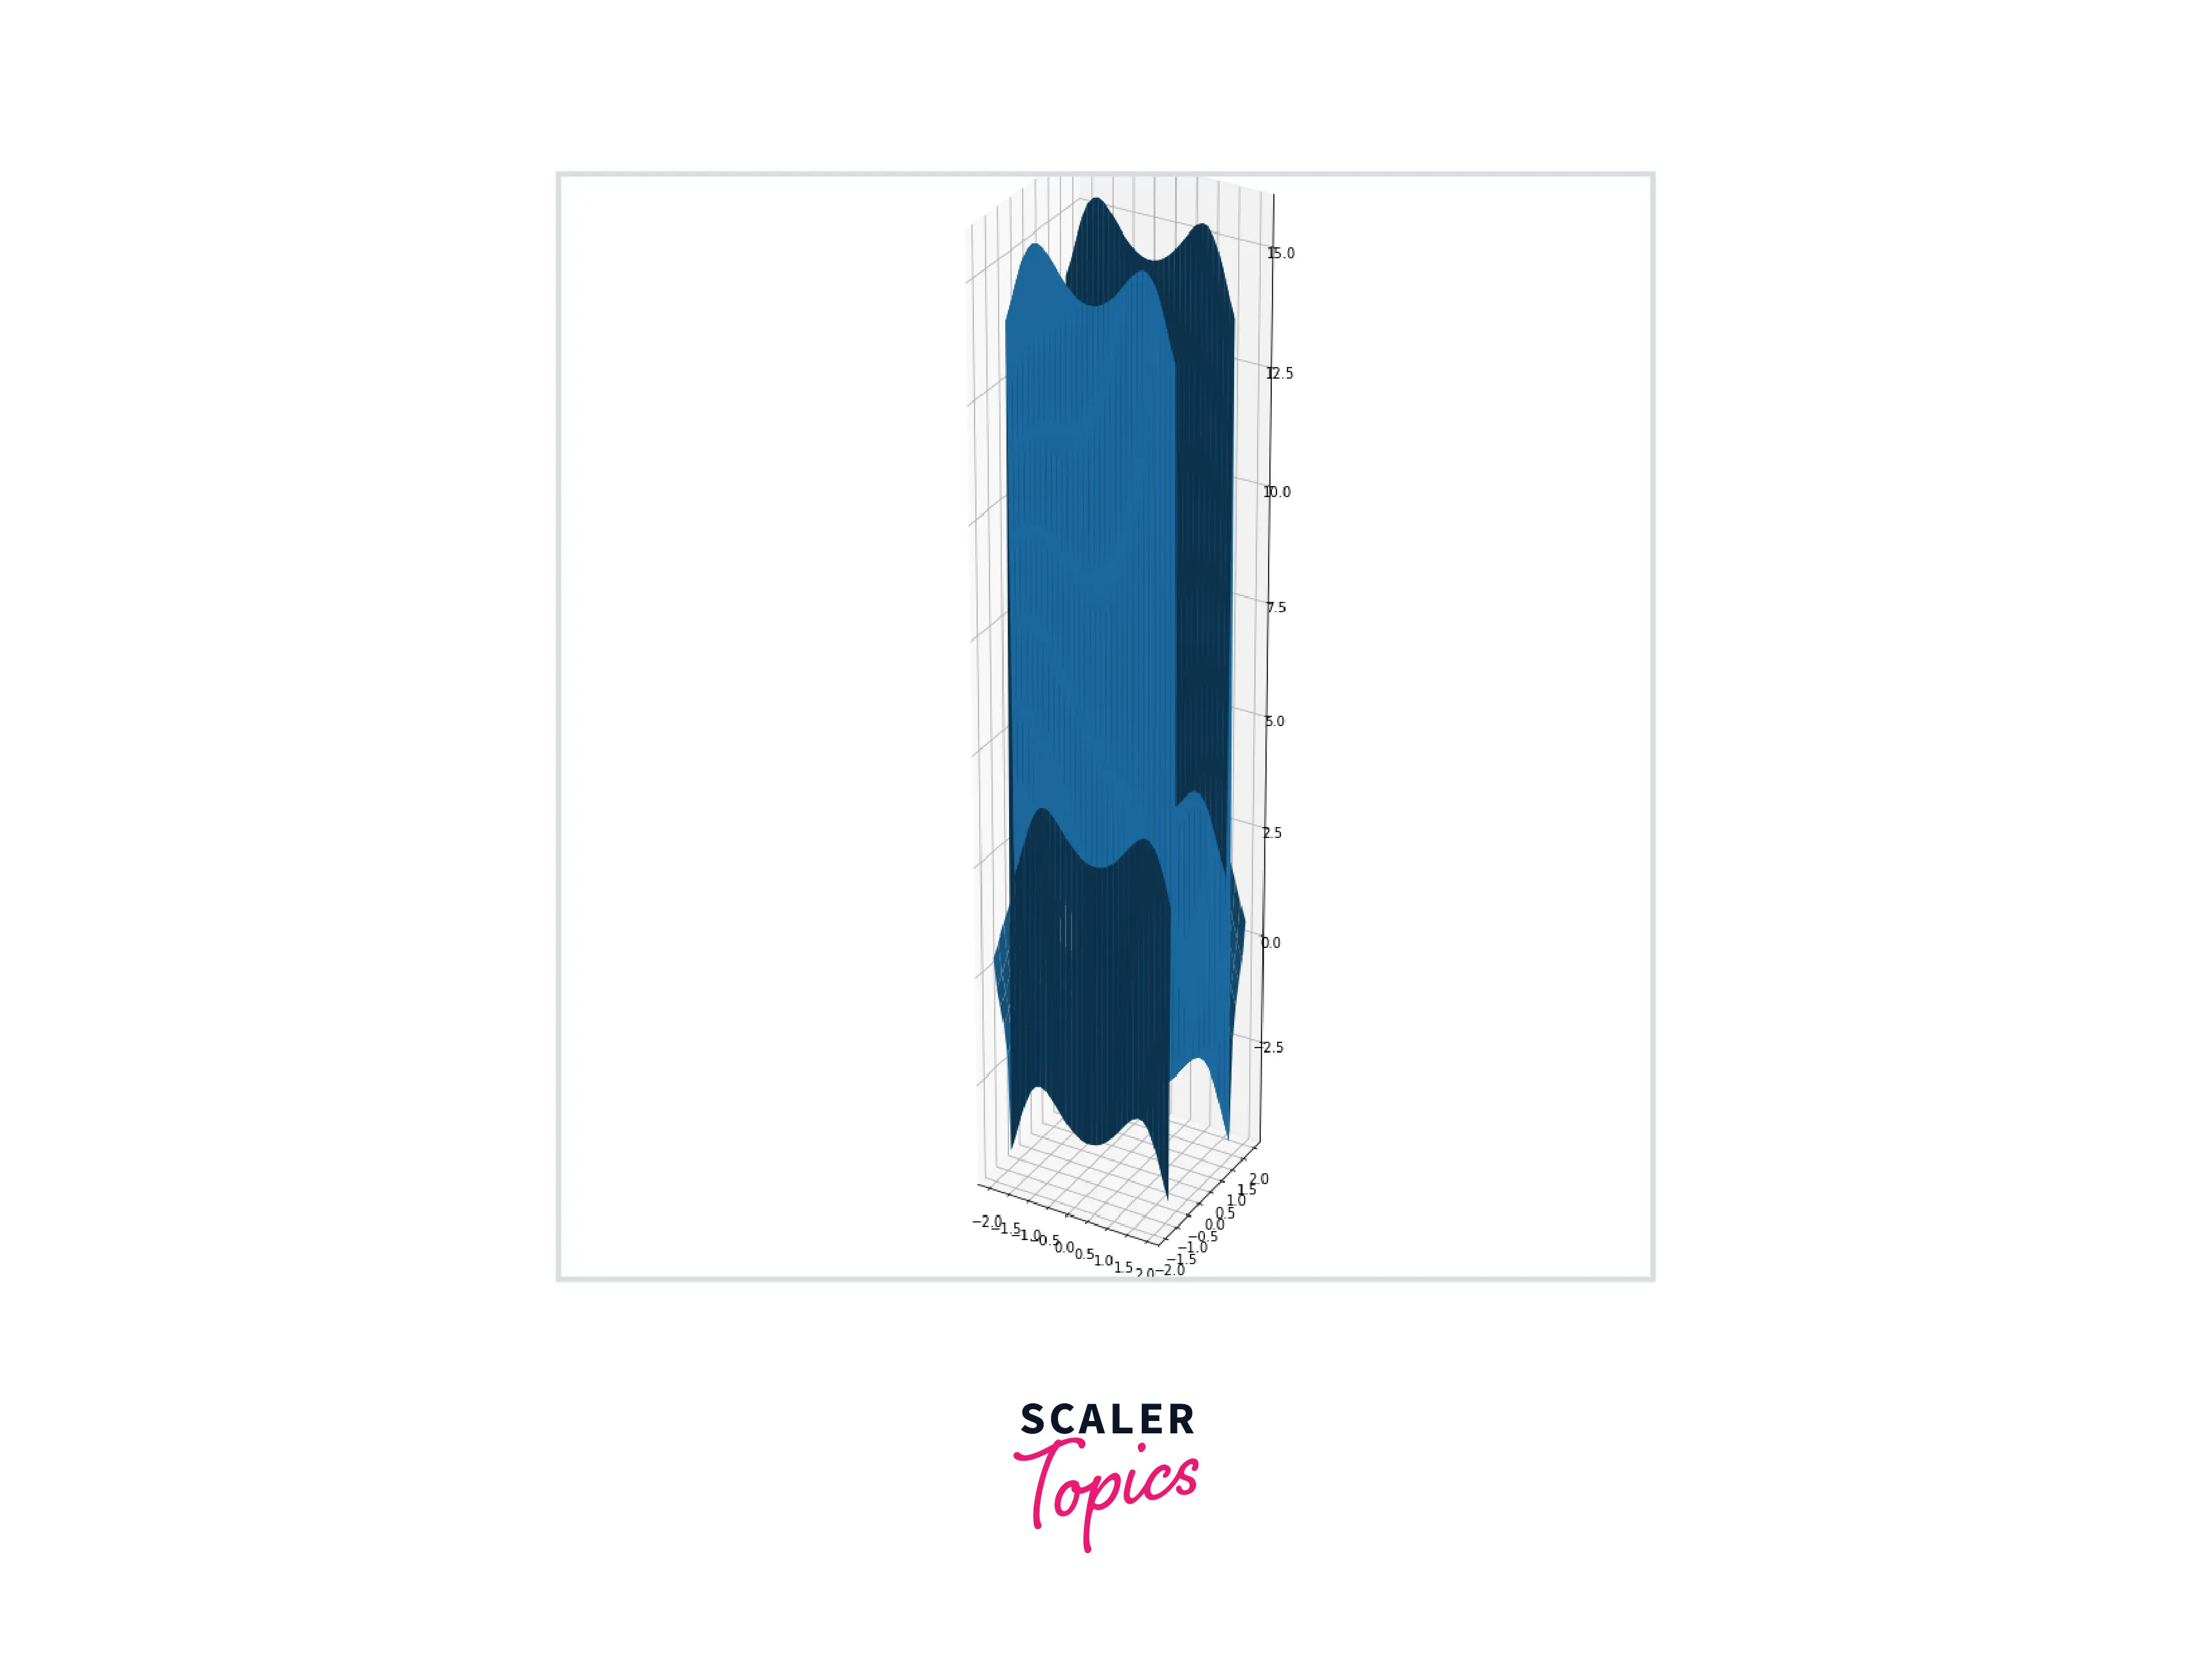
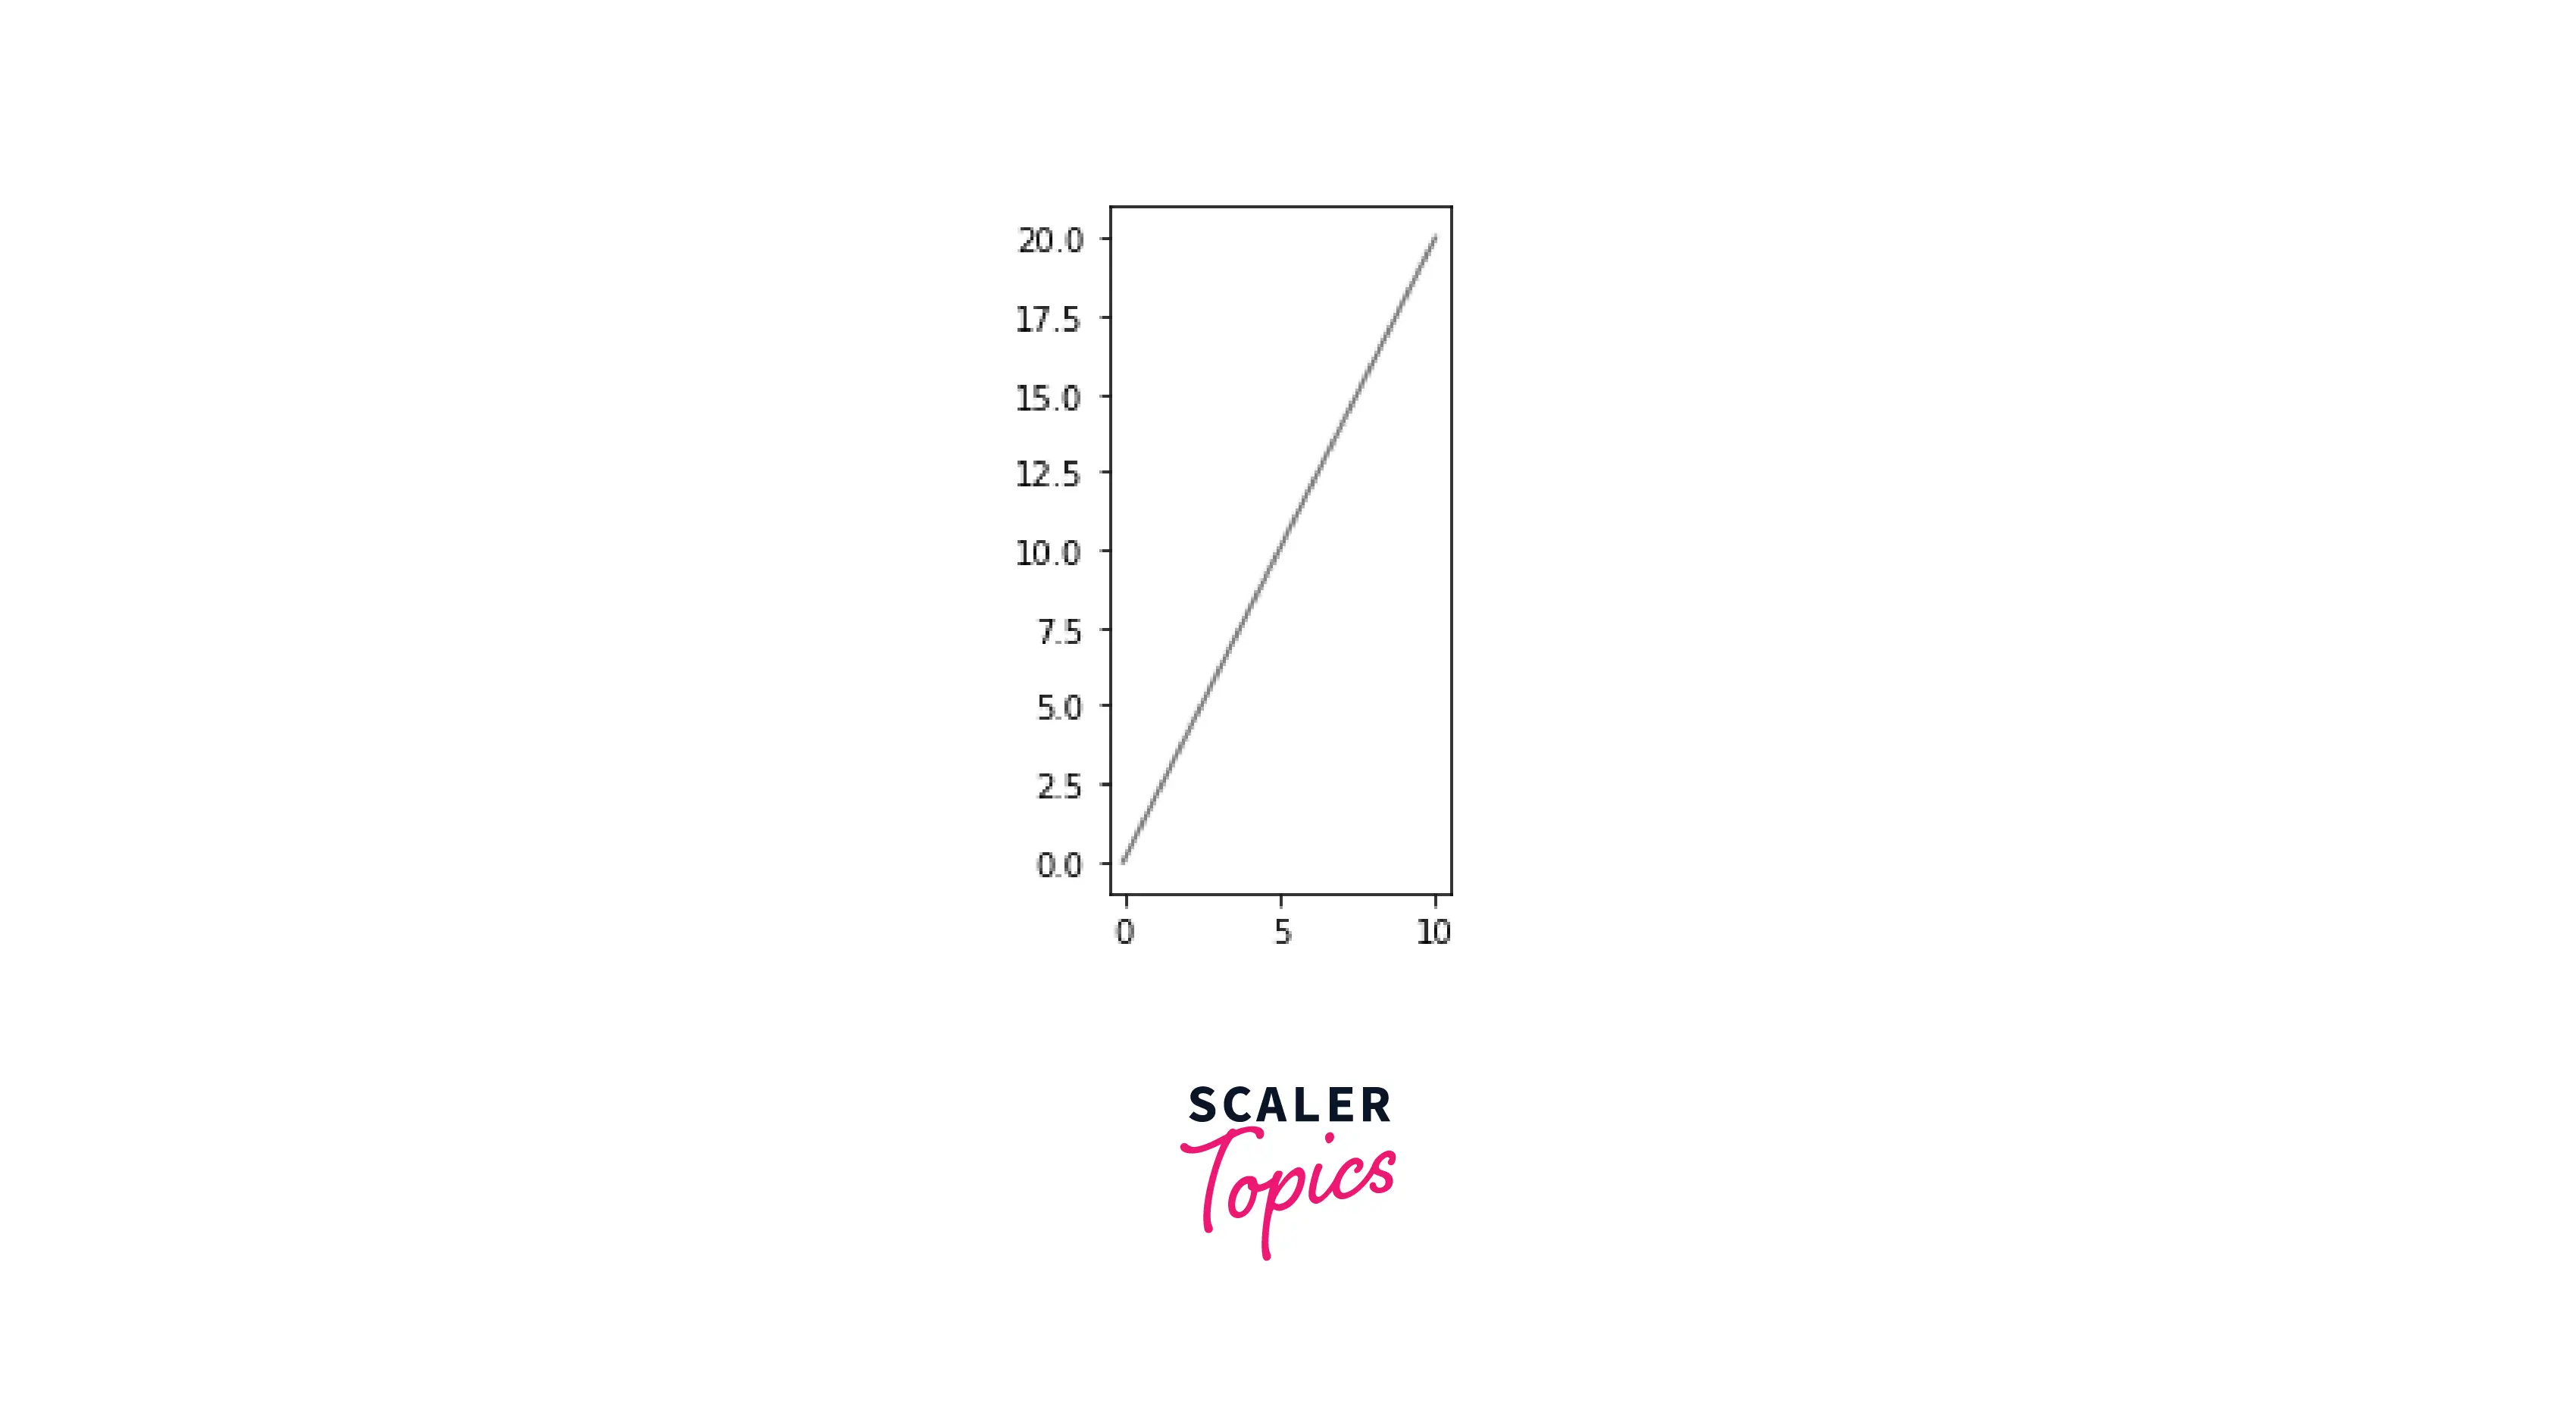
Image Aspect Ratio
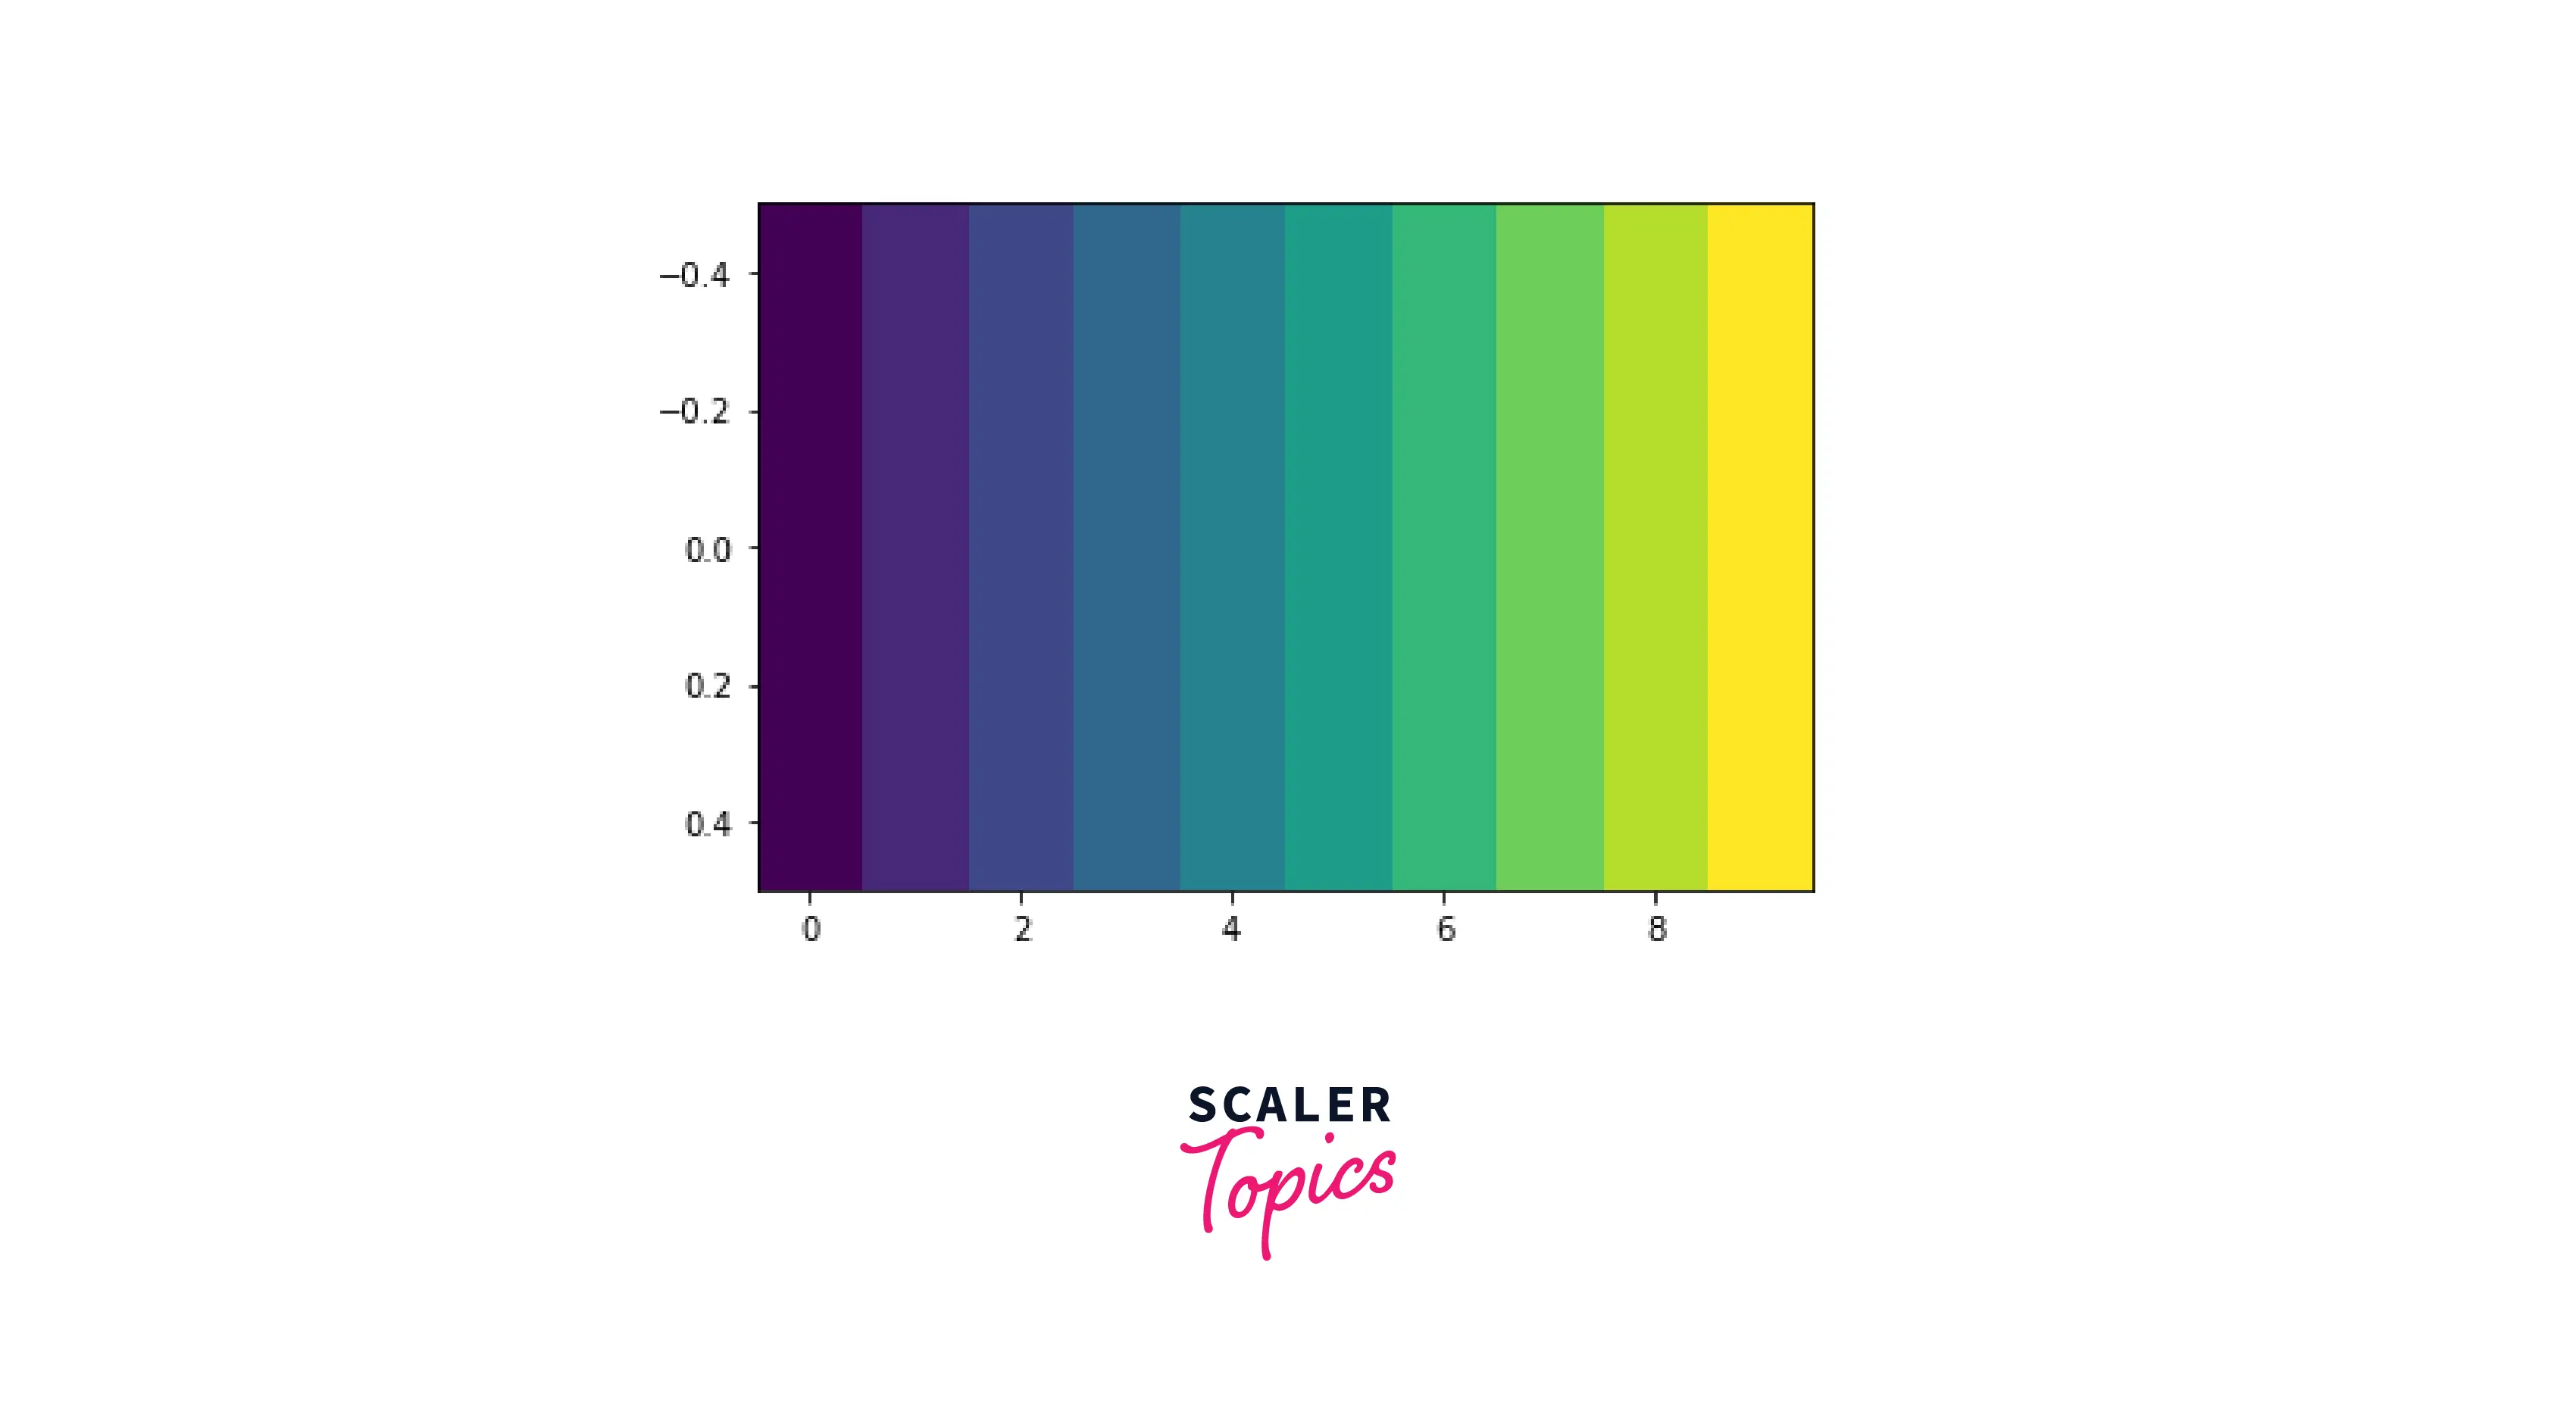
We will create an image using Numpy arrays to demonstrate the image aspect ratio. In Python, an image is a NumPy array of integers.
Explanation
To create an image, we will create a NumPy array. First, we use NumPy's arange() function to create an array. After creating the array, we simply display our image.
To change its matplotlib aspect ratio, we will use the set_aspect() function with the parameter: auto. This will make sure we get even axes in our matplotlib figure.
Output:
Constrain Aspect Ratio
By entering a value for the optional aspect ratio property for our image plot, Matplotlib allows us to change the aspect ratio of our picture. To constrain the matplotlib aspect ratio of our plots, there are six parameters that we can use.
Scaled
This setting equalizes the scaling on both axes. In your plot box, you can now draw a square effectively. In addition, all outlier data points will be scaled appropriately to display them.
Explanation
In this example, we will plot a sine wave using the in-built sine function in the NumPy library. After plotting, we use the "scaled" parameter to ensure our axes are identical.
Output:

Turn Learning into Career Growth
Equal
This parameter in axes helps us to equalize both of the scales. This parameter goes in with the axes of our plots.
Explanation
By changing the parameter of axes to "equal," we can see that equal space is left around the start and at the end of a plot.
Output:
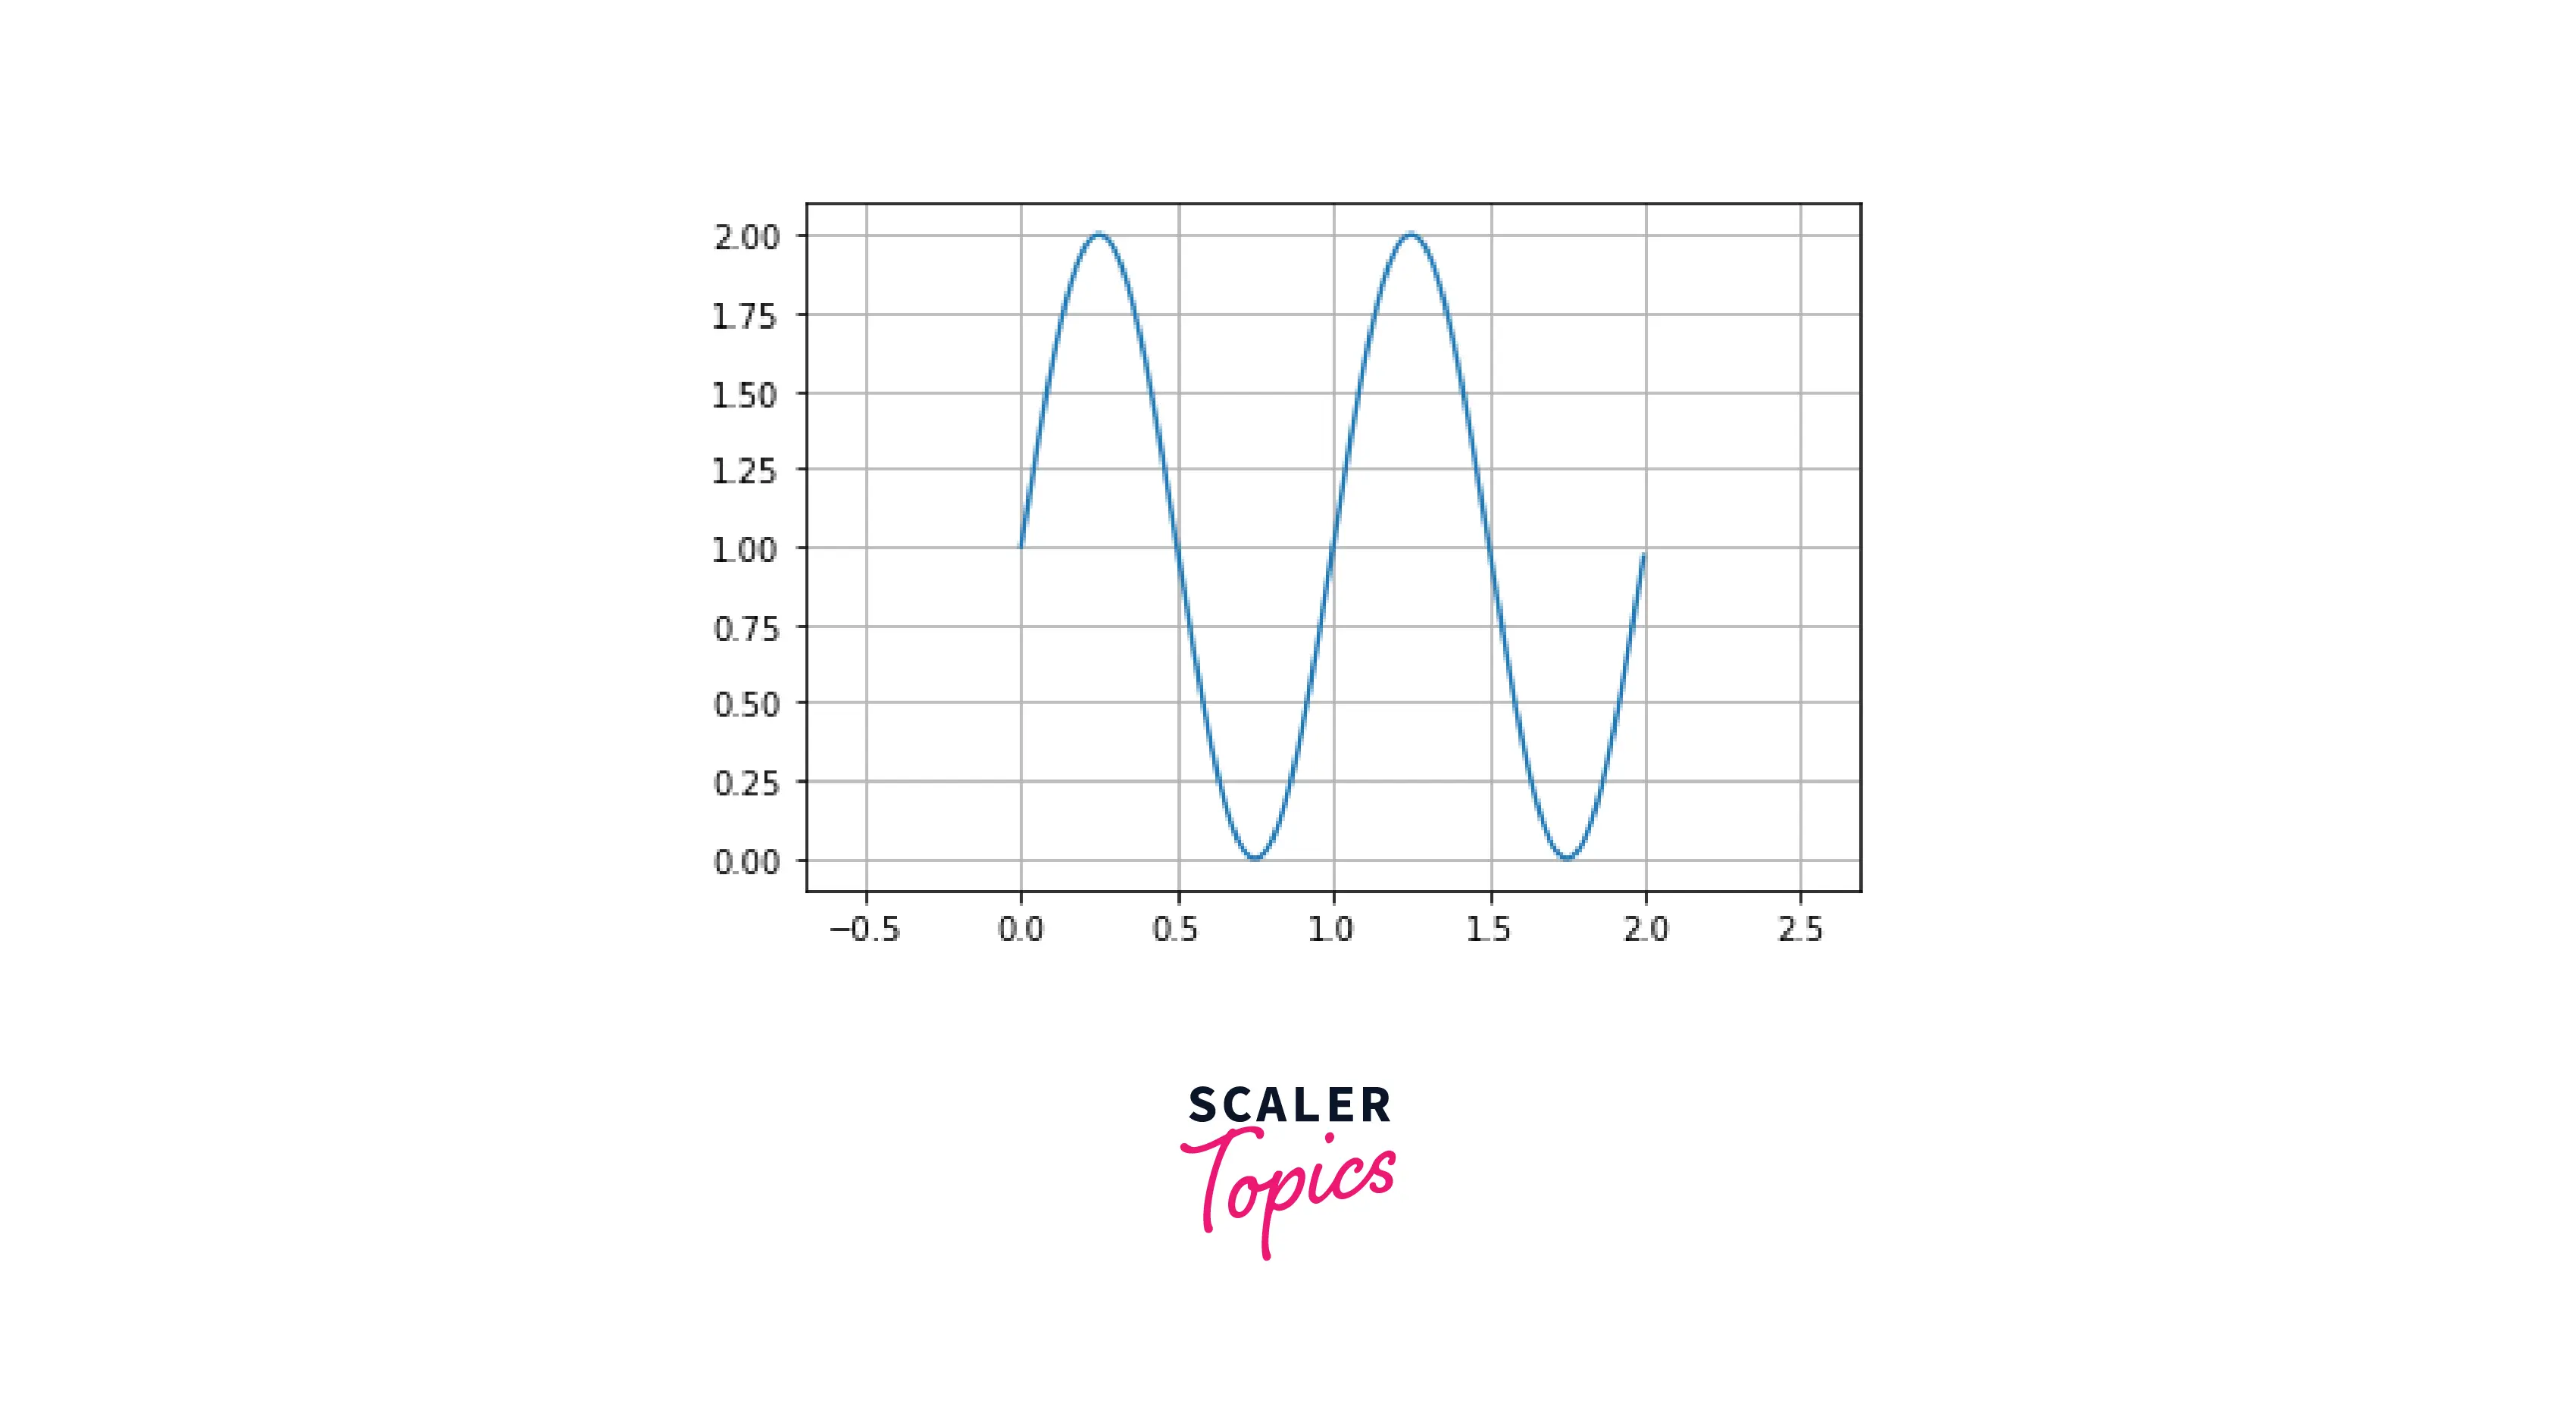
Tight
This parameter sets the limit and disables auto-scaling to allow you to see every point on your graphs. It also handles this case for outliers.
Explanation
As you can see, only a small area is left at the start and end of the plot. This is done because of the "tight" parameter in the axes of our plot.
Output:
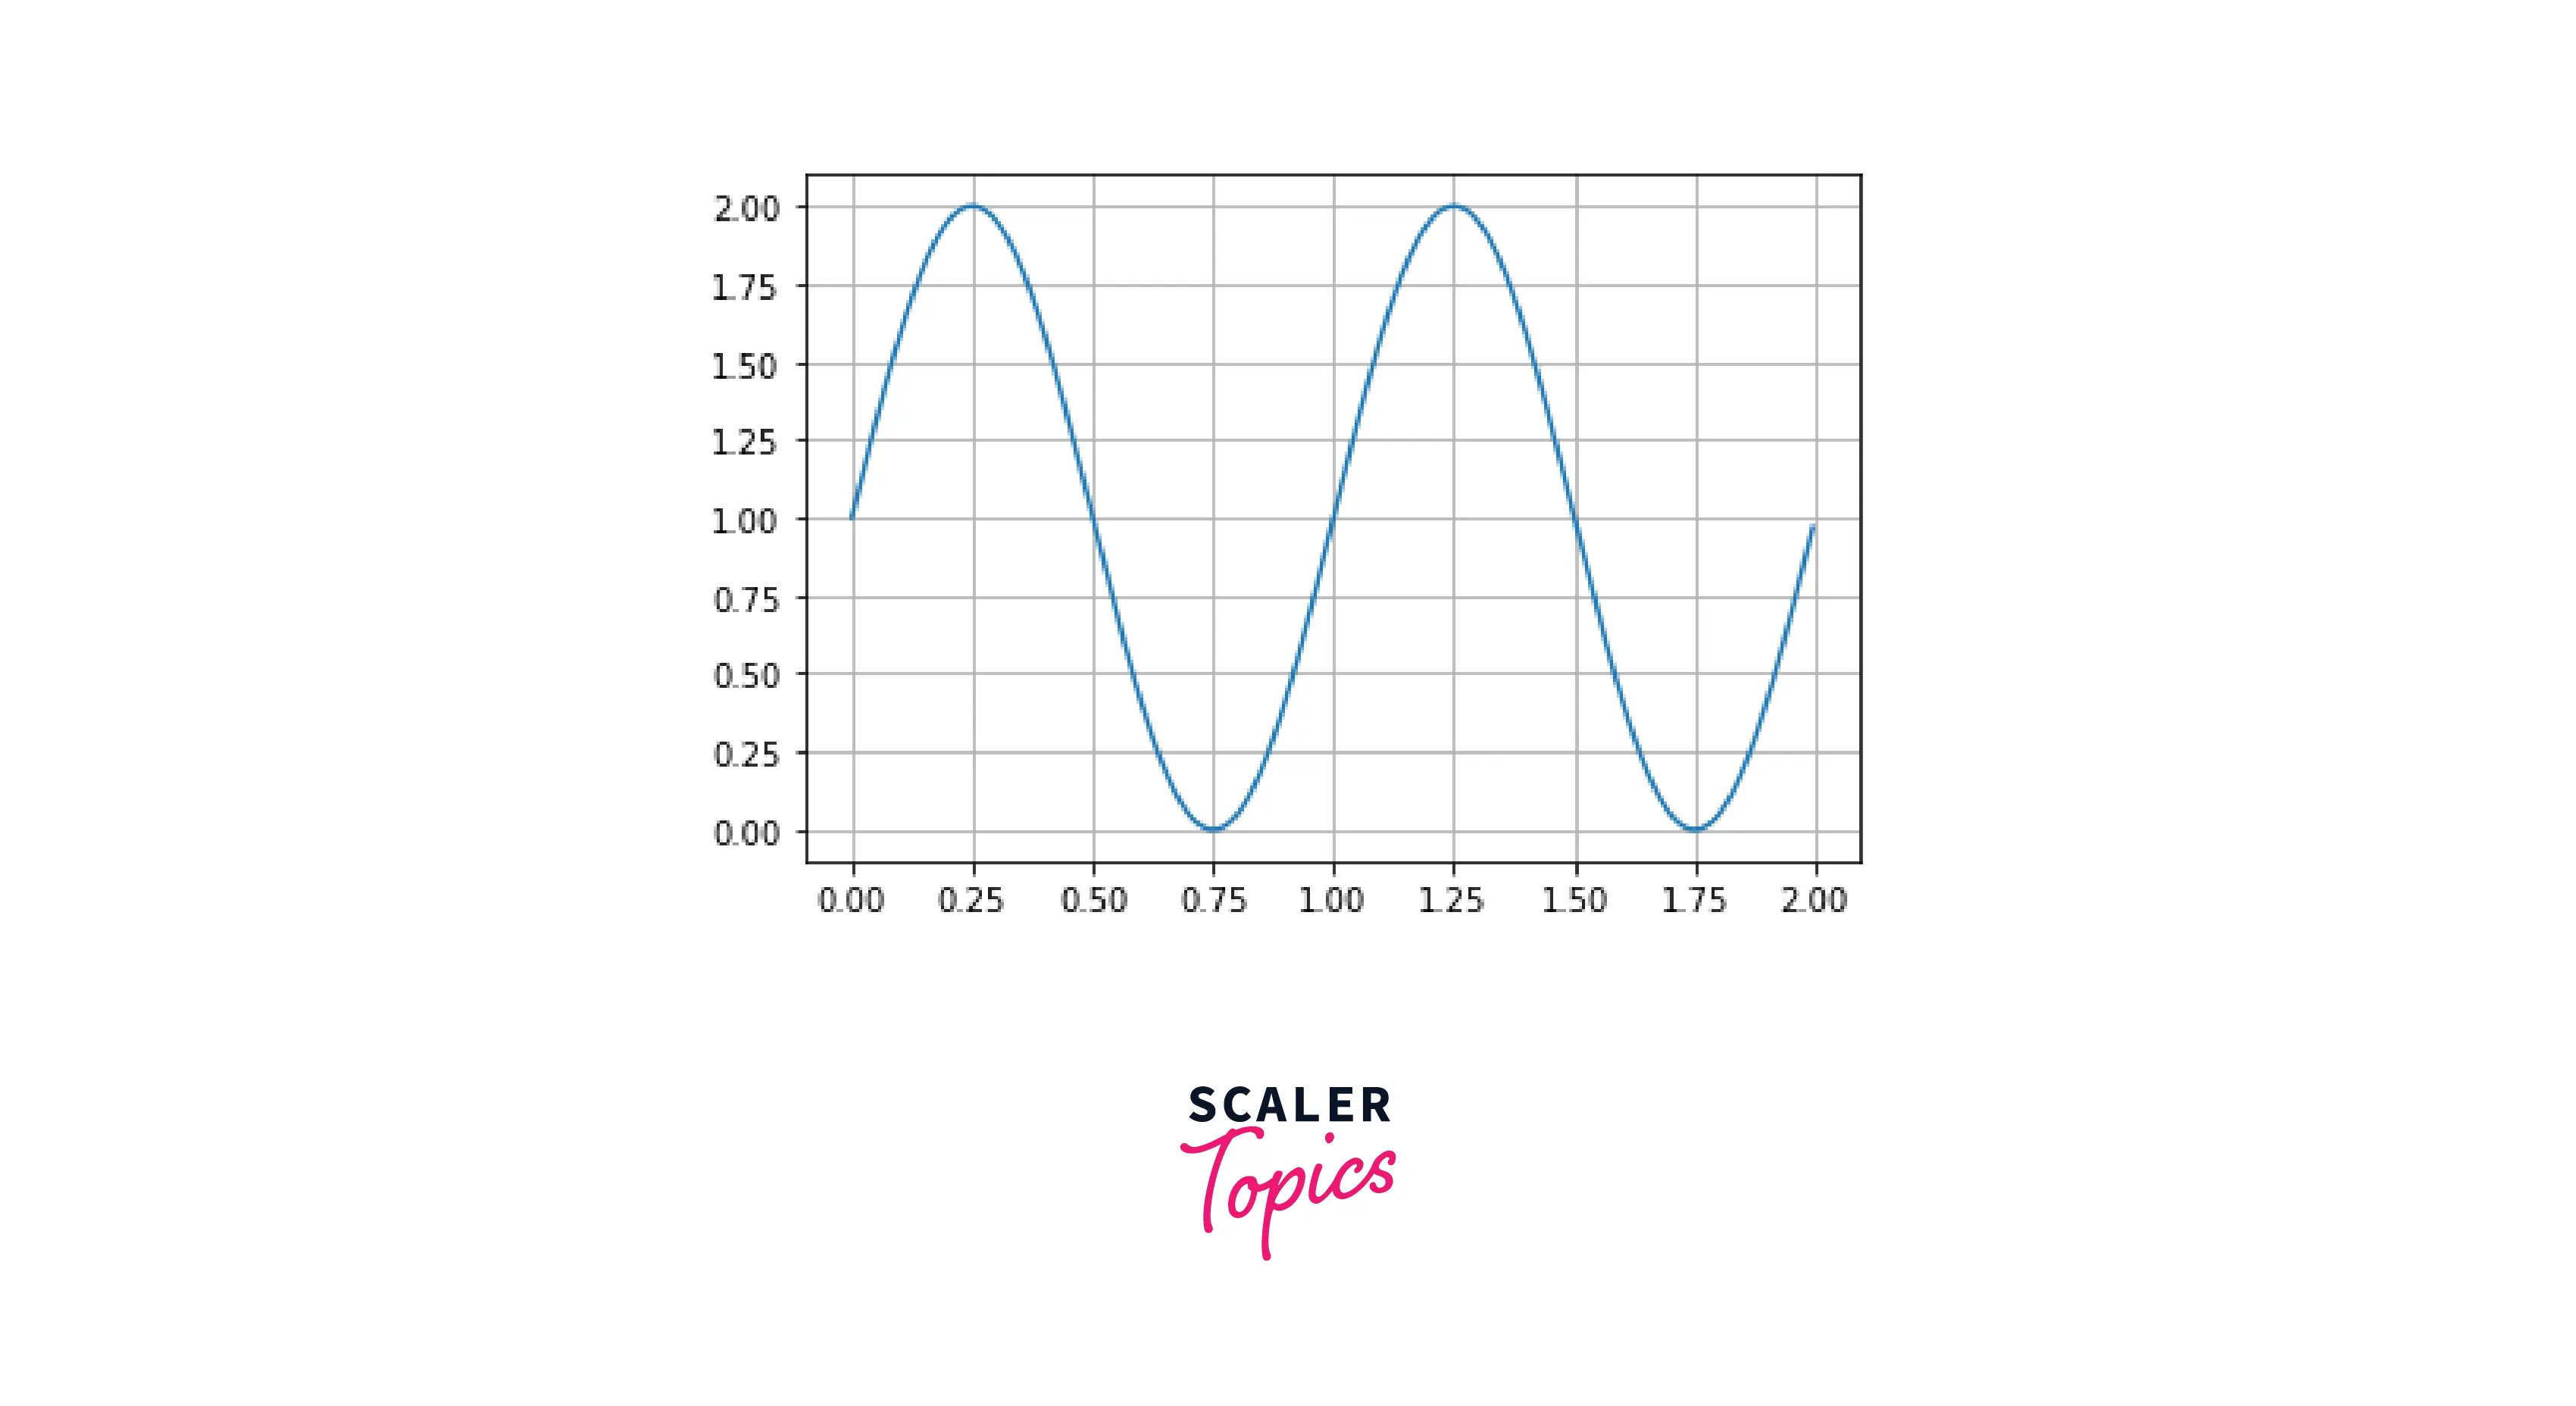
Auto
This parameter allows us to auto-scale the axes. This ensures that even space is left around the x and the y-axis.
Explanation
As you can see, the x and y axes cover an equal area. This is a great utility function, as the programmer doesn't have to worry about the boundaries of the plot.
Output:
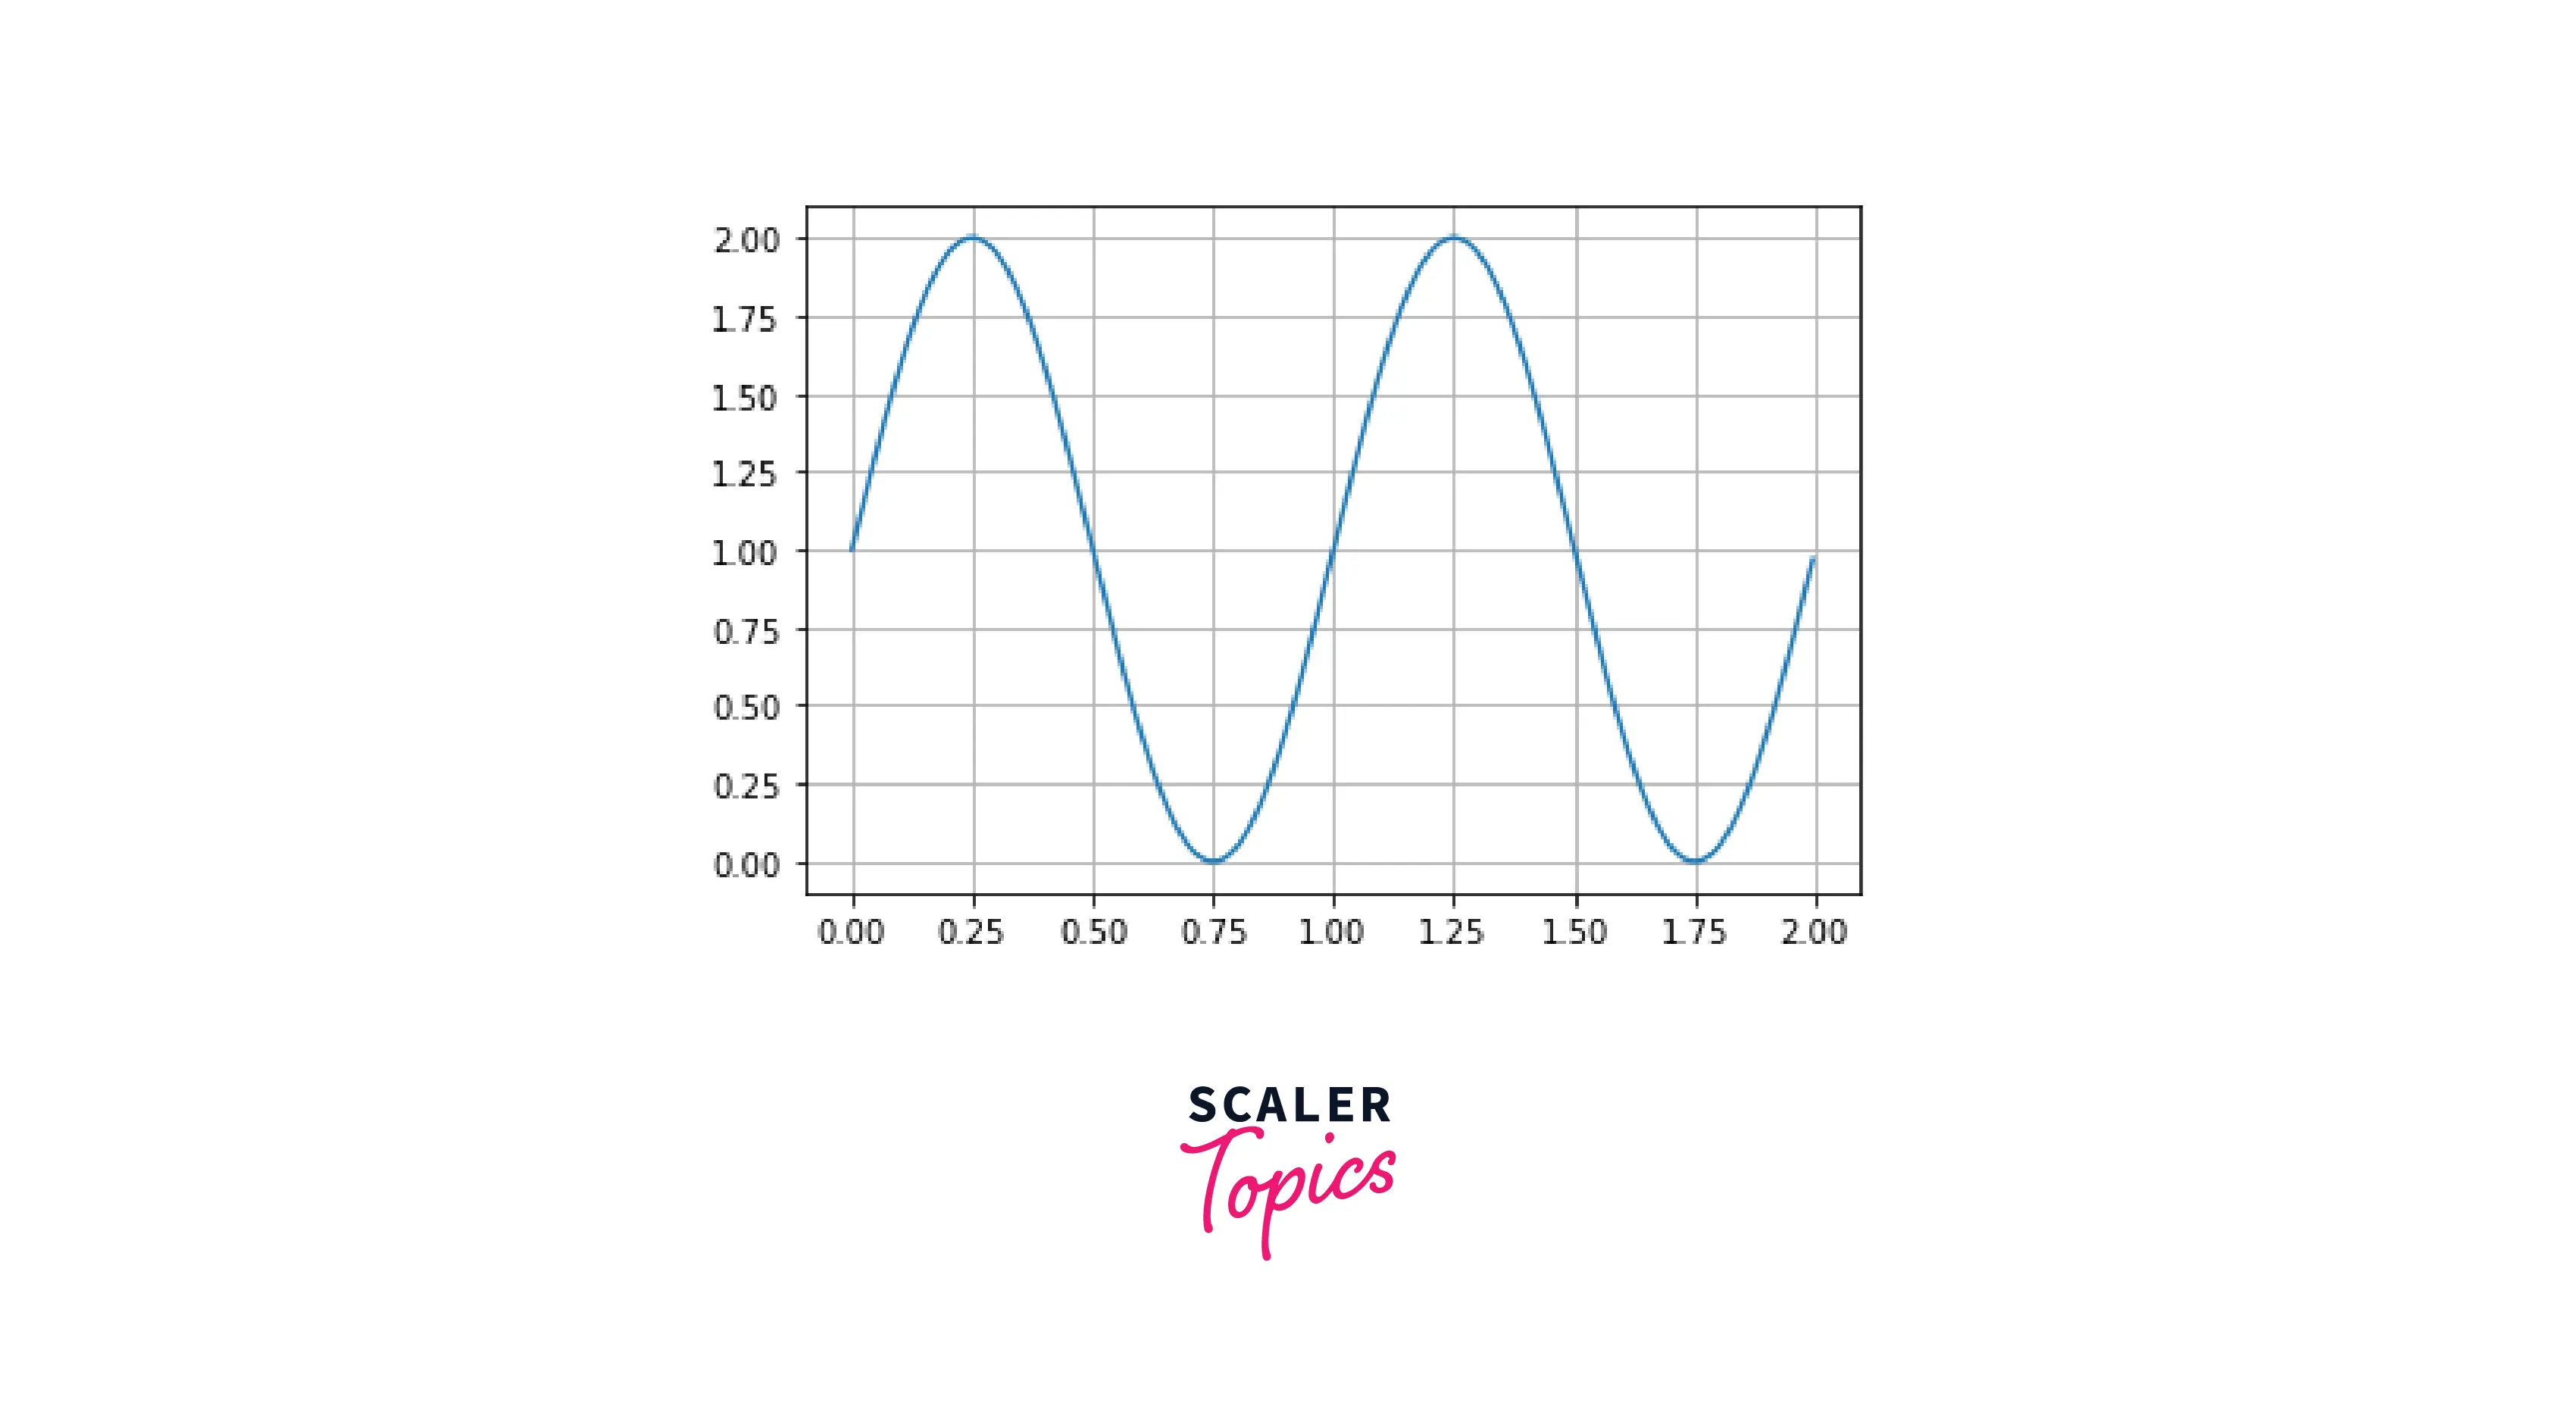
Image
This parameter allows us to scale our axes so that the data limits are equal to our axes' limits. This allows our plots to be as compact as possible.
Explanation
As you can see in the plot, the image parameter has made the plot compact. This is because our scale limits are equal to our data limits.
Output:
Scaler Placement Report and Statistics
Scaler learners achieved 2.5x salary growth with average post-Scaler CTC reaching ₹23L.
Square
This parameter allows us to scale our axes to mimic a square; the axes will be equal from all sides.
Explanation
As you can see in the plot, the image parameter has converted the axes of our plots into a square plot (The x and y axes are equal from every side).
Output:

Examples
Formula Method
Another method of setting the matplotlib aspect ratio is using the absolute difference of the axes, multiplied by our arbitrary ratio.
Output:
Setting Aspect-Ratio for 3-D plots
We can do the same for three-dimensional plots as we set the aspect ratio for two-dimensional plots. In the example below, we will create our three-dimensional plot using the .gca() function, and then we'll set the aspect ratio to be tight.
Output:
Conclusion
- In this article, we covered aspect ratio, the ratio between a plot's width and height, and various methods by which we can alter it.
- With the help of an example, we understood the difference between a normal plot and a plot with a set matplotlib aspect ratio.
- We understood the three parameters in set_aspect(); Aspect, Adjustable and Anchor, their function and applications.
- Apart from this, we understood certain cases to set aspect ratios like Square and Image.
- To constrain aspect ratio in our plots, we went through an in-depth explanation of 6 features; Scaled, Equal, Tight, Auto, Image, and Square.