How to Scale Both Axes Equally?
Overview
In mathematics, axes are generally referenced lines which are drawn on a graph. This reference line can be used to find values of different methods like gradient, etc.
Equalizing the scale of both our axis (X and Y axis) is fairly important in matplotlib, as it helps us to achieve linearity and continuity in our plots.
In this article, we will cover various ways of scaling matplotlib axes in an equal sense.
Transform Your Career
Choose from our industry-leading programs designed for career success
Modern Software and AI Engineering Program
Master full-stack development with AI integration

Modern Data Science and ML with specialisation in AI
Advanced data science techniques with AI specialization
Advanced AIML with Specialisation in Agentic AI
Deep dive into AIML with focus on Agentic systems
DevOps, Cloud & AI Platform Engineering
Build and manage AI-powered cloud infrastructure
AI Engineering Advanced Certification by IIT-Roorkee
Premier AI engineering certification from IIT-Roorkee
Introduction
Matplotlib is one of the most well-known Python tools for data visualization. The fact that practically any item in Matplotlib's hierarchy of objects can be modified greatly adds to its appeal.
In this article, we will go over various ways in which we can scale our matplotlib axes equally, so that we may have precise and equal plots.
How to Scale both Axes Equally in Matplotlib
The axes in Matplotlib frequently have various scales when the axes' bounds are set. By default, a figure's two axes in Matplotlib will each use a separate scale. Hence, these axes must be equalized for each to have the same scale.
Well, we've got you covered:
To achieve equal scaling of matplotlib axes, we need to use the pyplot library of matplotlib. With the help of pyplot and Axes object, we'll be able to scale both of our matplotlib axes equally.
Explanation
In this example, we plot an ellipse using the inbuilt sine function in the NumPy library. After creating the ellipse, we use the .set_aspect() function to set our scales as equal. You can learn more about setting aspect ratio of plots here.
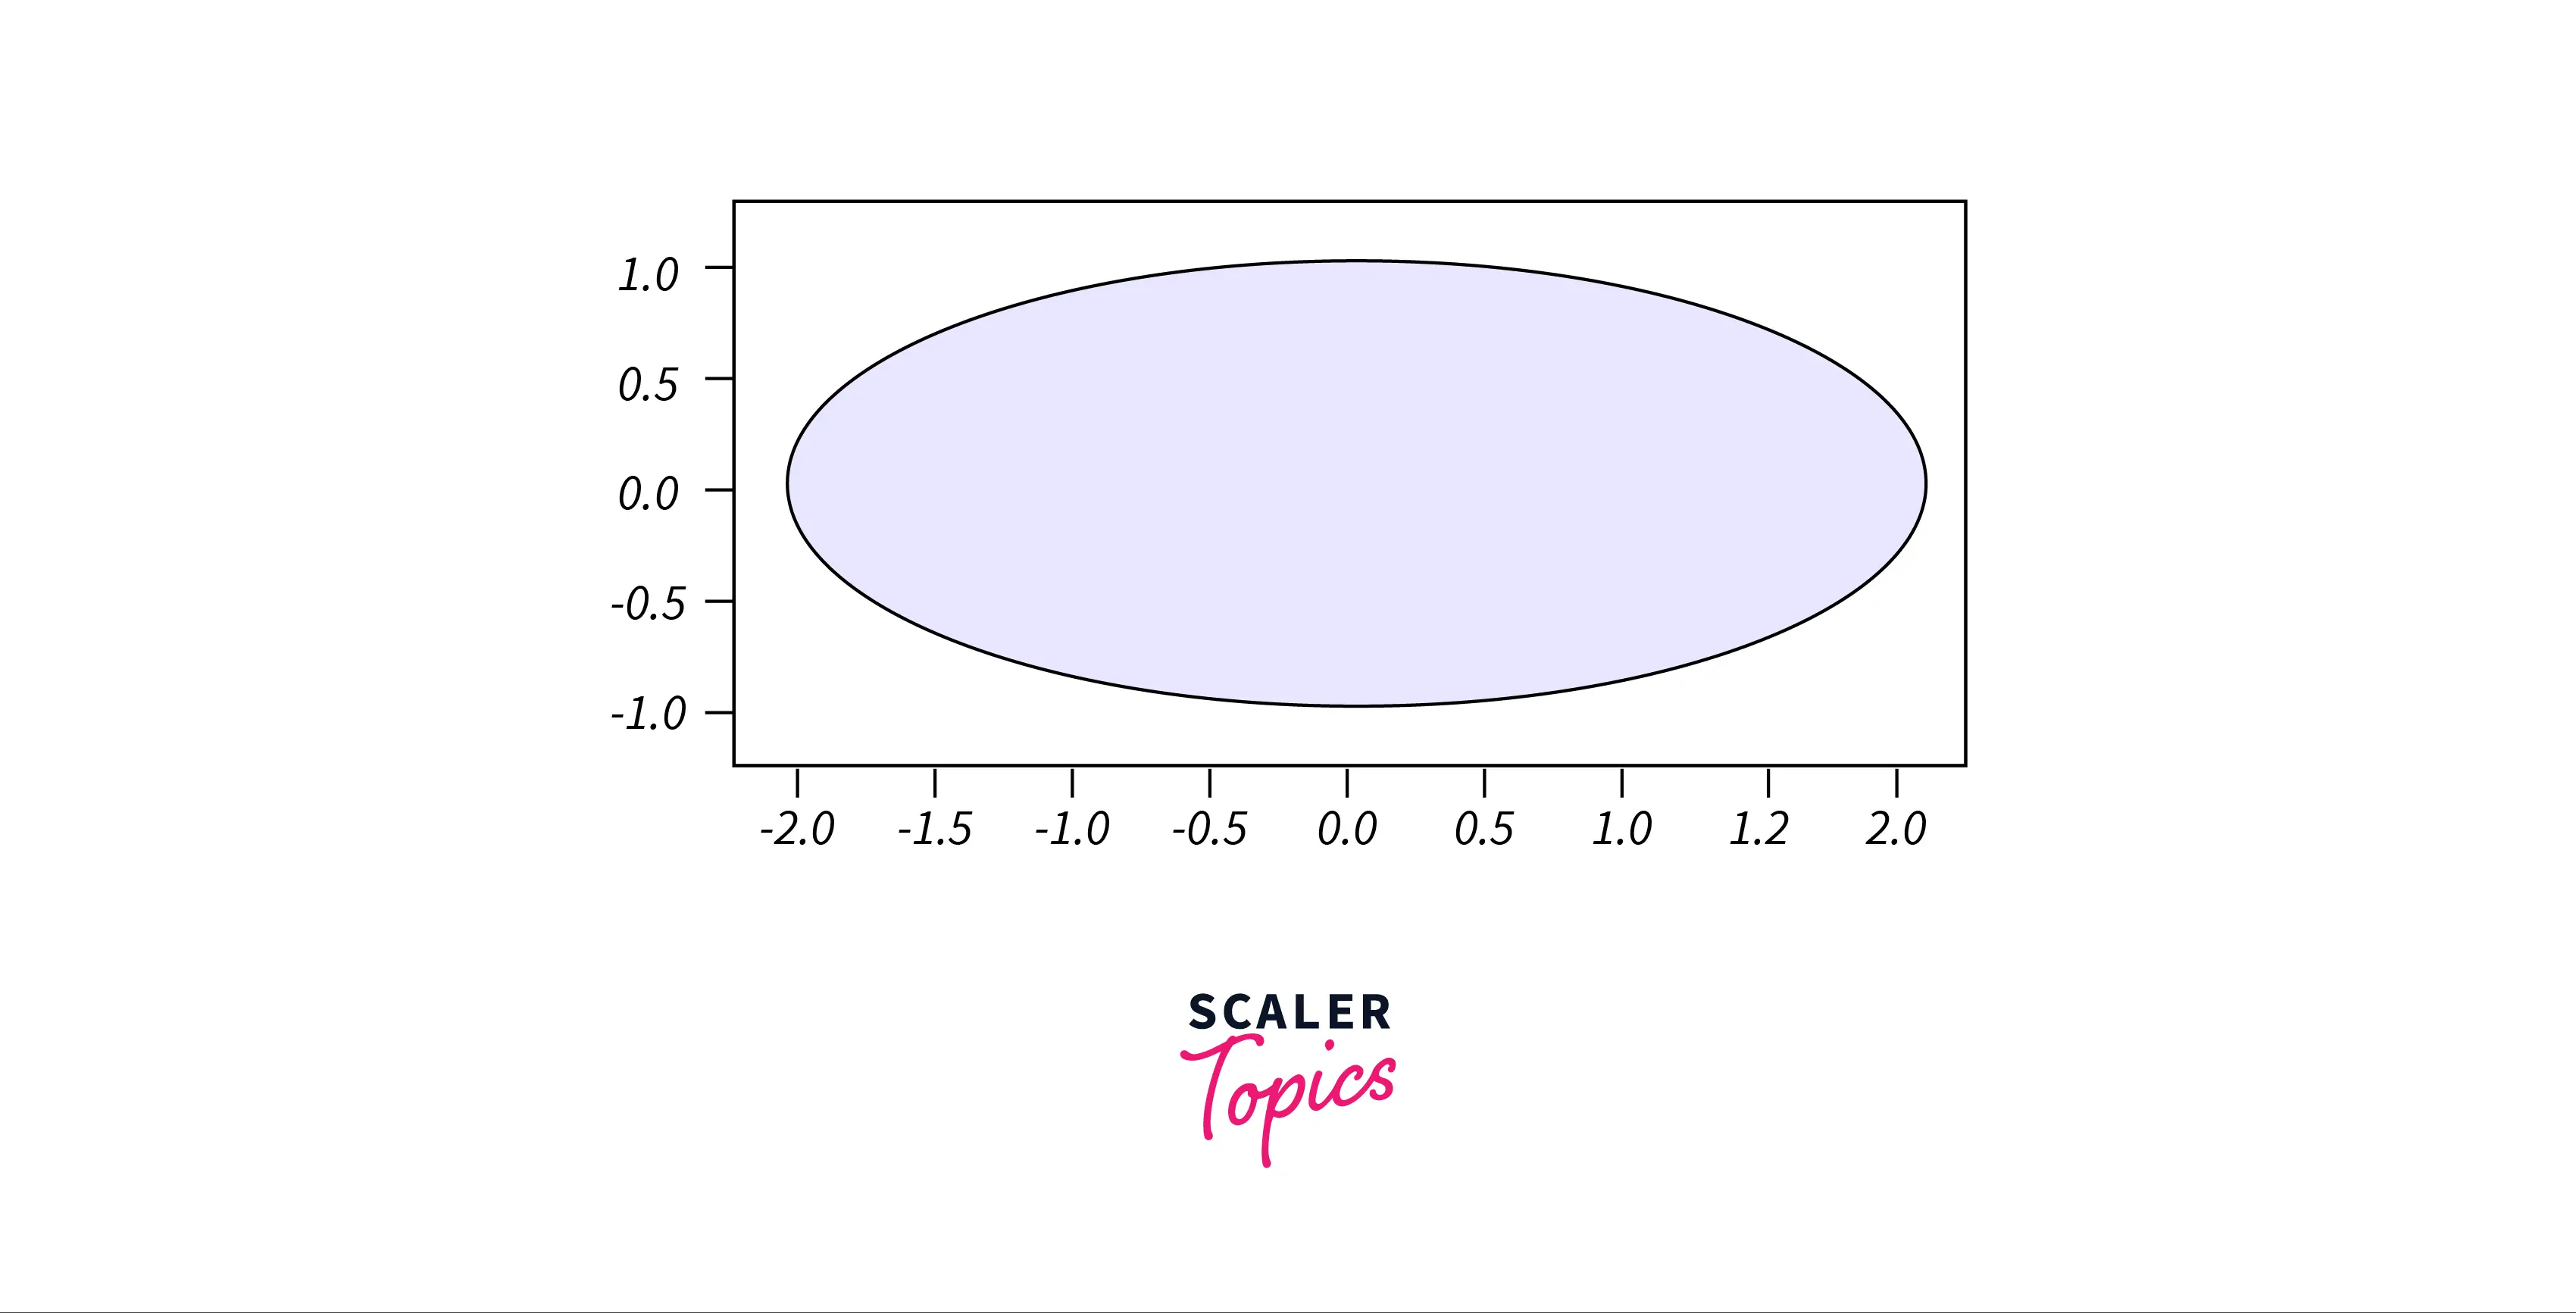
In the example below, we'll see the ellipse without equal scaling, and after setting the matplotlib scales equal.
Output
How do Scaling Axes Equally Work?
To understand this, let's take the ellipse as an example:
As you can see in this example, the y-axis is set with a constant difference of 0.25 units. Whereas, the x-axis is set with a constant difference of 0.5 units.
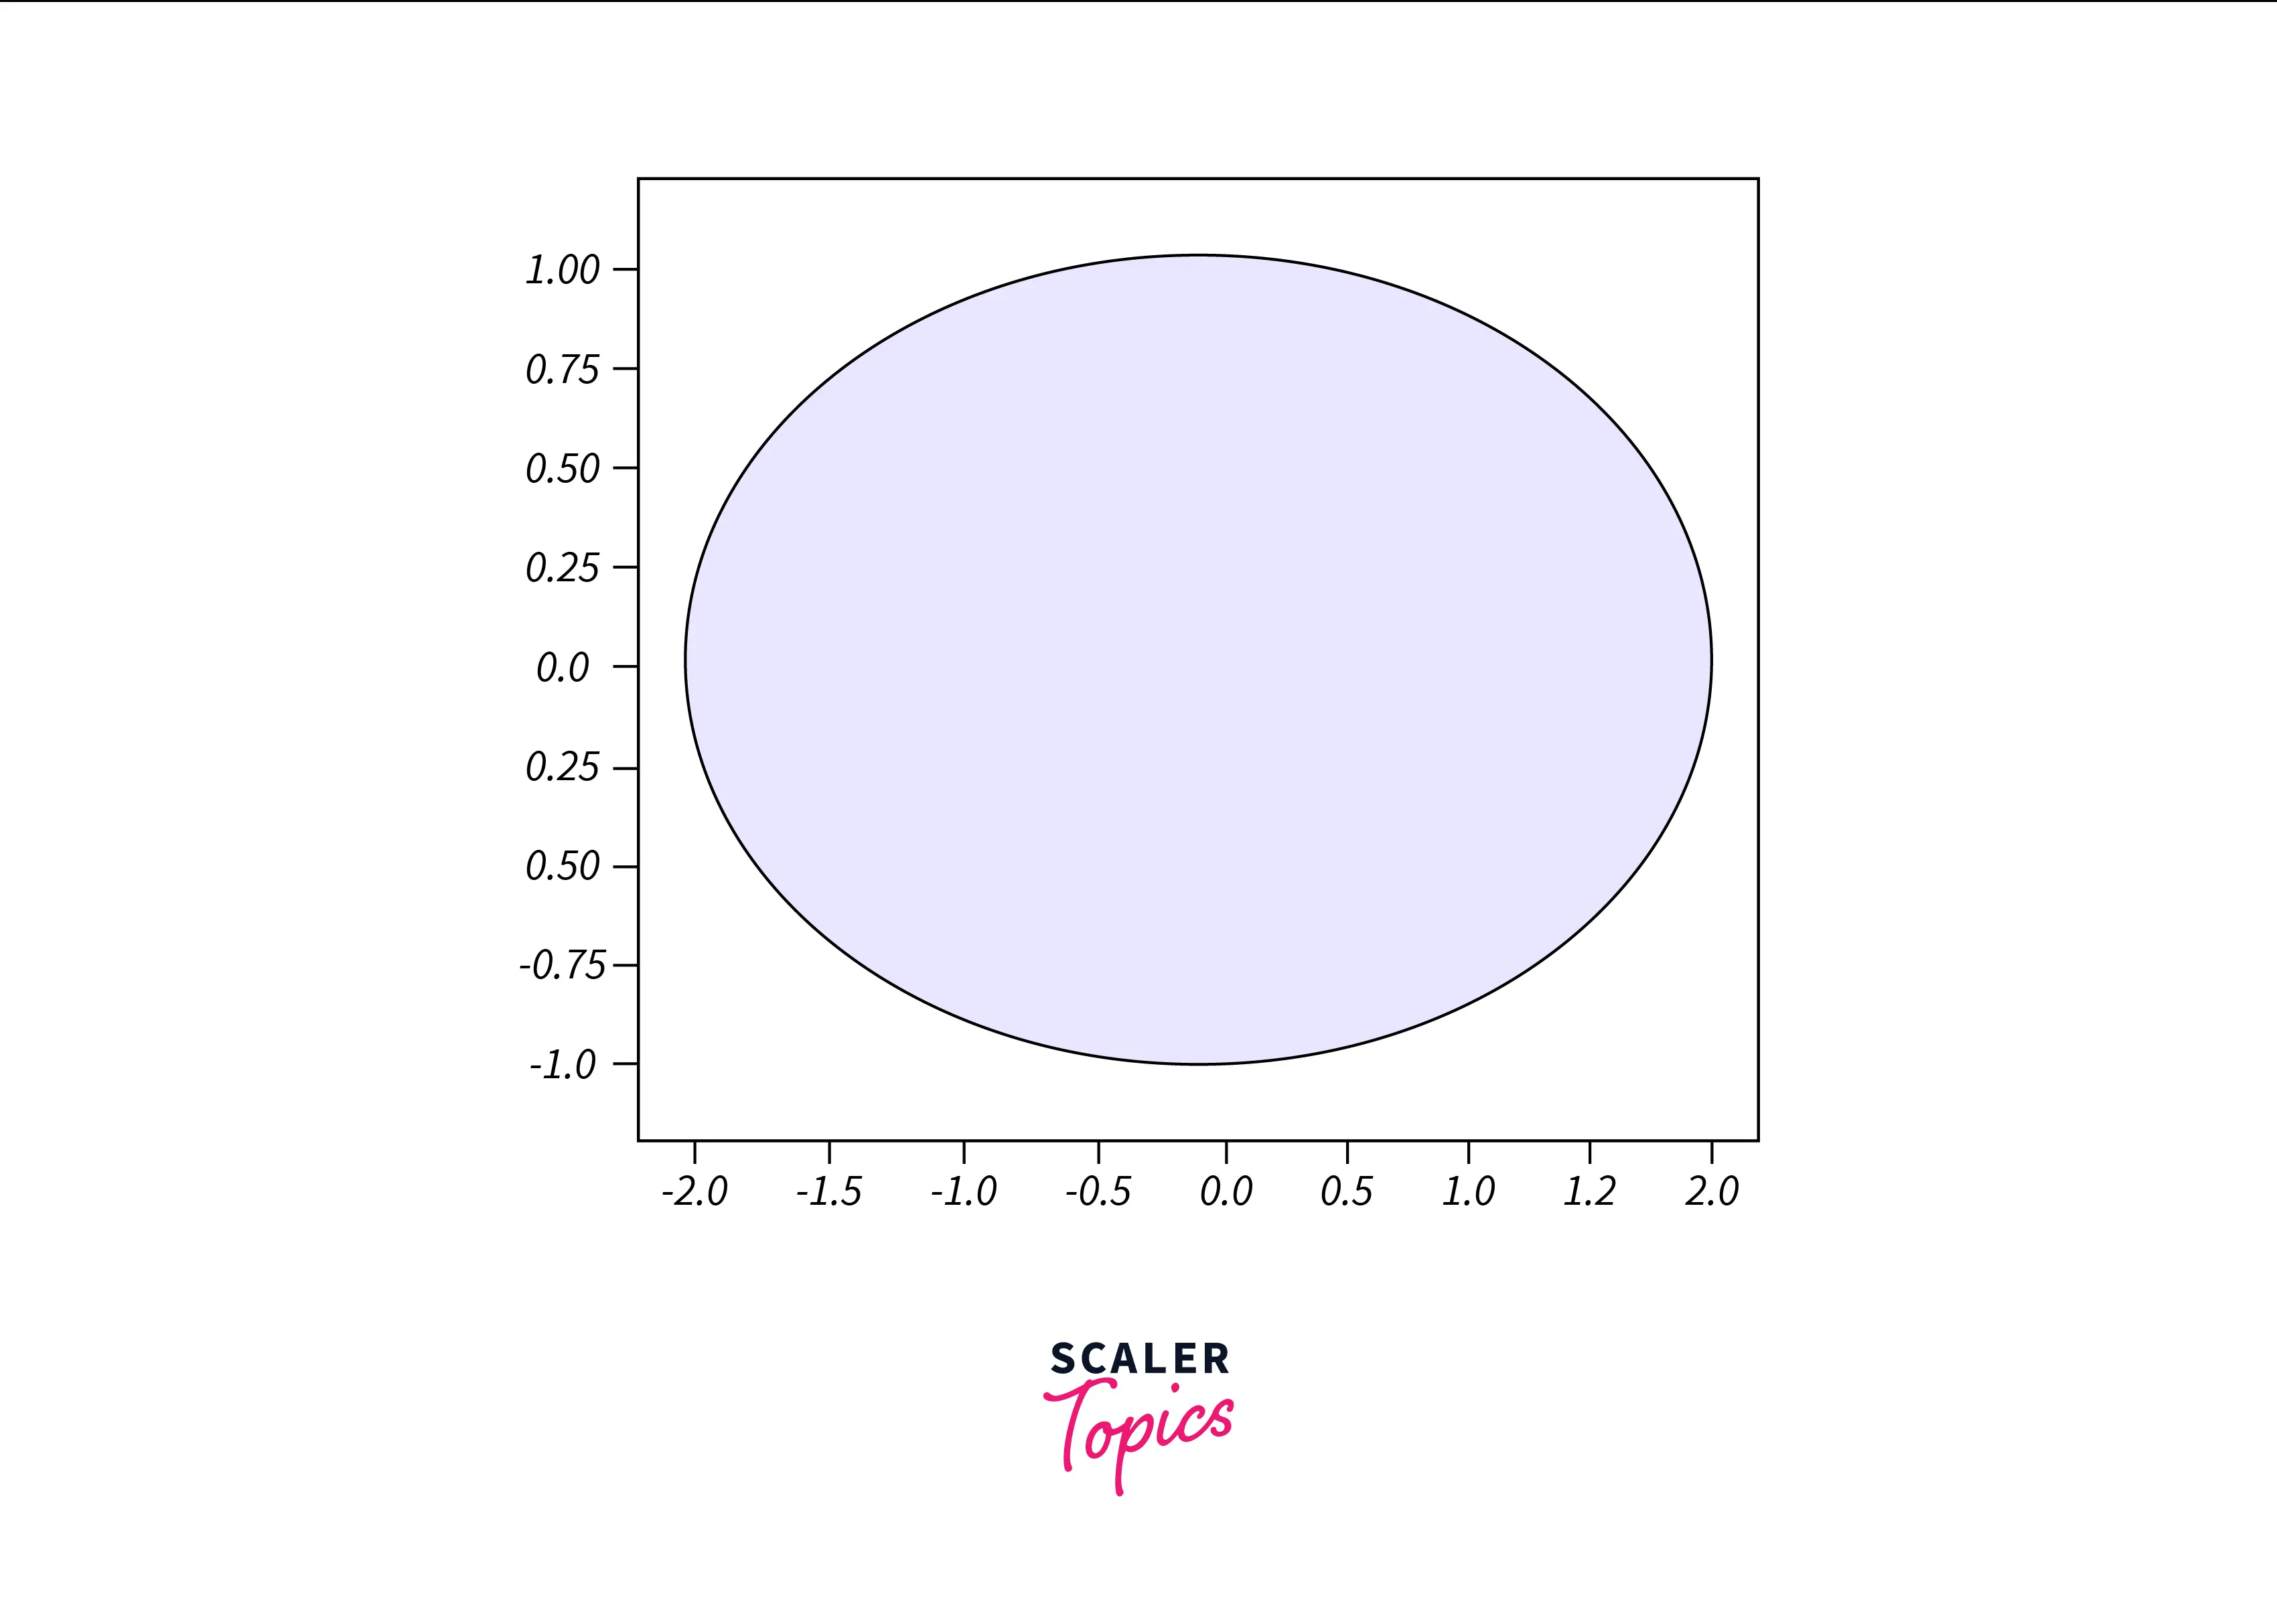
The Axes object, which controls the matplotlib axes, is returned by the axes() function. We set the set aspect() method of the Axes instance to equal. Now, the scale is the same for both axes. If the aspect was not set the same, the figure would seem different.
Here's the plot after setting its scales to equal:

Conclusion
- In this article, we understood the reason behind scaling matplotlib axes equally; It aids us in creating plots with linearity and continuity.
- Apart from this, we saw how to set the scales to be equal using the set_aspect() function in matplotlib.
- With the help of an ellipse, we understood the difference between a default-scaled plot and an equally-scaled plot.