Matplotlib | Control the Output Resolution
Overview
Matplotlib is a powerful library for plotting data. It provides modules and functions to control the output resolution of the plot. We can either change the figure's DPI or the format of the rendered image to SVG or PDF to enhance the resolution of the images. We will discuss all the methods of changing the image's resolution and give some examples.
Introduction
In matplotlib, the plot's resolution is low, which makes the plot blurry or grainy. That's why it provides the functionality to adjust the image resolution. There are two ways to increase the resolution of the image. First, we can set the DPI of the figure, or we can change the image format to vector.
Importance of High-Resolution Image
Matplotlib is a powerful python-based plotting module, but the default resolution of the rendered plot images is pretty low, which leaves the plots looking blurry. This may cause trouble if we export the plots to another format. Matplotlib also provides the function to adjust the plot's resolution, which makes exporting the data easier.
Transform Your Career
Choose from our industry-leading programs designed for career success
Modern Software and AI Engineering Program
Master full-stack development with AI integration

Modern Data Science and ML with specialisation in AI
Advanced data science techniques with AI specialization
Advanced AIML with Specialisation in Agentic AI
Deep dive into AIML with focus on Agentic systems
DevOps, Cloud & AI Platform Engineering
Build and manage AI-powered cloud infrastructure
AI Engineering Advanced Certification by IIT-Roorkee
Premier AI engineering certification from IIT-Roorkee
How to Control Output Resolution in Matplotlib
What is DPI?
DPI stands for dots per inch and is a measure of the resolution of an image. It represents the number of pixels per inch in the image. Higher the density of dots, the higher the resolution of the image.
Scaler Placement Report and Statistics
Scaler learners achieved 2.5x salary growth with average post-Scaler CTC reaching ₹23L.
matplotlib.pyplot.figure() in Python
Syntax
Parameters
| Parameters | Datatype and default values | Description |
|---|---|---|
| num | int or str | It is the unique ID of a figure. It is an optional parameter, upon calling, creates a new figure. Still, if a figure already exists with a given identifier, then that figure is made active by passing the identifier as a parameter in the function. |
| figsize | (float,float), default: (6.4,4.8) | dimension of the figure in inches |
| dpi | float, default: rcParams["figure.dpi"] (default: 100.0) | resolution of the figure in dot per inch. |
| face color | color, default: rcParams["figure.edgecolor"] (default: 'white') | background color |
| edge color | color, default: rcParams["figure.edgecolor"] (default: 'white') | border color |
| frameon | bool, default: True | suppress drawing the figure from if false. |
| clear | bool, default: False | It is used to clear the existing figure like a duster on a blackboard |
| FigureClass | subclass of Figure | optionally use a custom Figure instance. |
| tight_layout | bool or dict, default: rcParams["figure.autolayout"] (default: False) | If False use subplotpars. If True adjust subplot parameters using tight_layout with default padding. When providing a dict containing the keys pad, w_pad, h_pad, and rect, the default tight_layout paddings will be overridden. |
| constrained_layout | bool, default: rcParams["figure.constrained_layout.use"] (default: False) | If True use constrained layout to adjust the positioning of plot elements. Like tight_layout, but designed to be more flexible. See the Constrained Layout Guide for examples. (Note: Does not work with add_subplot or subplot2grid.) |
| kwargs | N/A | optional parameter |
matplotlib.figure.Figure.dpi() in Python
Syntax
Parameter
| Parameters | Description |
|---|---|
| dpi | We can set the DPI of the figure by setting the value of fig.dpi. It takes a float. The higher the value higher the resolution of the figure. |
Turn Learning into Career Growth
matplotlib.pyplot.savefig() in Python
Syntax
Parameters
| Parameter | Description |
|---|---|
| fname | It takes a file name as a string or absolute path to save an image at a specific location. |
| dpi | It stands for dots per inch. The higher the dpi higher the resolution of the image. It takes float. |
| metadata | Specifies key/value pair to store in the image metadata. Take data in the dict datatype. |
| bbox_inches | Bounding the box in inches only saves the given portion of the image. |
| pad_inches | Amount of padding around the figure when bbox_inches is 'tight'. |
| face color | Change the face color of the image. |
| edgecolor | Change the edge color of the image. |
| paper type | Specifies the type of paper, such as A1 to A10, etc. |
| format | It specifies the file's extension such as png, pdf, svg,, etc. |
| transparent | To make the image's background transparent. |
| orientation | Change the orientation of the image to landscape or portrait. |
Other Methods to Control Output Resolution
Scaler Placement Report and Statistics
Scaler learners achieved 2.5x salary growth with average post-Scaler CTC reaching ₹23L.
Changing the DPI of the Figure
We can change the resolution of the figure using the matplotlibrc file.
Output:

The above syntax will change the dpi of the figure to 300.
Changing the DPI of the Image
To change the image's resolution in matplotlib, we have to change the value of the key 'savefig.dpi' in the matplotlibrc file.
Output:
The above syntax will change the dpi of the image to 300.
Change the Default DPI Settings in Matplotlib
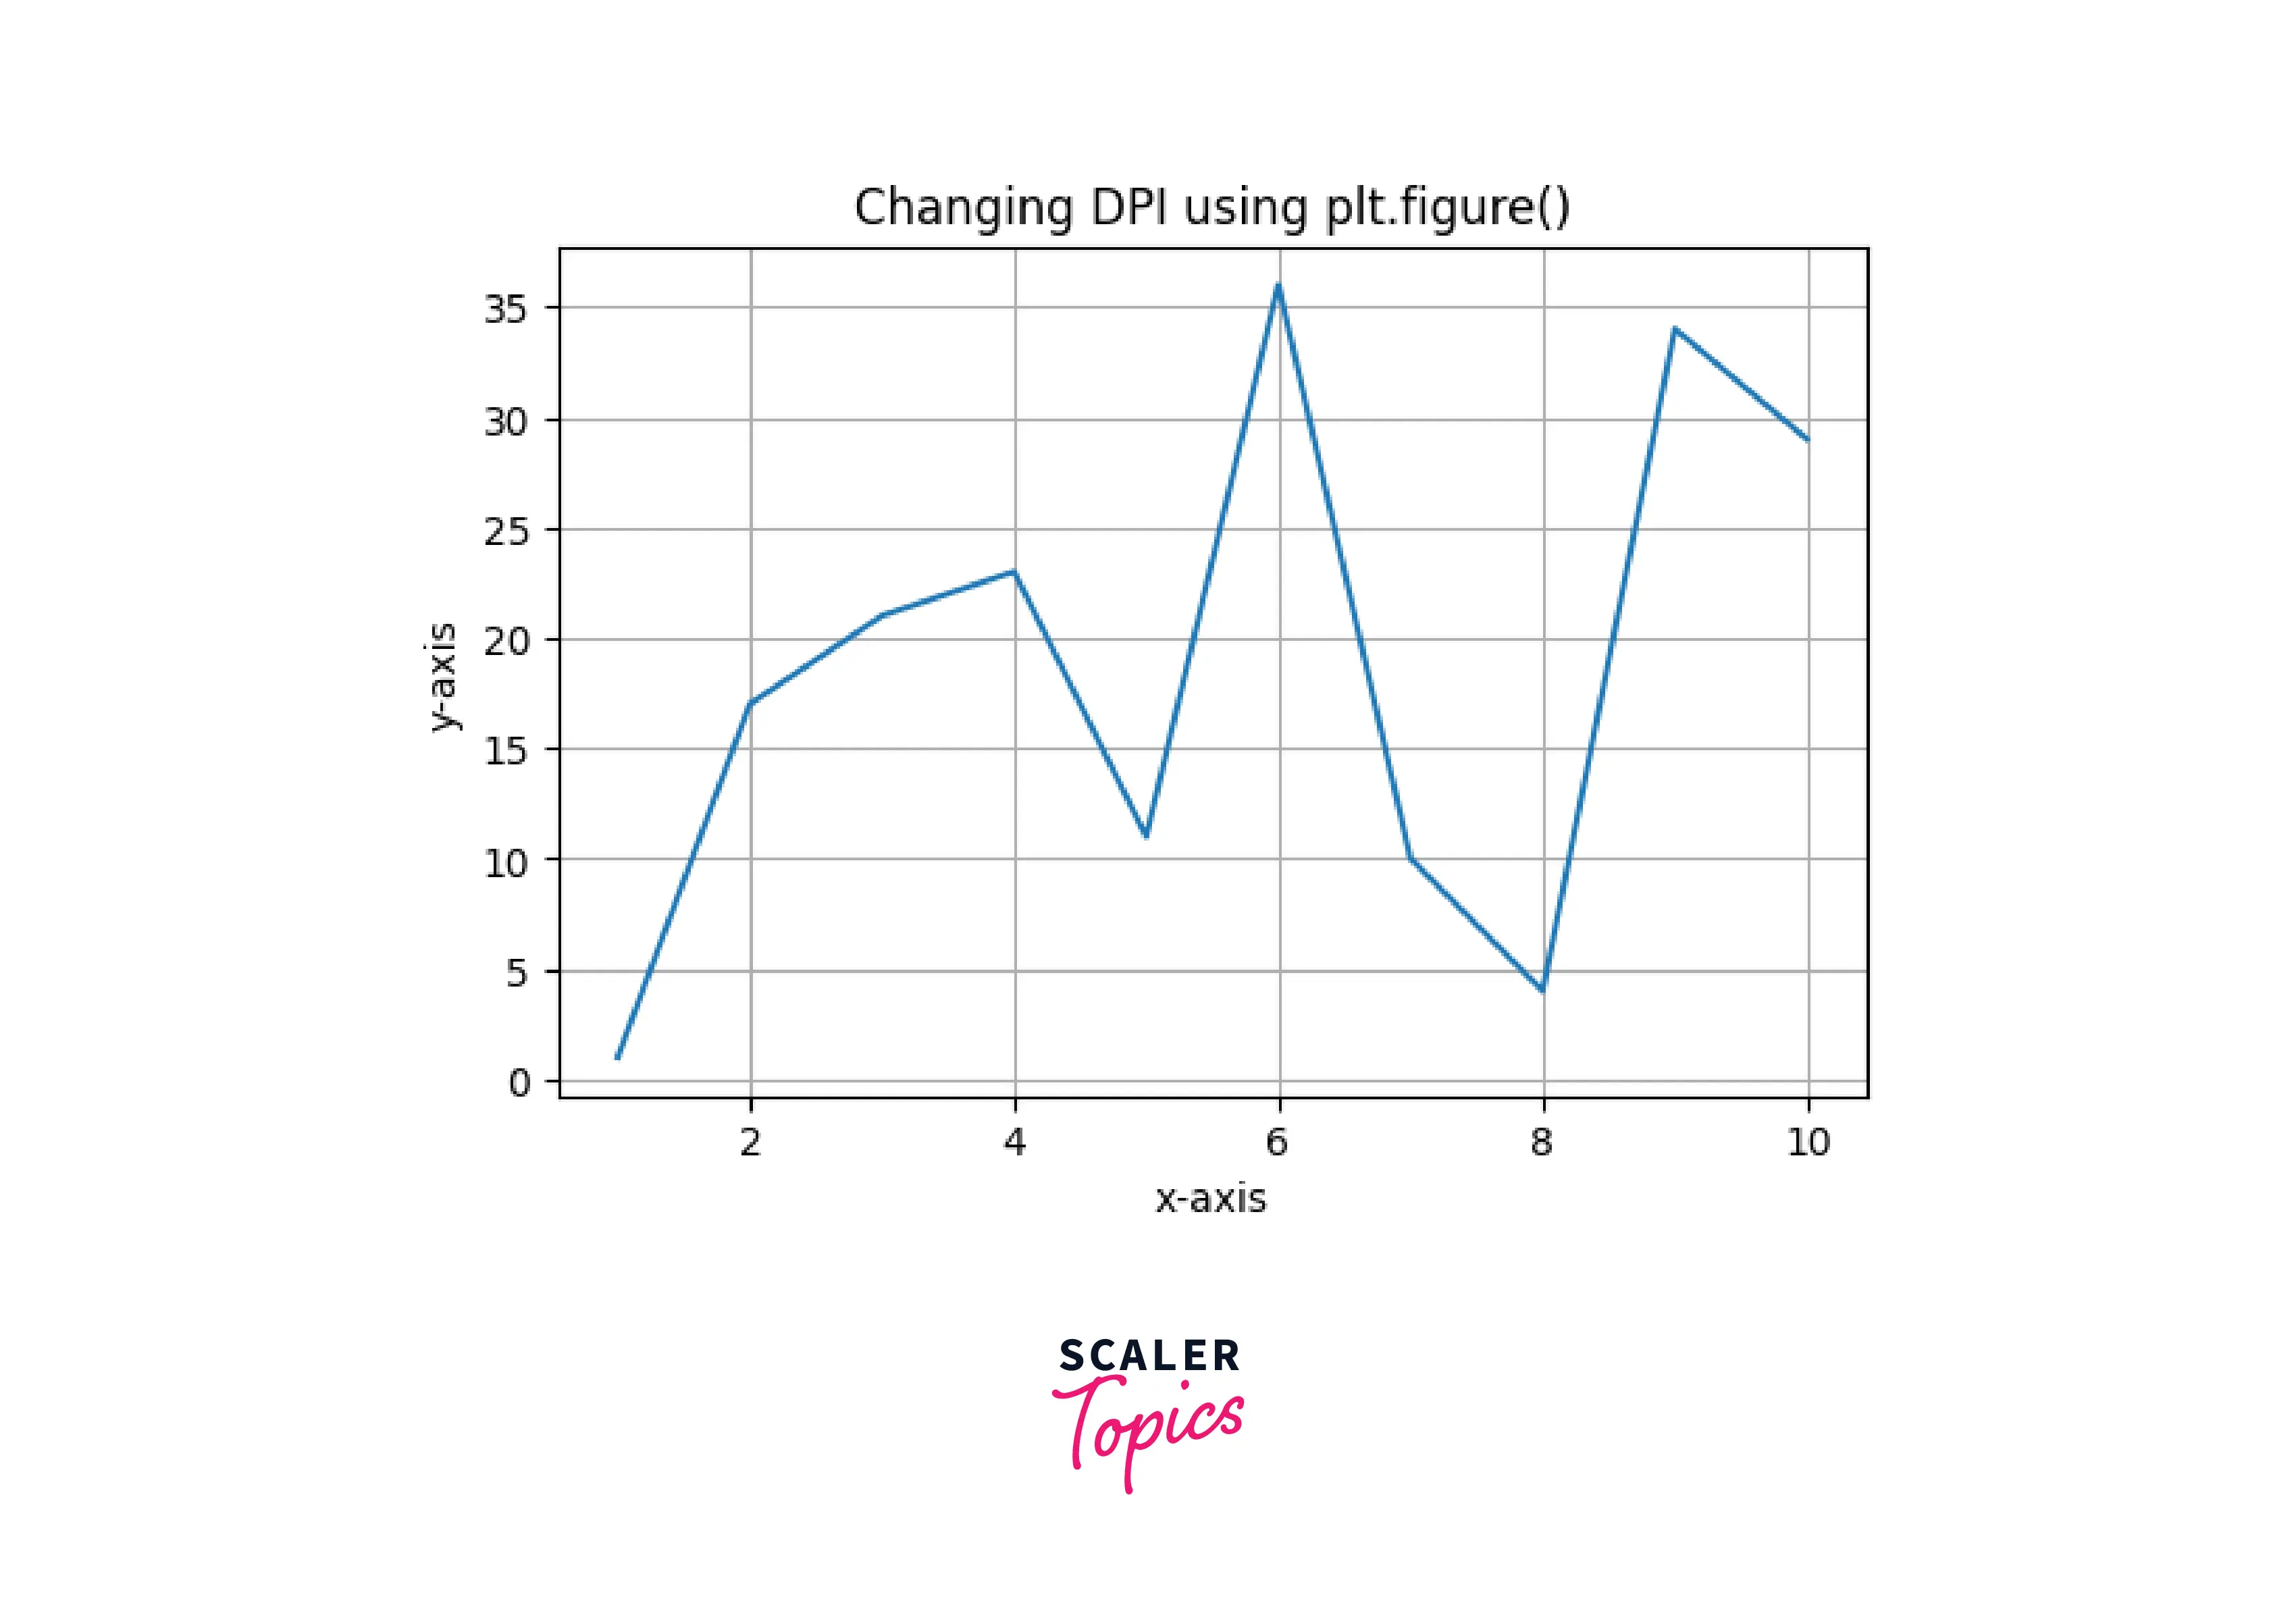
Example1: Changing the DPI using plt.figure()
Output:
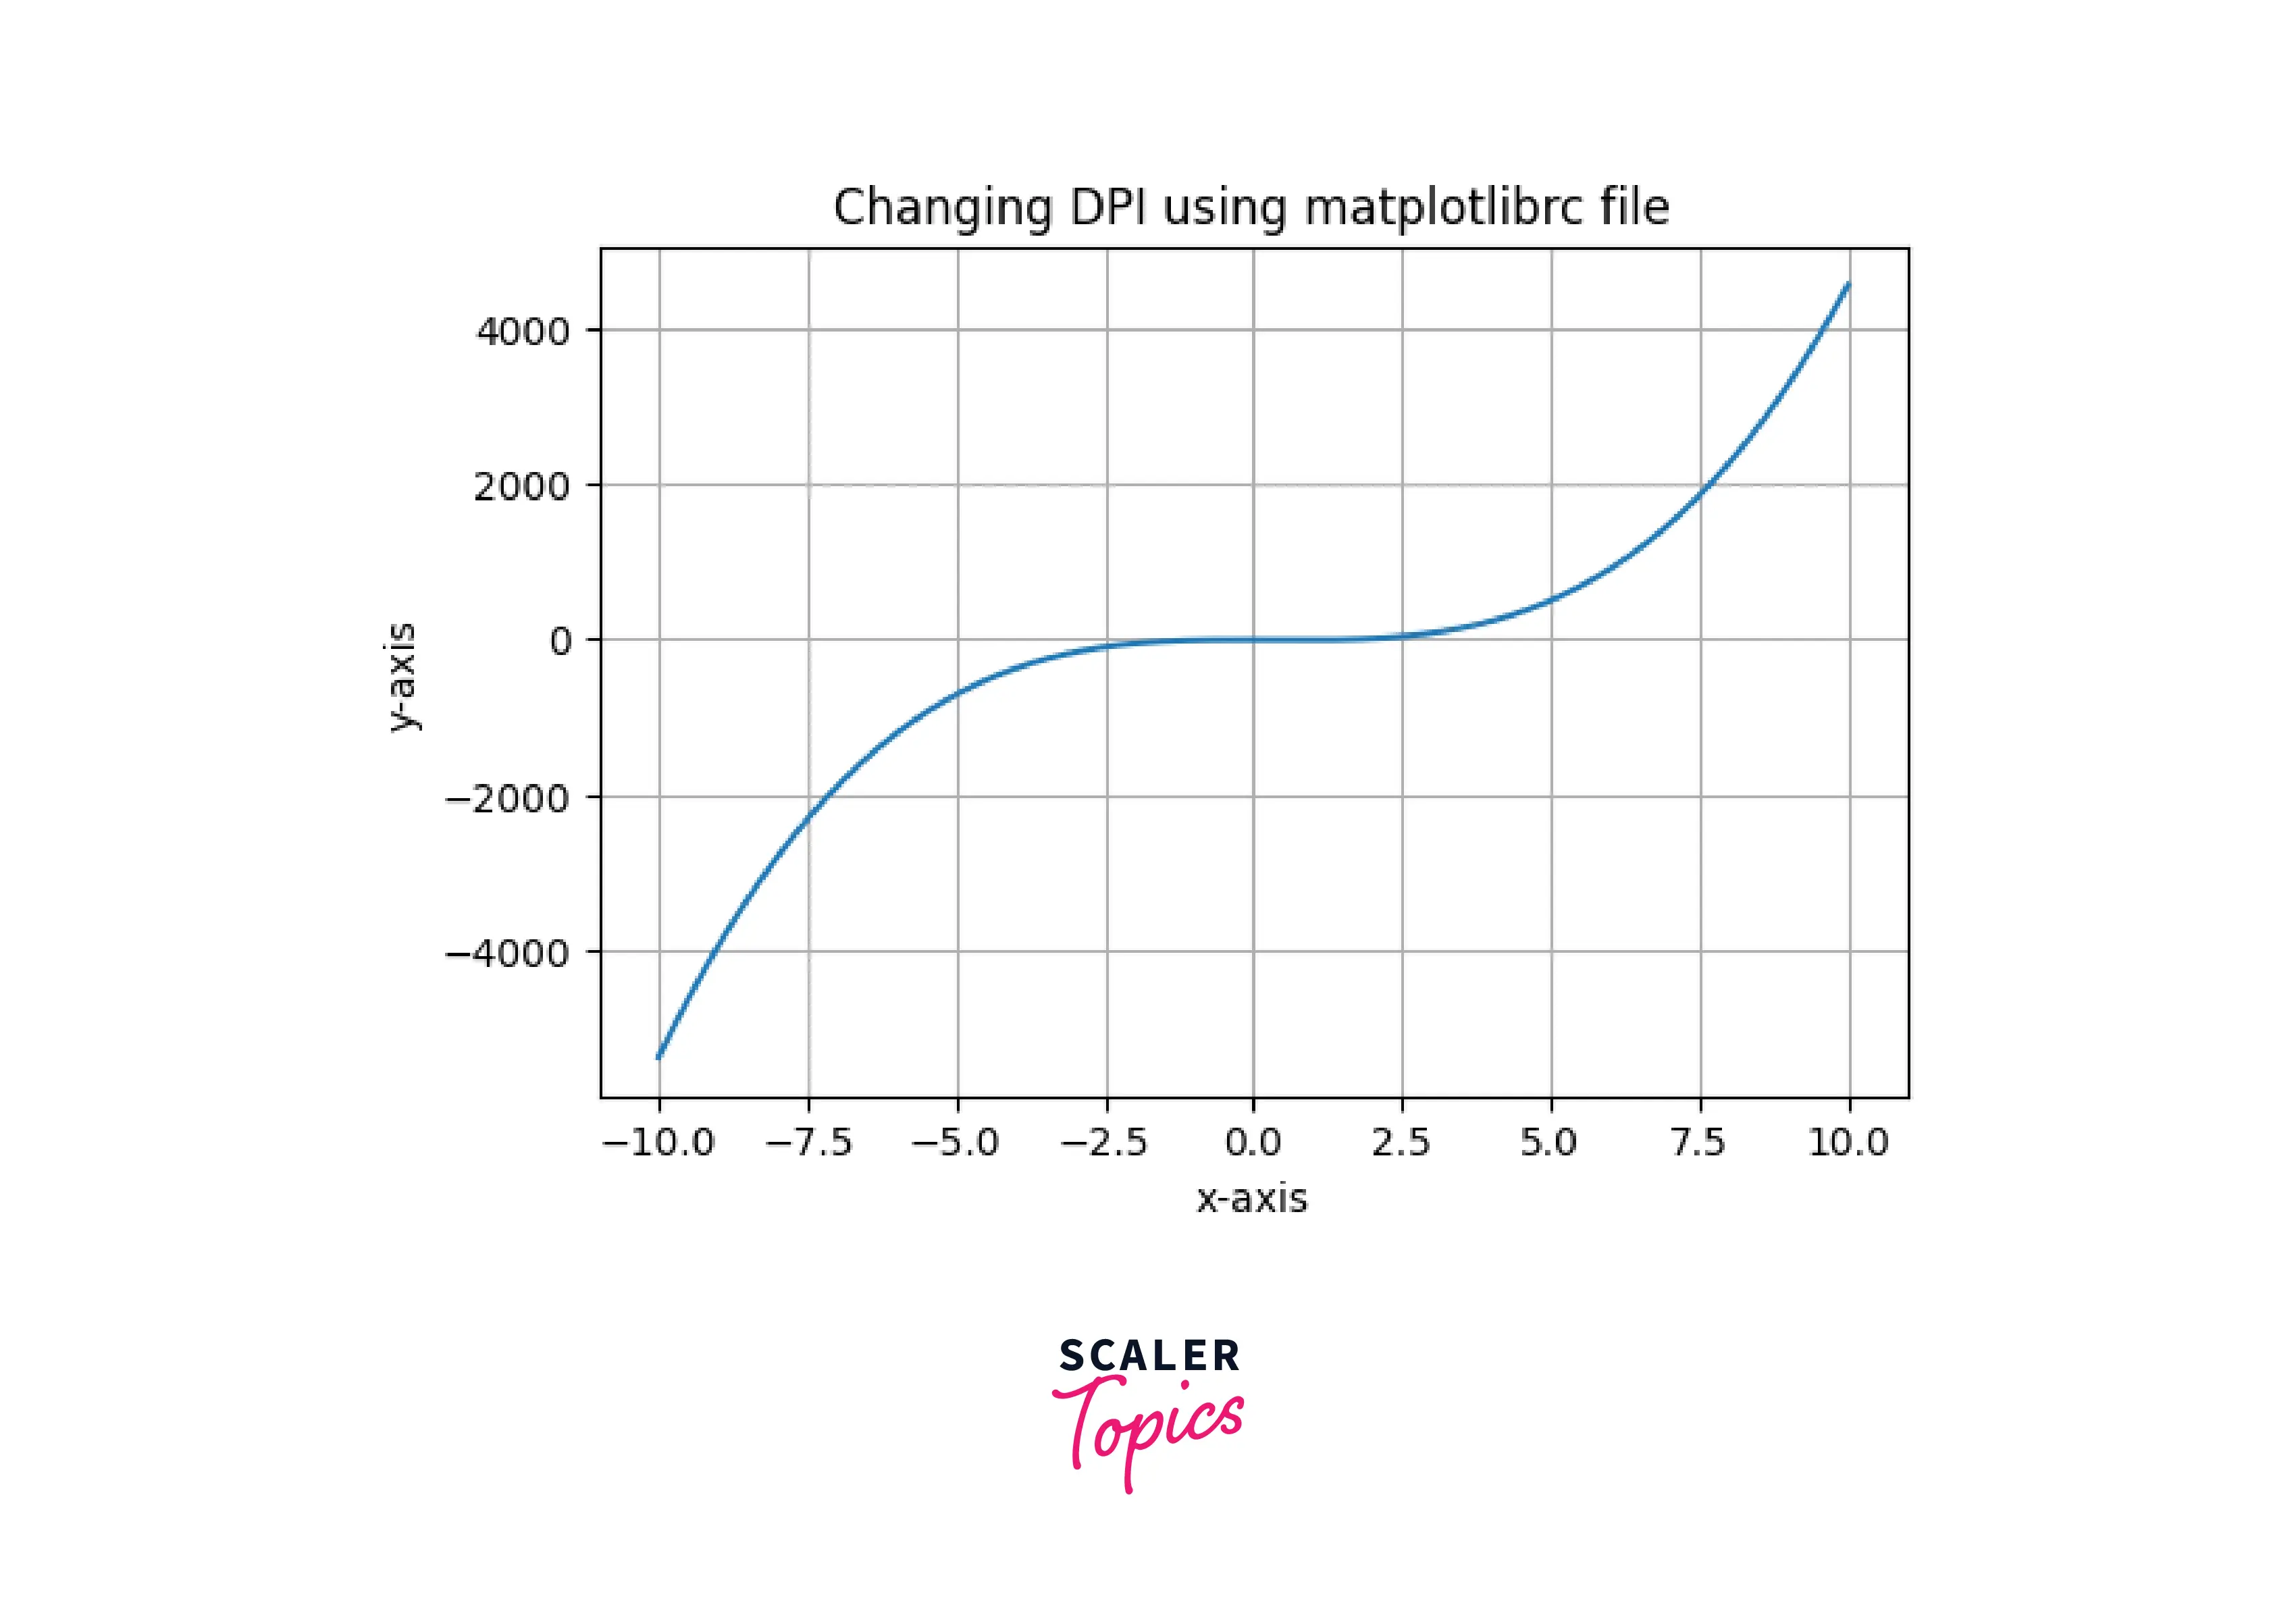
Example2: Changing the DPI of the plot using matplotlibrc file
Output:
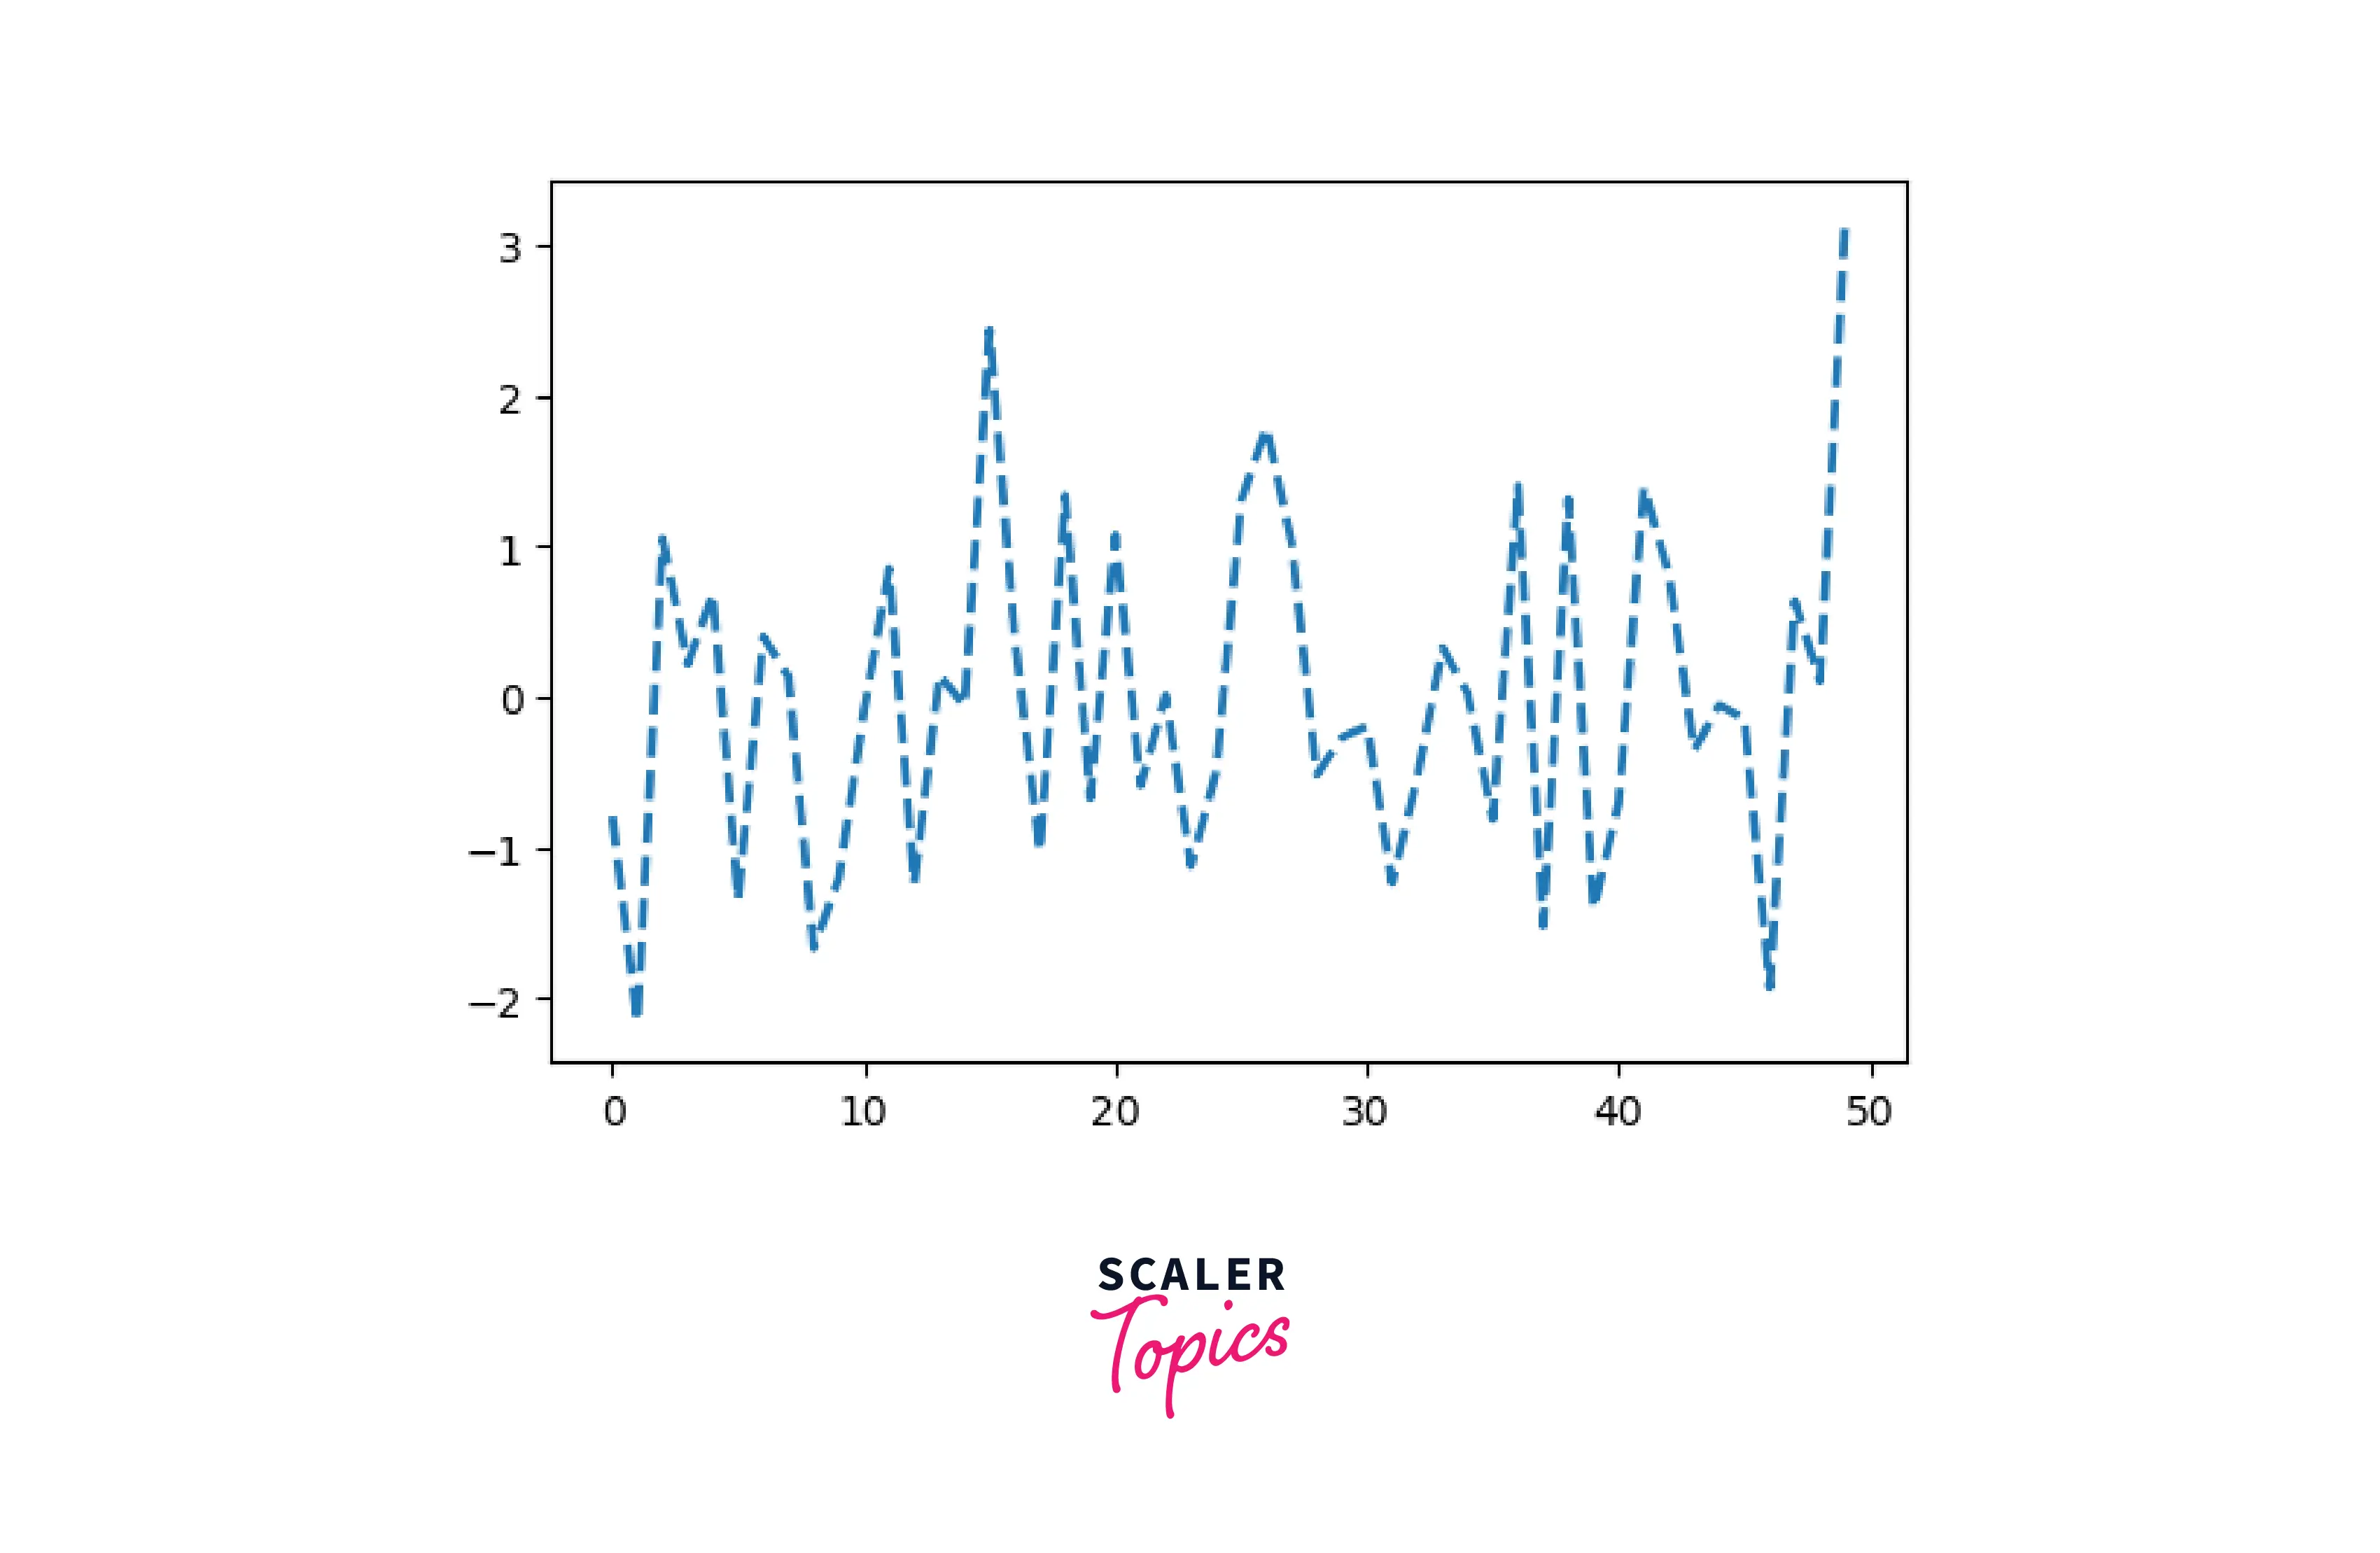
Example3: Changing the DPI of the plot using fig.dpi
Output:
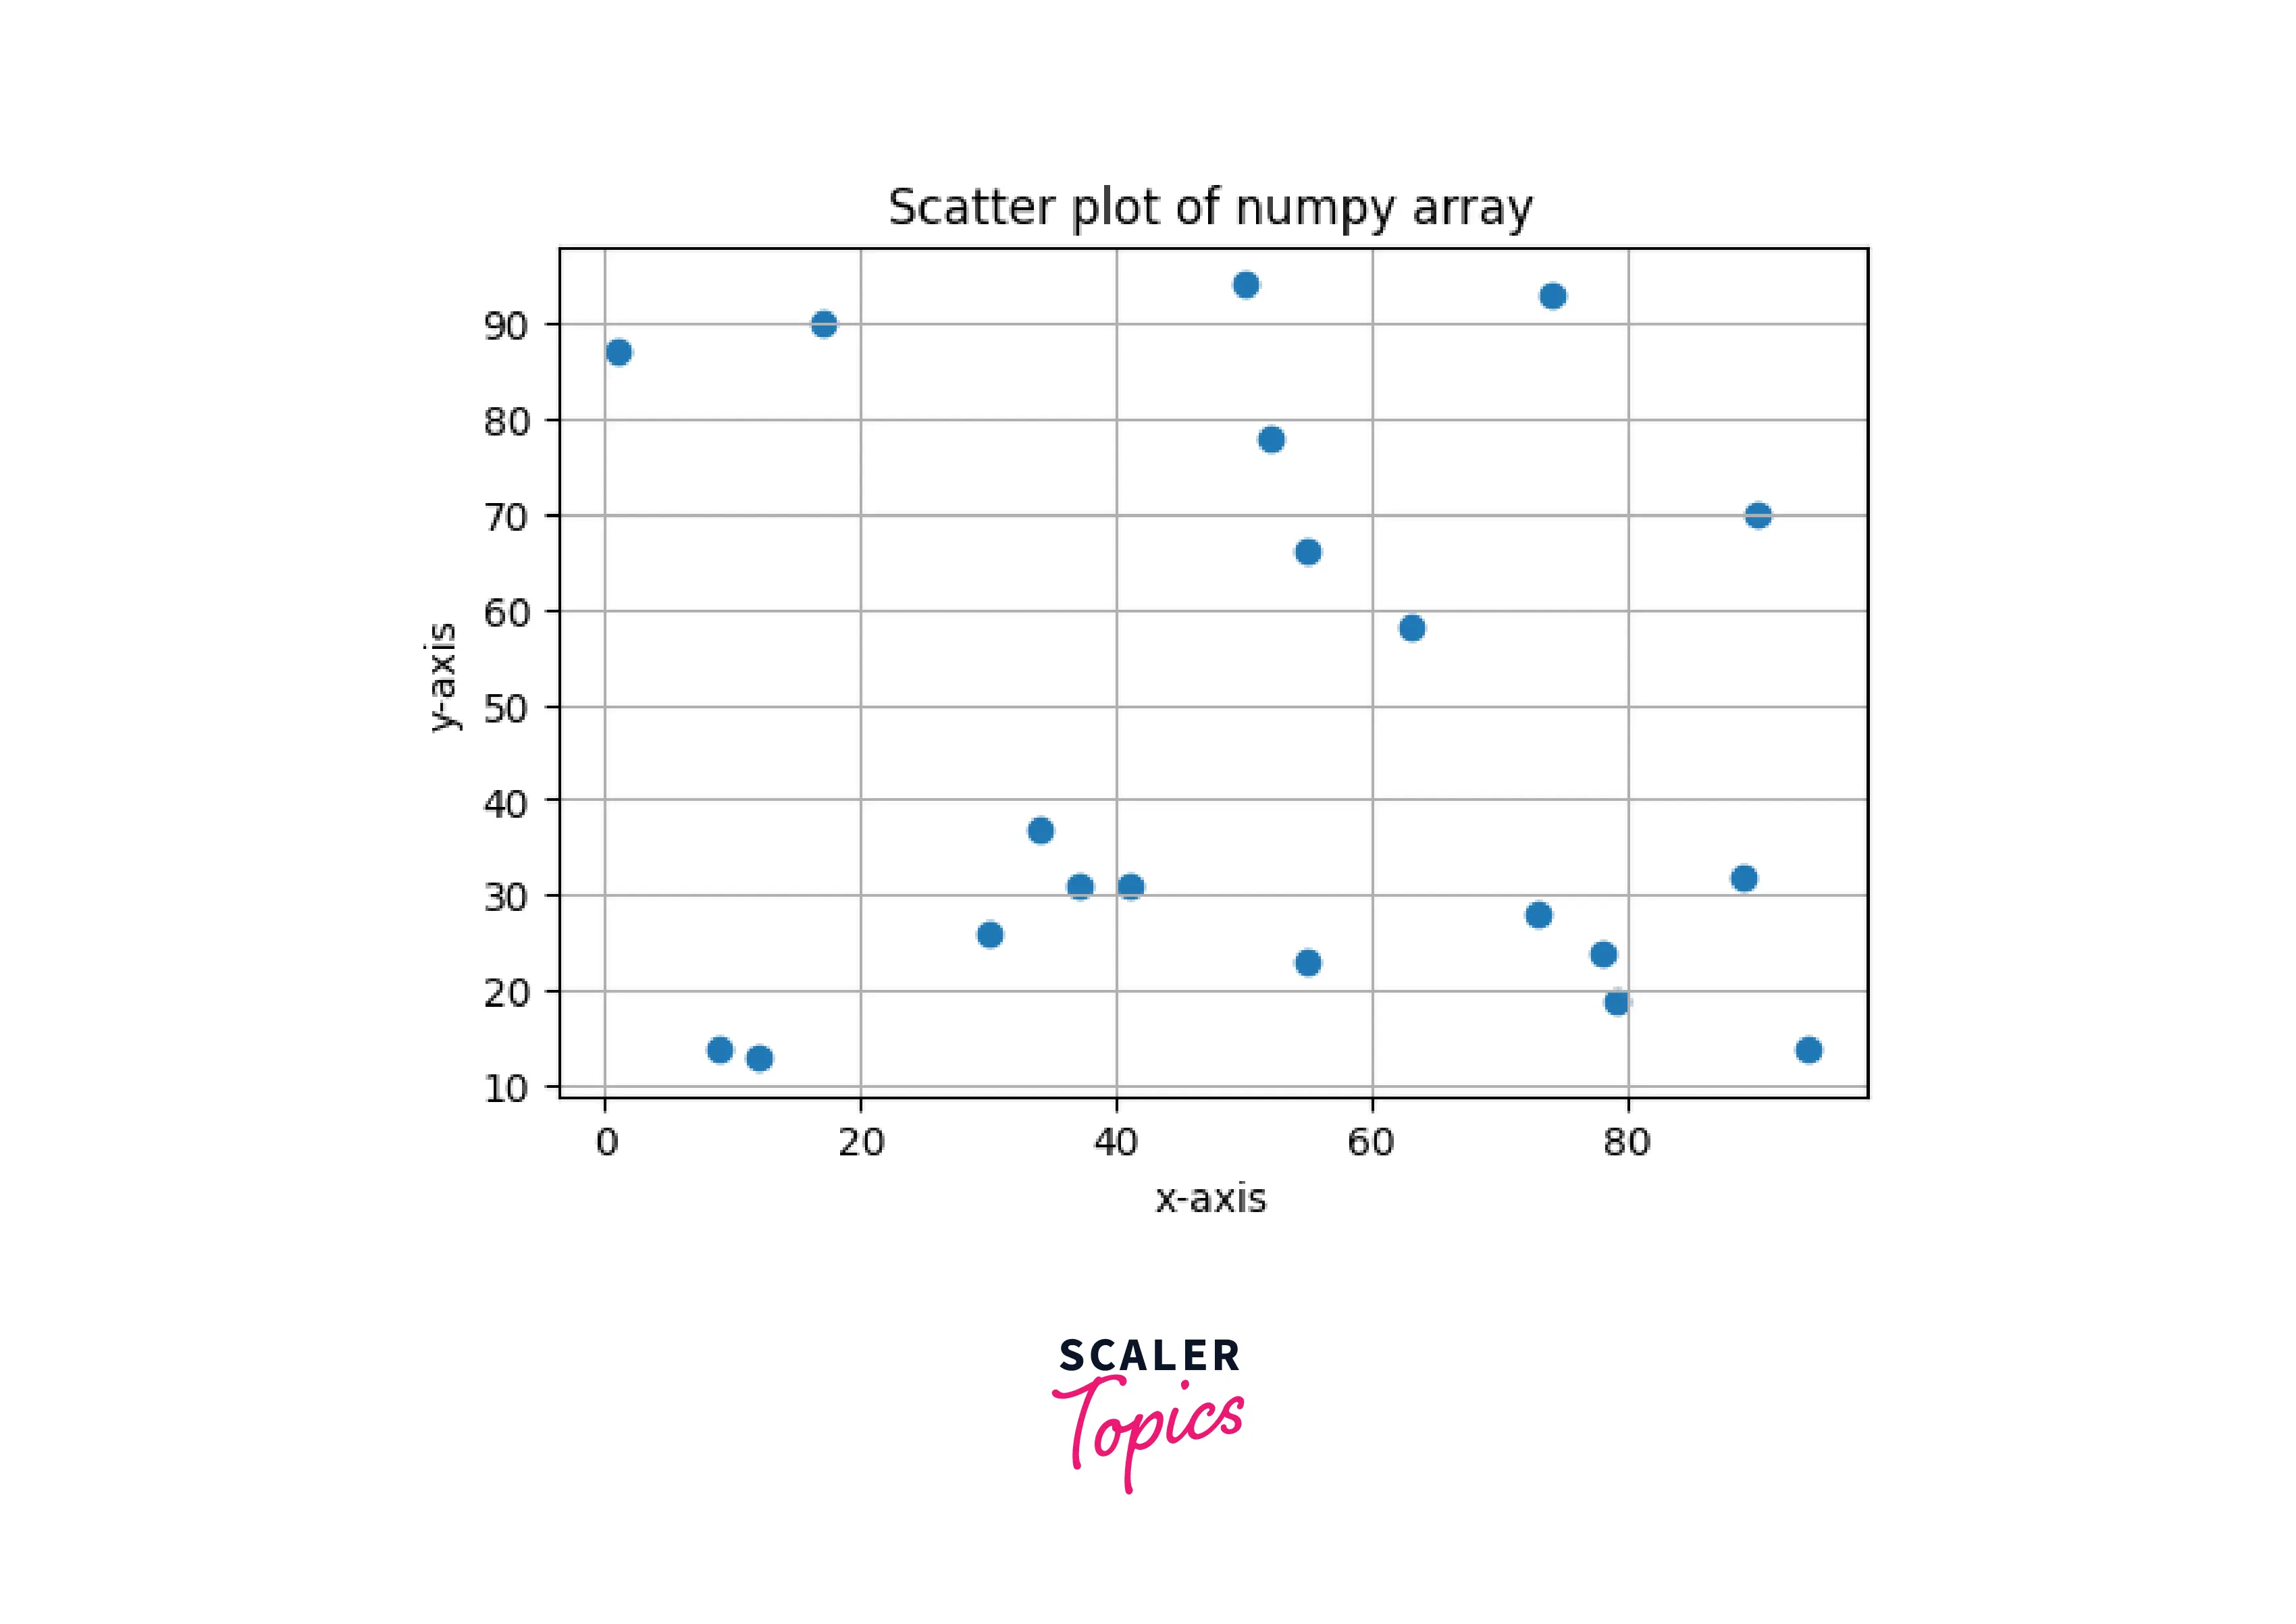
Example4: Changing the DPI of the image using savefig()
Output:
Example5: Changing the DPI of the image using matplotlibrc file
Output:
Change the Default Image Format to a Vector Format
We fixed the figure's resolution problem by changing the DPI, but we can also improve the resolution by changing the image format to vector. After our pyplot import and inline magic, we can add the following commands to change the default format. Another vector format is PDF.
Example:
Output:
Conclusion
- DPI stands for dots per inch. The higher the value of DPI higher the resolution.
- Image resolution can be changed by increasing the DPI or changing the format to vector.
- We can change DPI by using the functions pyplot.figure(), by changing the key figure.dpi value in the matplotlibrc file, and using fig.dpi method
- For increasing the image resolution in matplotlib, we can save the plot in SVG and PDF format.