Errors Bars in Matplotlib
Overview
Error is a deviation between the calculated value and the actual value. When we graphically represent the data, some of it has irregularities. To mark these uncertainties and ambiguity, we use Error bars. They are used to show the errors in the plots. Matplotlib provides a function that can plot error bars along with the data to find ambiguity and improve the data's accuracy. We are going to discuss how we can plot error bars in matplotlib with some examples.
Scope
In this article we are going to dig deep into:-
-
The concept of Error Bars in matplotlib.
-
For plotting error bars in matplotlib, we will import the required library (Matplotlib), from which we can use the function of error bars to plot it along with the data.
-
We will also discuss the syntax, parameter, and return value of error bars in matplotlib to better understand the topic. Examples of implementing error bars in matplotlib are given below.
- Simplest errorbar
- Error bar with the only x-error axis
- Error bar with the only y-error axis
- Interactive Error bar in matplotlib
- Scatter plot with error bars
- Error bar in the bar graph
What are Error Bars in matplotlib?
Error bars in matplotlib are y vs. x as planes generated at each coordinate plotted on the axes. These are used to show the standard deviation or ambiguity to better understand the data's accuracy. They can be implemented on different plots like line plots, scatter plots, and bar graphs.
So, what is the function used for Matplotlib Errorbars?
We have: matplotlib.pyplot.errorbar() for this! It takes at least two parameters to plot error bars along with the data. Two more optional parameters are actually behind the plotting of the error bar xerr and yerr. These parameters plot the error bar at each coordinate representing the data.
A Simple example of error bars in matplotlib.

Transform Your Career
Choose from our industry-leading programs designed for career success
Modern Software and AI Engineering Program
Master full-stack development with AI integration

Modern Data Science and ML with specialisation in AI
Advanced data science techniques with AI specialization
Advanced AIML with Specialisation in Agentic AI
Deep dive into AIML with focus on Agentic systems
DevOps, Cloud & AI Platform Engineering
Build and manage AI-powered cloud infrastructure
AI Engineering Advanced Certification by IIT-Roorkee
Premier AI engineering certification from IIT-Roorkee
Syntax of Matplotlib Errorbar
Parameters of atplotlib errorbar
- x, y: Array or list of x and y axes data points to plot coordinates on the graph.
- xerr, yerr: An array or list of positive values.
- fmt (optional parameter): The data points/lines format contains the string value.
- ecolor (optional parameter): Color of the errorbar lines.
- elinewidth (optional parameter): Linewidth of the errorbar lines
- capsize (optional parameter): The length of the error bar caps in points and default 0.0.
- barsabove (optional parameter): The datatype of this parameter is bool, and the default value is false. If true, will plot the error bars above the plot symbols.
- lolims, uplims, xlolims, xuplims (optional parameters): The data type of this parameter is bool, and the default value is false. They contain boolean values, indicating that a value only gives upper/lower limits.
- capthick (optional parameter): The datatype of this parameter is float and the default value is none. It controls the thickness of the error bar cap in points.
- errorevery (optional parameter): The datatype of this parameter is int, and the default value is 1. It contains integer values used to draw error bars on a subset of the data.
The Return Value of Matplotlib Errorbar
Matplotlib errorbar returns the ErrorbarContainer The container contains:
- plotline: Line2D instance of x, y plot markers and line.
- caplines: A tuple of Line2D instances of the error bar caps.
- barlinecols: A tuple of collections of lines along with Horizontal and vertical error ranges.
Examples of Matplotlib Errorbar
Turn Learning into Career Growth
Example1: Simplest Errorbar
Output:
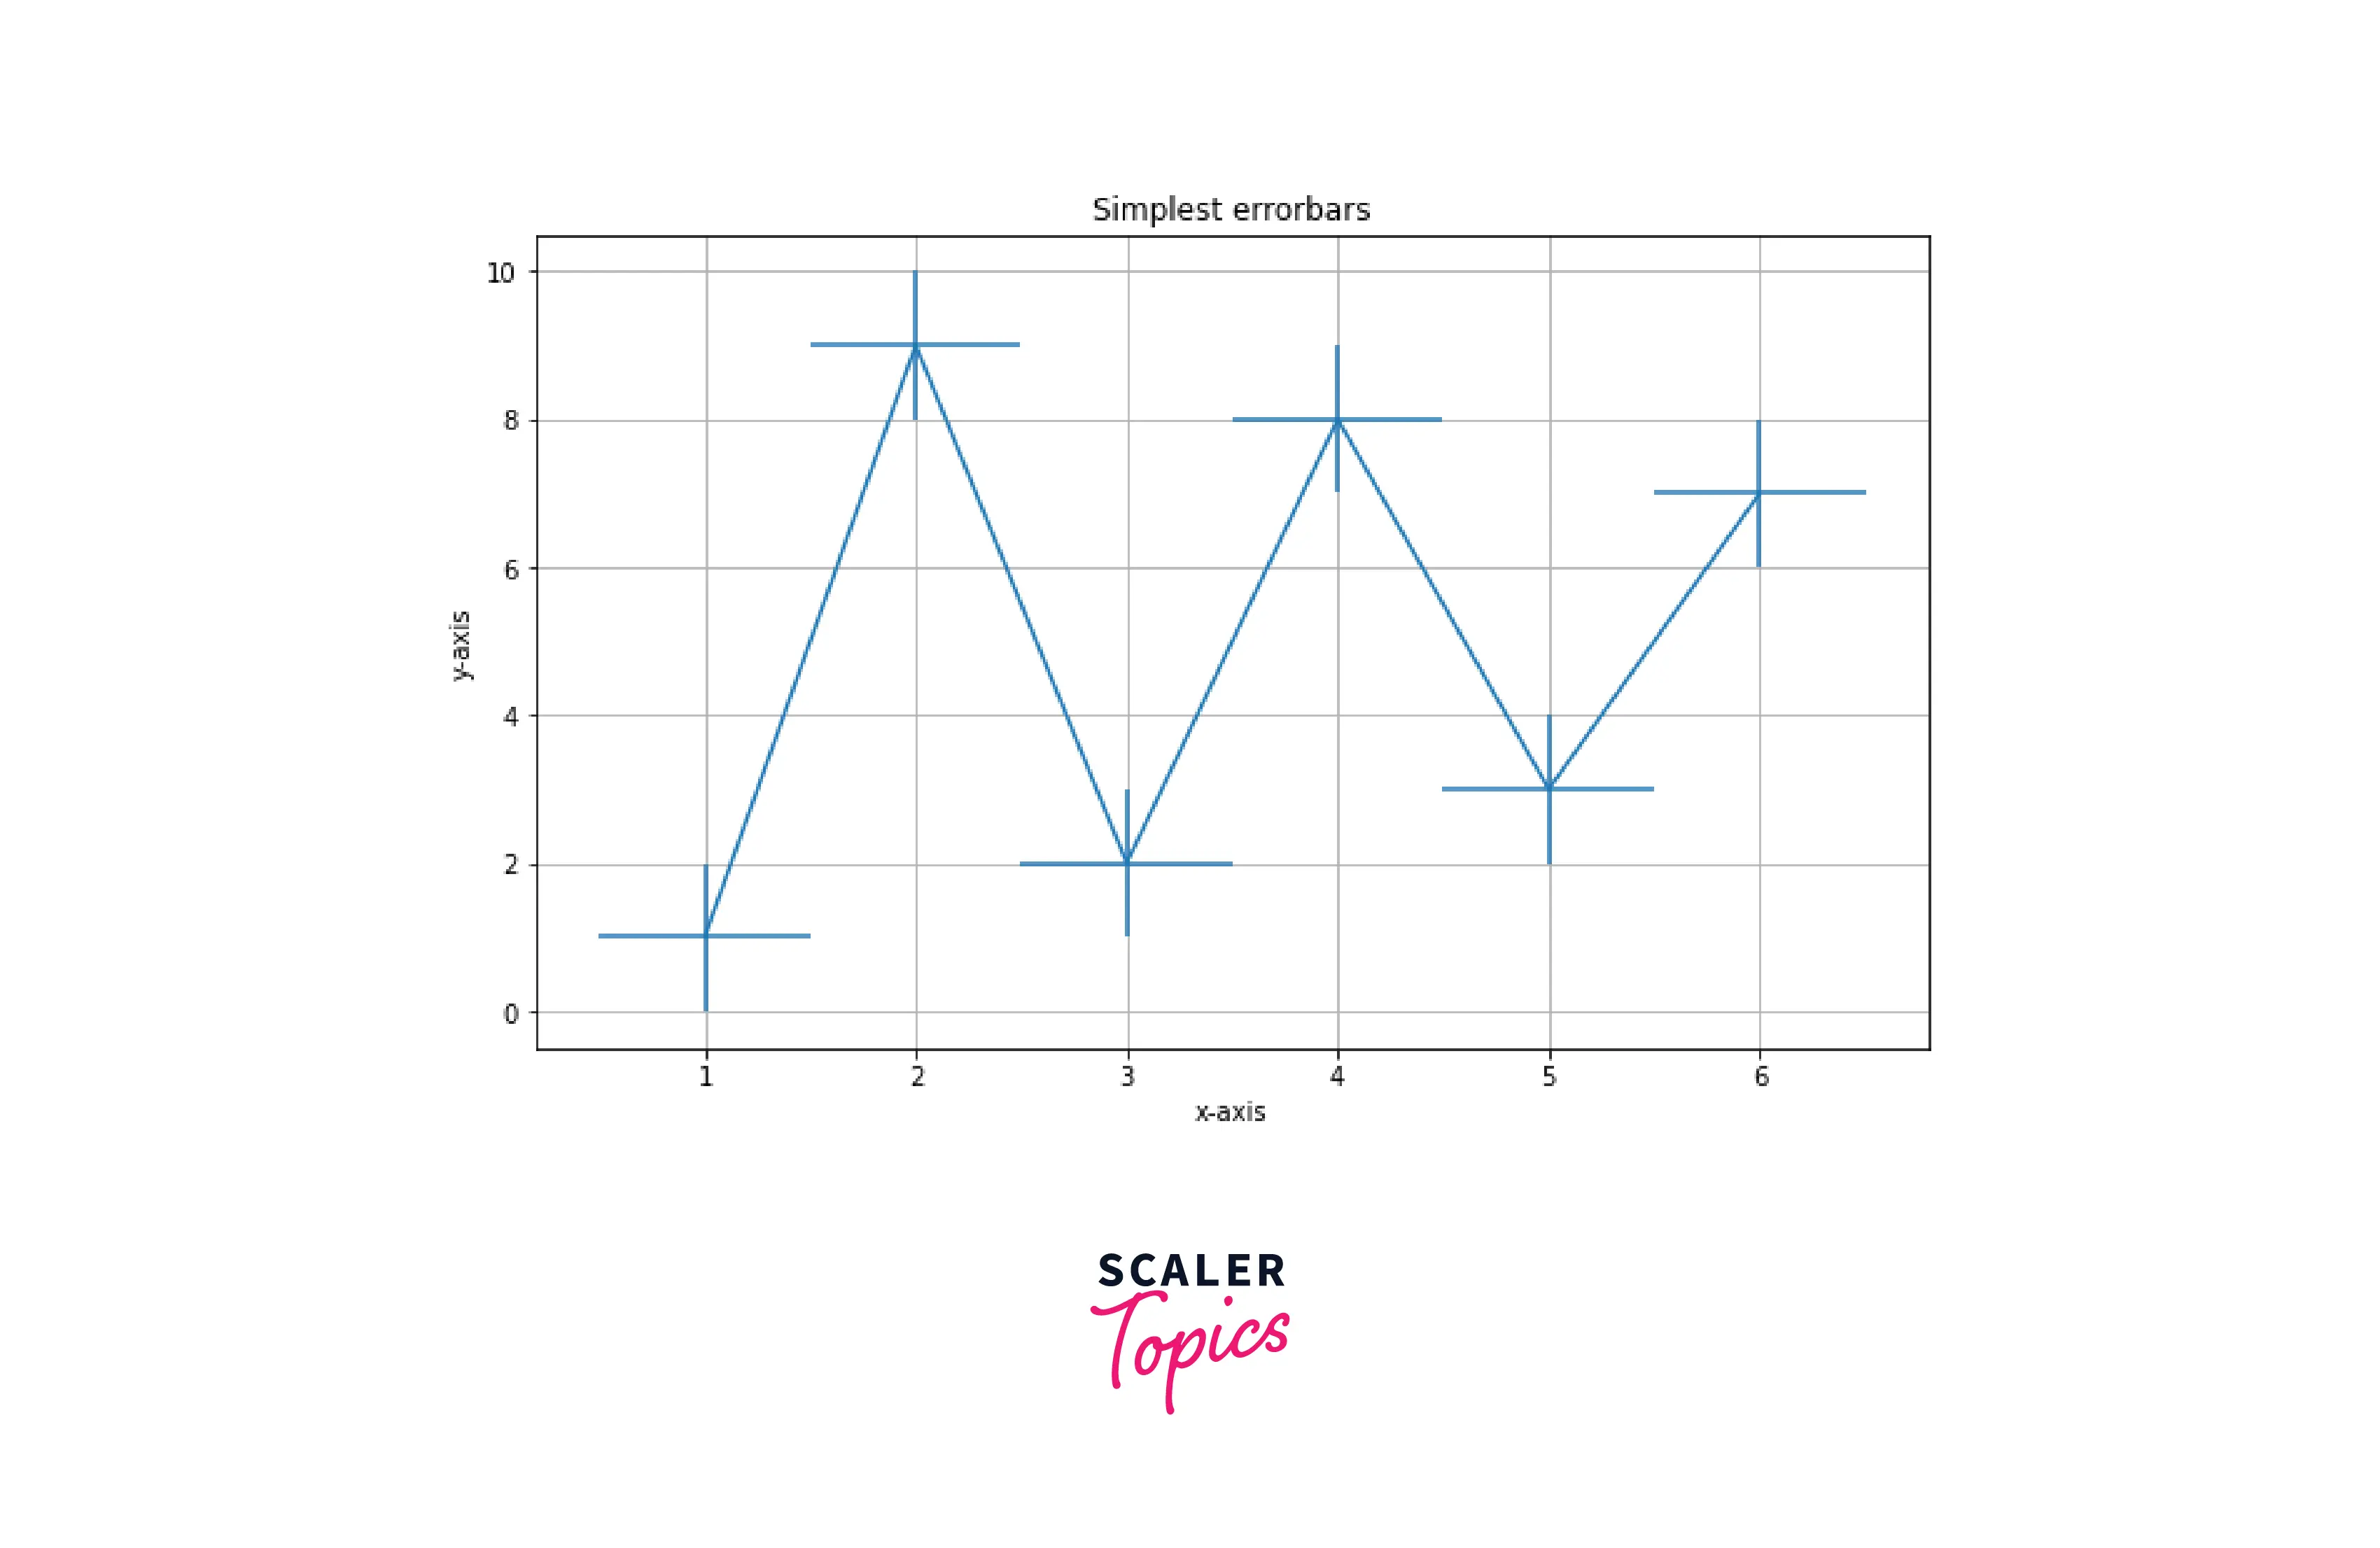
Code Explanation:
- We import the required modules.
- x and y are the lists containing the data points on the axes.
- matplotlib.pyplot.title(), matplotlib.xlabel() and matplotlib.ylabel() are used to add more detail to the plot.
- matplotlib.pyplot.errorbar() takes at least two parameters (x and y data points) to add error bars to the plot. The error axes plotted on each coordinate are the xerr and yerr.
- matplotlib.pyplot.grid() and matplotlib.pyplot.show() are used to add grid to the plot and display the plot respectively.
Example2: Error Bar with x-error Axis Only
Output:

Code explanation:
- Importing the required modules.
- x and y list containing data points.
- y_error list contains random floats ranging from 1 to 2, random floats are generated using random.uniform().
- matplotlib.pyplot.title(), matplotlib.pyplot.xlabel() and matplotlib.pyplot.ylabel() is used to add details to the figure.
- matplotlib.pyplot.errorbar() used to plot the error bar on the markers where ecolor is red, elinewidth is 5, fmt is square, color is black, and xerr is a list containing the length of each error x-axis at each coordinate.
Example3: Error Bar ith y-error Axis Only
Output:

Code Explanation:
- Importing the required modules.
- x and y list containing data points.
- y_error list contains random floats ranging from 1 to 2; random floats are generated using random.uniform().
- matplotlib.pyplot.title(), matplotlib.pyplot.xlabel() and matplotlib.pyplot.ylabel() is used to add details to the figure.
- matplotlib.pyplot.errorbar() used to plot the error bar on the markers where ecolor is red, elinewidth is 5, fmt is square, color is black, and yerr is a list containing the length of each error y-axis at each coordinate.
Example4: Interactive Error Bar in Matplotlib
Output:

Code explanation:
- Importing the required module.
- x and y are the lists containing the data points on the axes.
- matplotlib.pyplot.rcparams['figure.figsize'] is used to change the size of the figure.
- matplotlib.errorbar() used to draw errorbar at each coordinates.
- xerr and yerr are 0.5 and 1, respectively (length of error axes).
- fmt: change the style of the marker. Set it to square.
- ecolor: change the color of the errorbar. Set it to green.
- color: change the color of the marker. Set it to brown.
- elinewidth: set the error line width to 4.
- capsize: set the capsize of errorbar to 5.
Example5: Scatter Plot With Error Bars
Output:
 Code explanation:
- Importing the required module.
- List x and y contain data points of the axes.
- random.uniform() is used to generate a float in a range, with for loop we can generate multiples random floats.
- matplotlib.scatter() is used to generate a scatter plot.
- matplotlib.errorbar() generates error bars at each marker. The marker shape is square, and the error line color is black. The marker color is red.
Example6: Error bar in a bar graph
Output:

Code explanation:
- Importing the required modules
- List x and y contain data points of the axes.
- random.uniform() is used to generate floats.
- matplotlib.pyplot.bar() is used to generate a bar graph, and the width of the bars is 0.3.
- matplotlib.errorbar() is used to generate error bars at each marker; the marker shape is square, the error lines color is black, and the marker color is red.
Transform Data into Actionable Insights! Enroll Now in Our Leading Data Science Program and Get Certified.
Scaler Placement Report and Statistics
Scaler learners achieved 2.5x salary growth with average post-Scaler CTC reaching ₹23L.
Conclusion
- Error bars in matplotlib are y vs. x planes generated at each coordinate to show the standard deviation and irregularities in the data.
- matplotlib.pyplot.errorbar() is the function required to generate error bars.
- This function takes at least two parameters,xand y data points, and other parameters are for modifying the properties of marker and error axes.
- Matplotlib error bar return ErrorbarContainer.