Generating PDF or SVG Documents
Overview
Matplotlib provides the modules and functions to plot data in python and allows us to share the plots. Matplotlib provides a minimalistic user interface to export data. Saving the plot in matplotlib can be done using the savefig() method, where we can save the plot to the local memory in a Bitmap-based file PNG or JPG or other richer formats like PDF and SVG.
Transform Your Career
Choose from our industry-leading programs designed for career success
Modern Software and AI Engineering Program
Master full-stack development with AI integration

Modern Data Science and ML with specialisation in AI
Advanced data science techniques with AI specialization
Advanced AIML with Specialisation in Agentic AI
Deep dive into AIML with focus on Agentic systems
DevOps, Cloud & AI Platform Engineering
Build and manage AI-powered cloud infrastructure
AI Engineering Advanced Certification by IIT-Roorkee
Premier AI engineering certification from IIT-Roorkee
Introduction
Matplotlib provides a variety of formats (pdf, png, svg, jpg, etc.) to save a plot or multiple subplots. We will discuss generating PDF or SVG documents in matplotlib.PDF for Portable document format, and SVG stands for Scalable vector graphics. PDF and SVG are vector formats by which we can save plots in higher resolution. The export as vector-based SVG or PDF files is generally preferred over bitmap-based PNG or JPG files` as richer formats usually provide higher quality plots and smaller file sizes.
Scaler Placement Report and Statistics
Scaler learners achieved 2.5x salary growth with average post-Scaler CTC reaching ₹23L.
Generating PDF or SVG Documents in Matplotlib
How to Do It?
We have two functions for Generating PDF or SVG documents in matplotlib first is matplotlib.pyplot.savefig(), and the second is PdfPages().savefig(). In matplotlib.pyplot.savefig(), we have to plot the data on the graph and then call the savefig() function with the file name as a parameter to save the figure in the current directory. In PdfPages().savefig() function, first we have to instantiate the PDF, we can add pages in the PDF by creating a new figure and saving it in the PDF using savefig() function of PdfPages() function, then, at last, write the PDF in the local memory.
savefig() Method to Save Plots as PDF or SVG File
Syntax
Parameters
| Parameter | Description |
|---|---|
| fname: | It takes a file name as a string or absolute path to save an image at a specific location. |
| dpi: | It stands for dots per inch. The higher the dpi higher the resolution of the image. It takes float. |
| metadata: | Specifies key/value pair to store in the image metadata. Take data in the dict datatype. |
| bbox_inches: | Bounding the box in inches only saves the given portion of the image. |
| pad_inches: | Amount of padding around the figure when bbox_inches is 'tight'. |
| face color: | Change the face color of the image. |
| edgecolor: | Change the edge color of the image. |
| paper type: | Specifies the type of paper, such as A1 to A10, etc. |
| format: | It specifies the file's extension such as png, pdf, svg,, etc. |
| transparent: | To make the image's background transparent. |
| orientation: | Change the orientation of the image as landscape or portrait. |
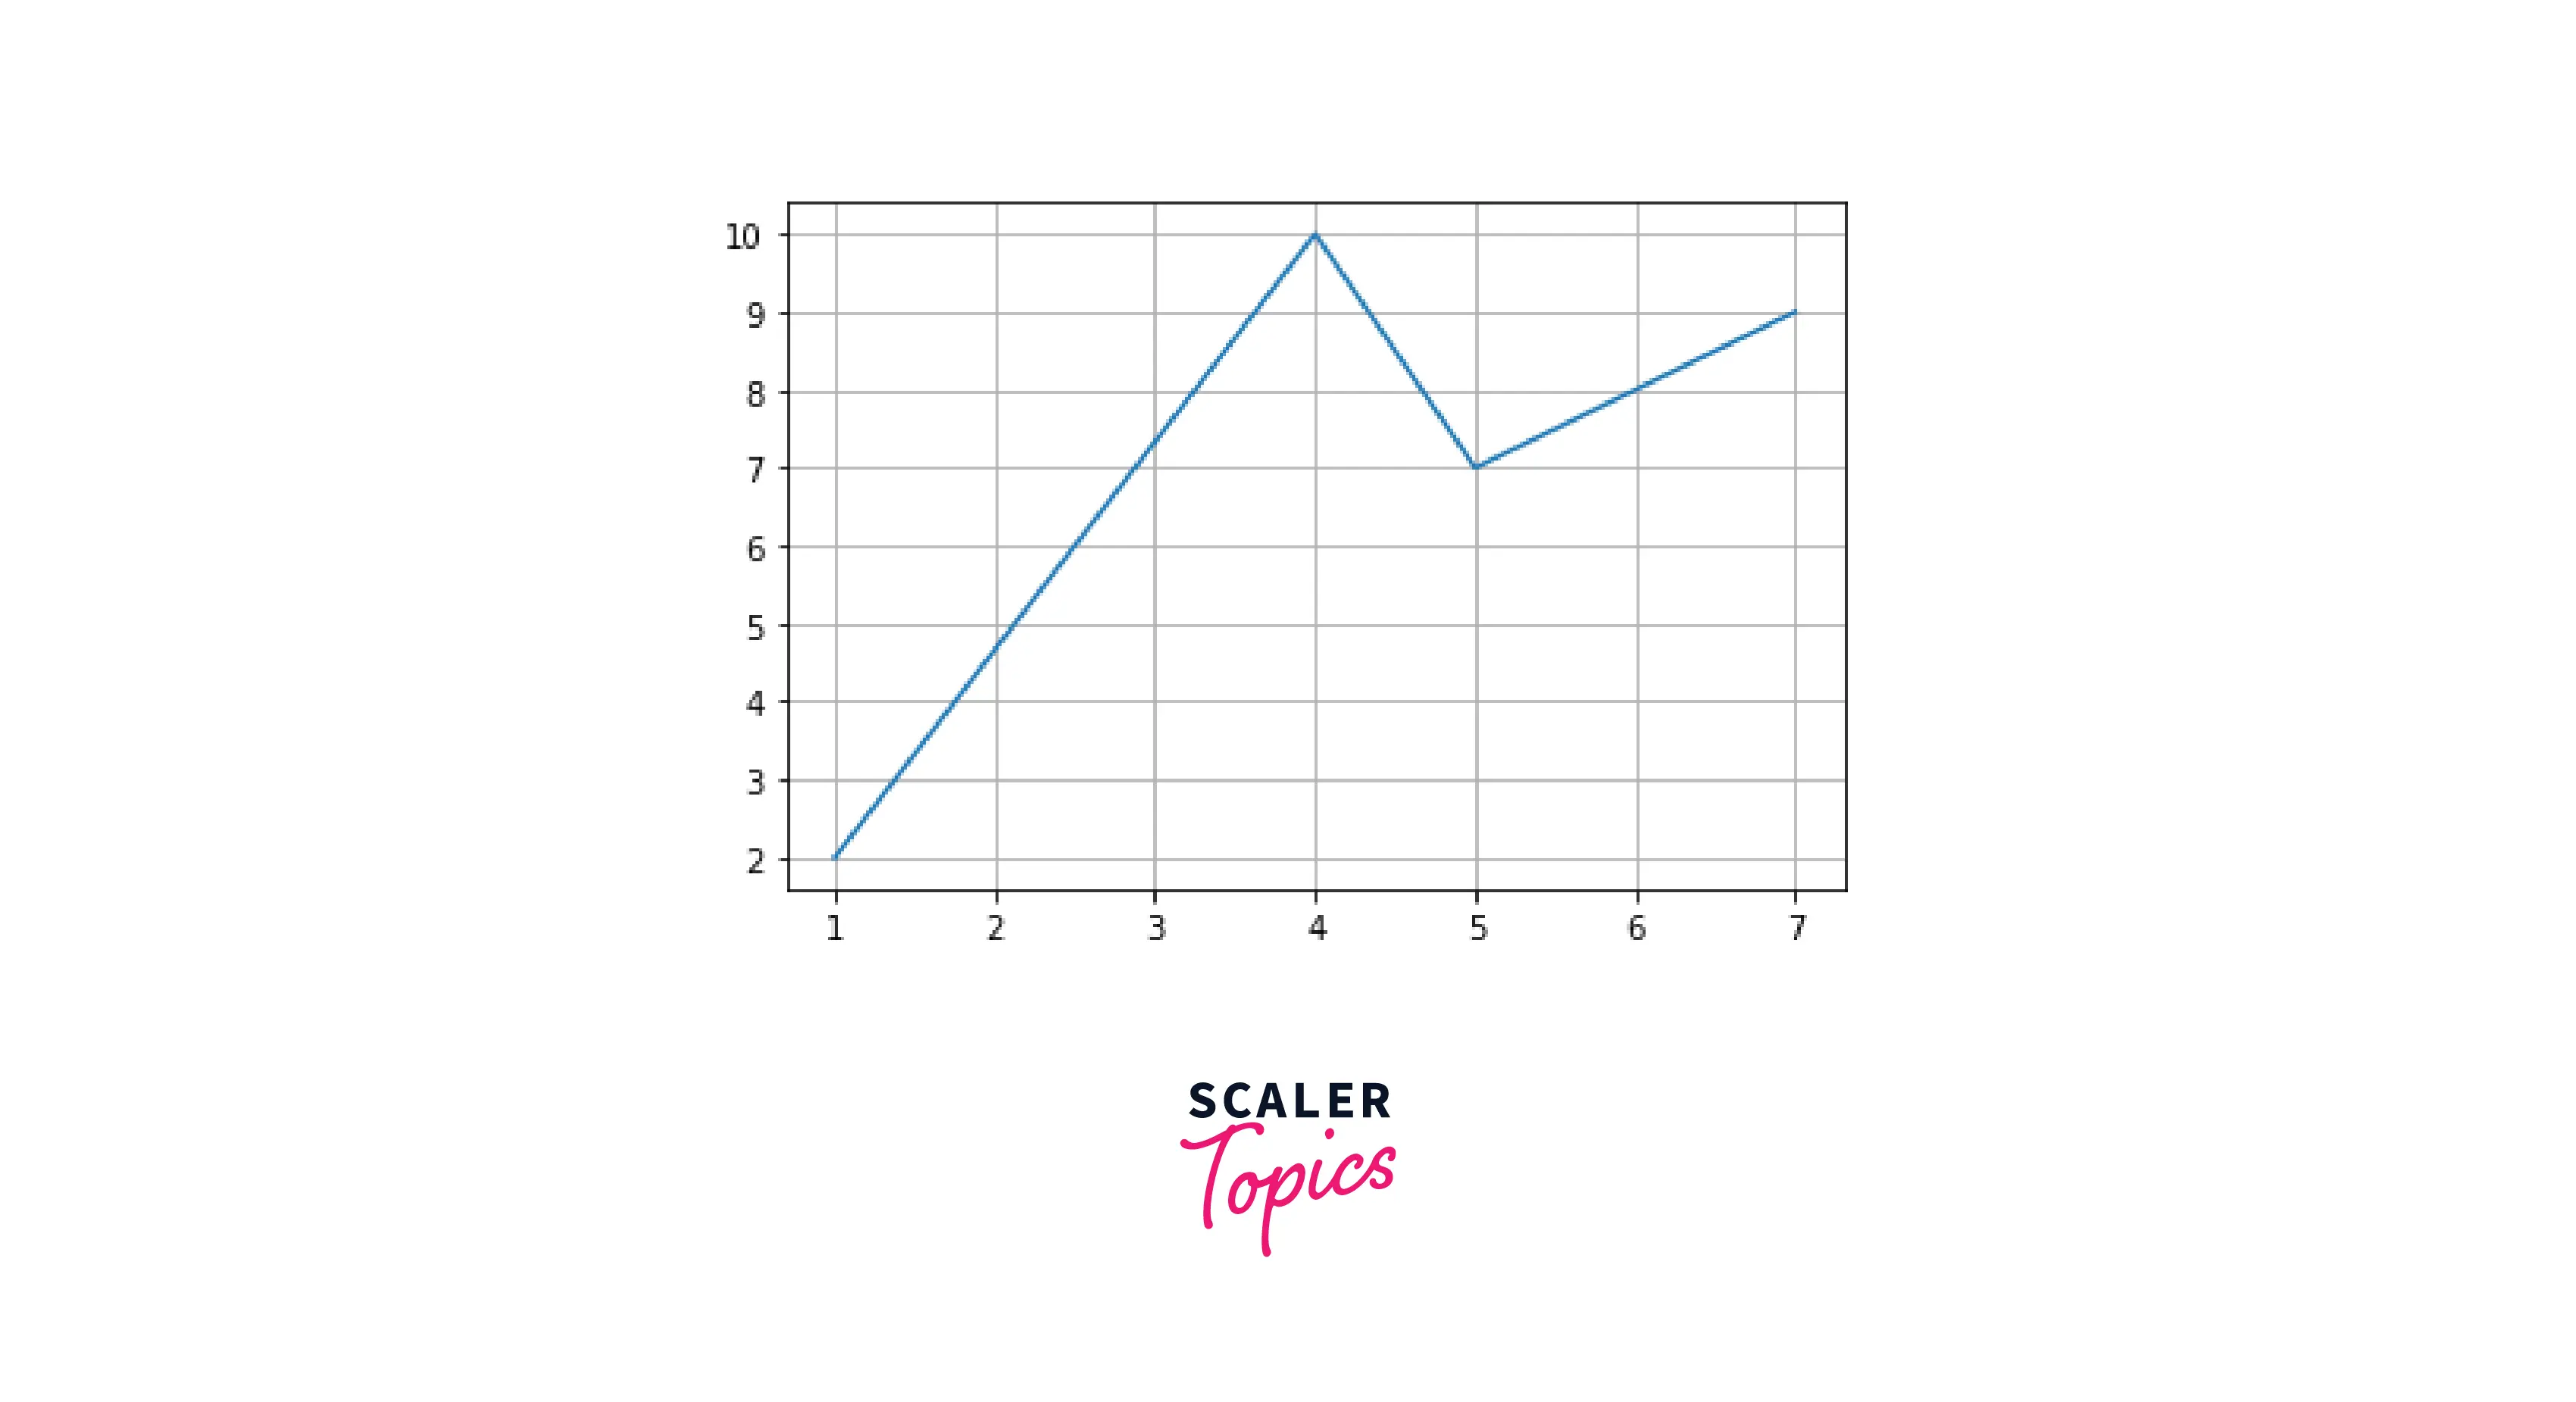
Example1: Saving plot in SVG format
Output:
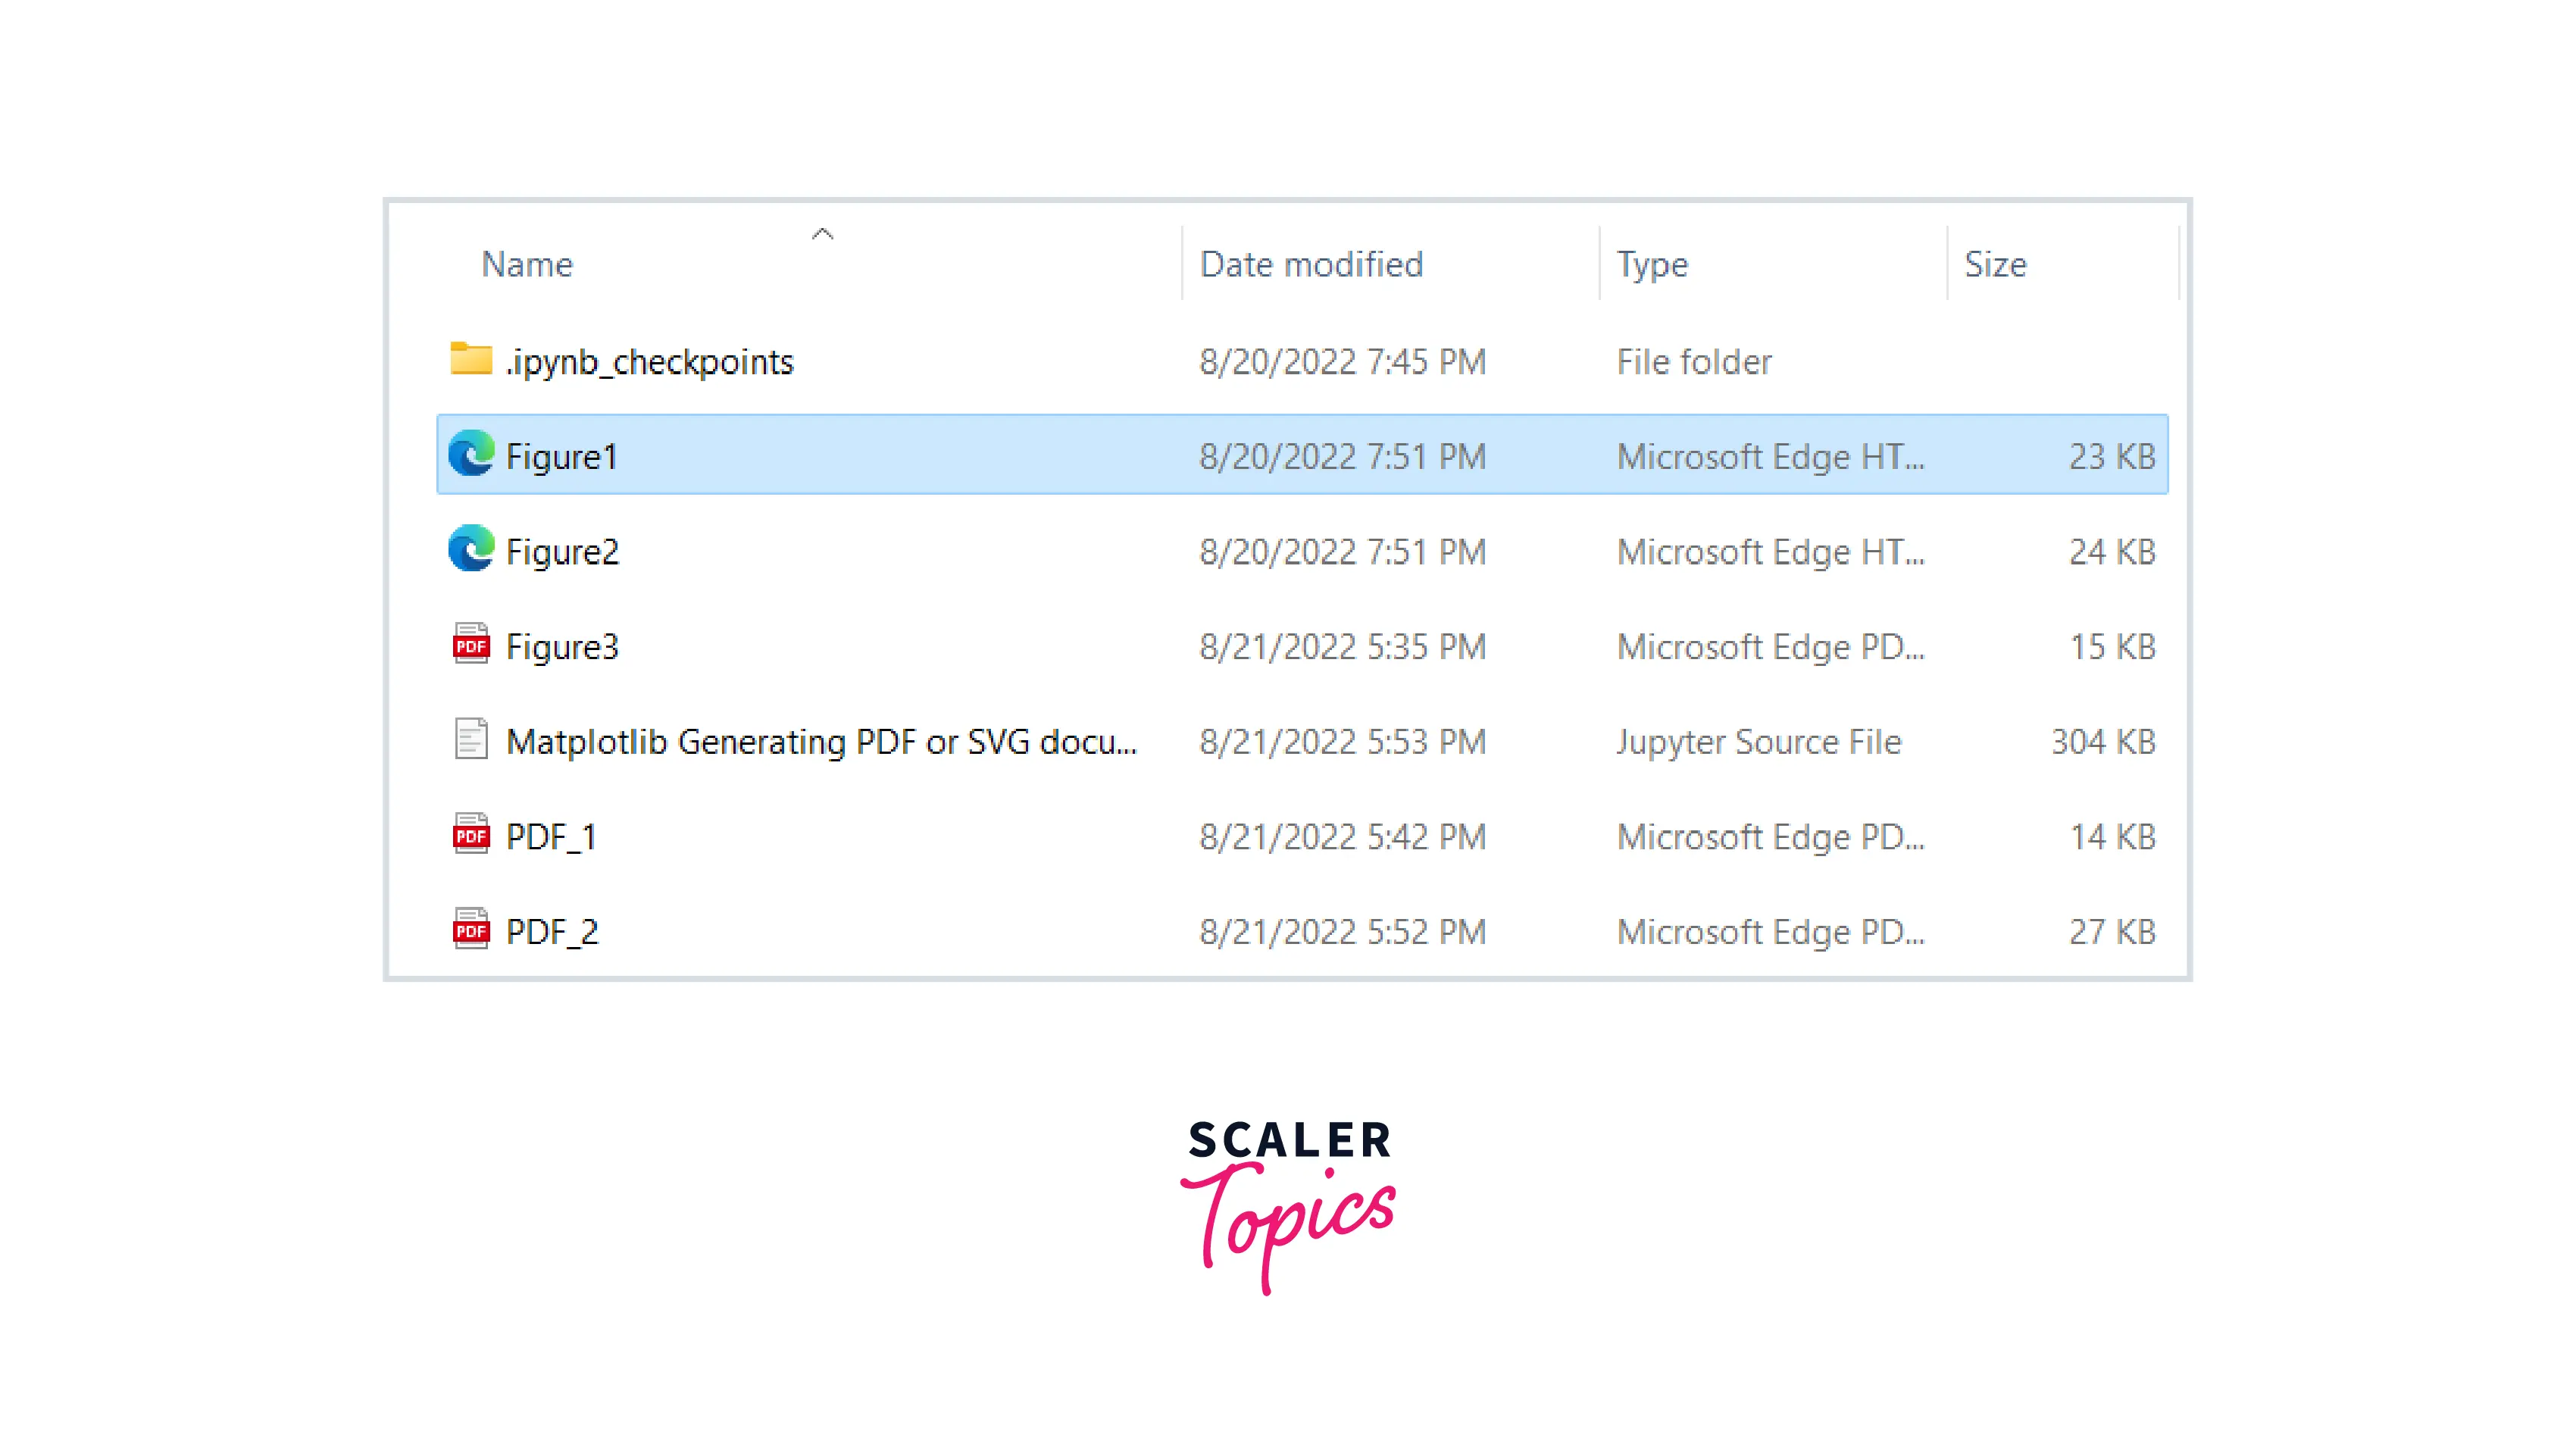
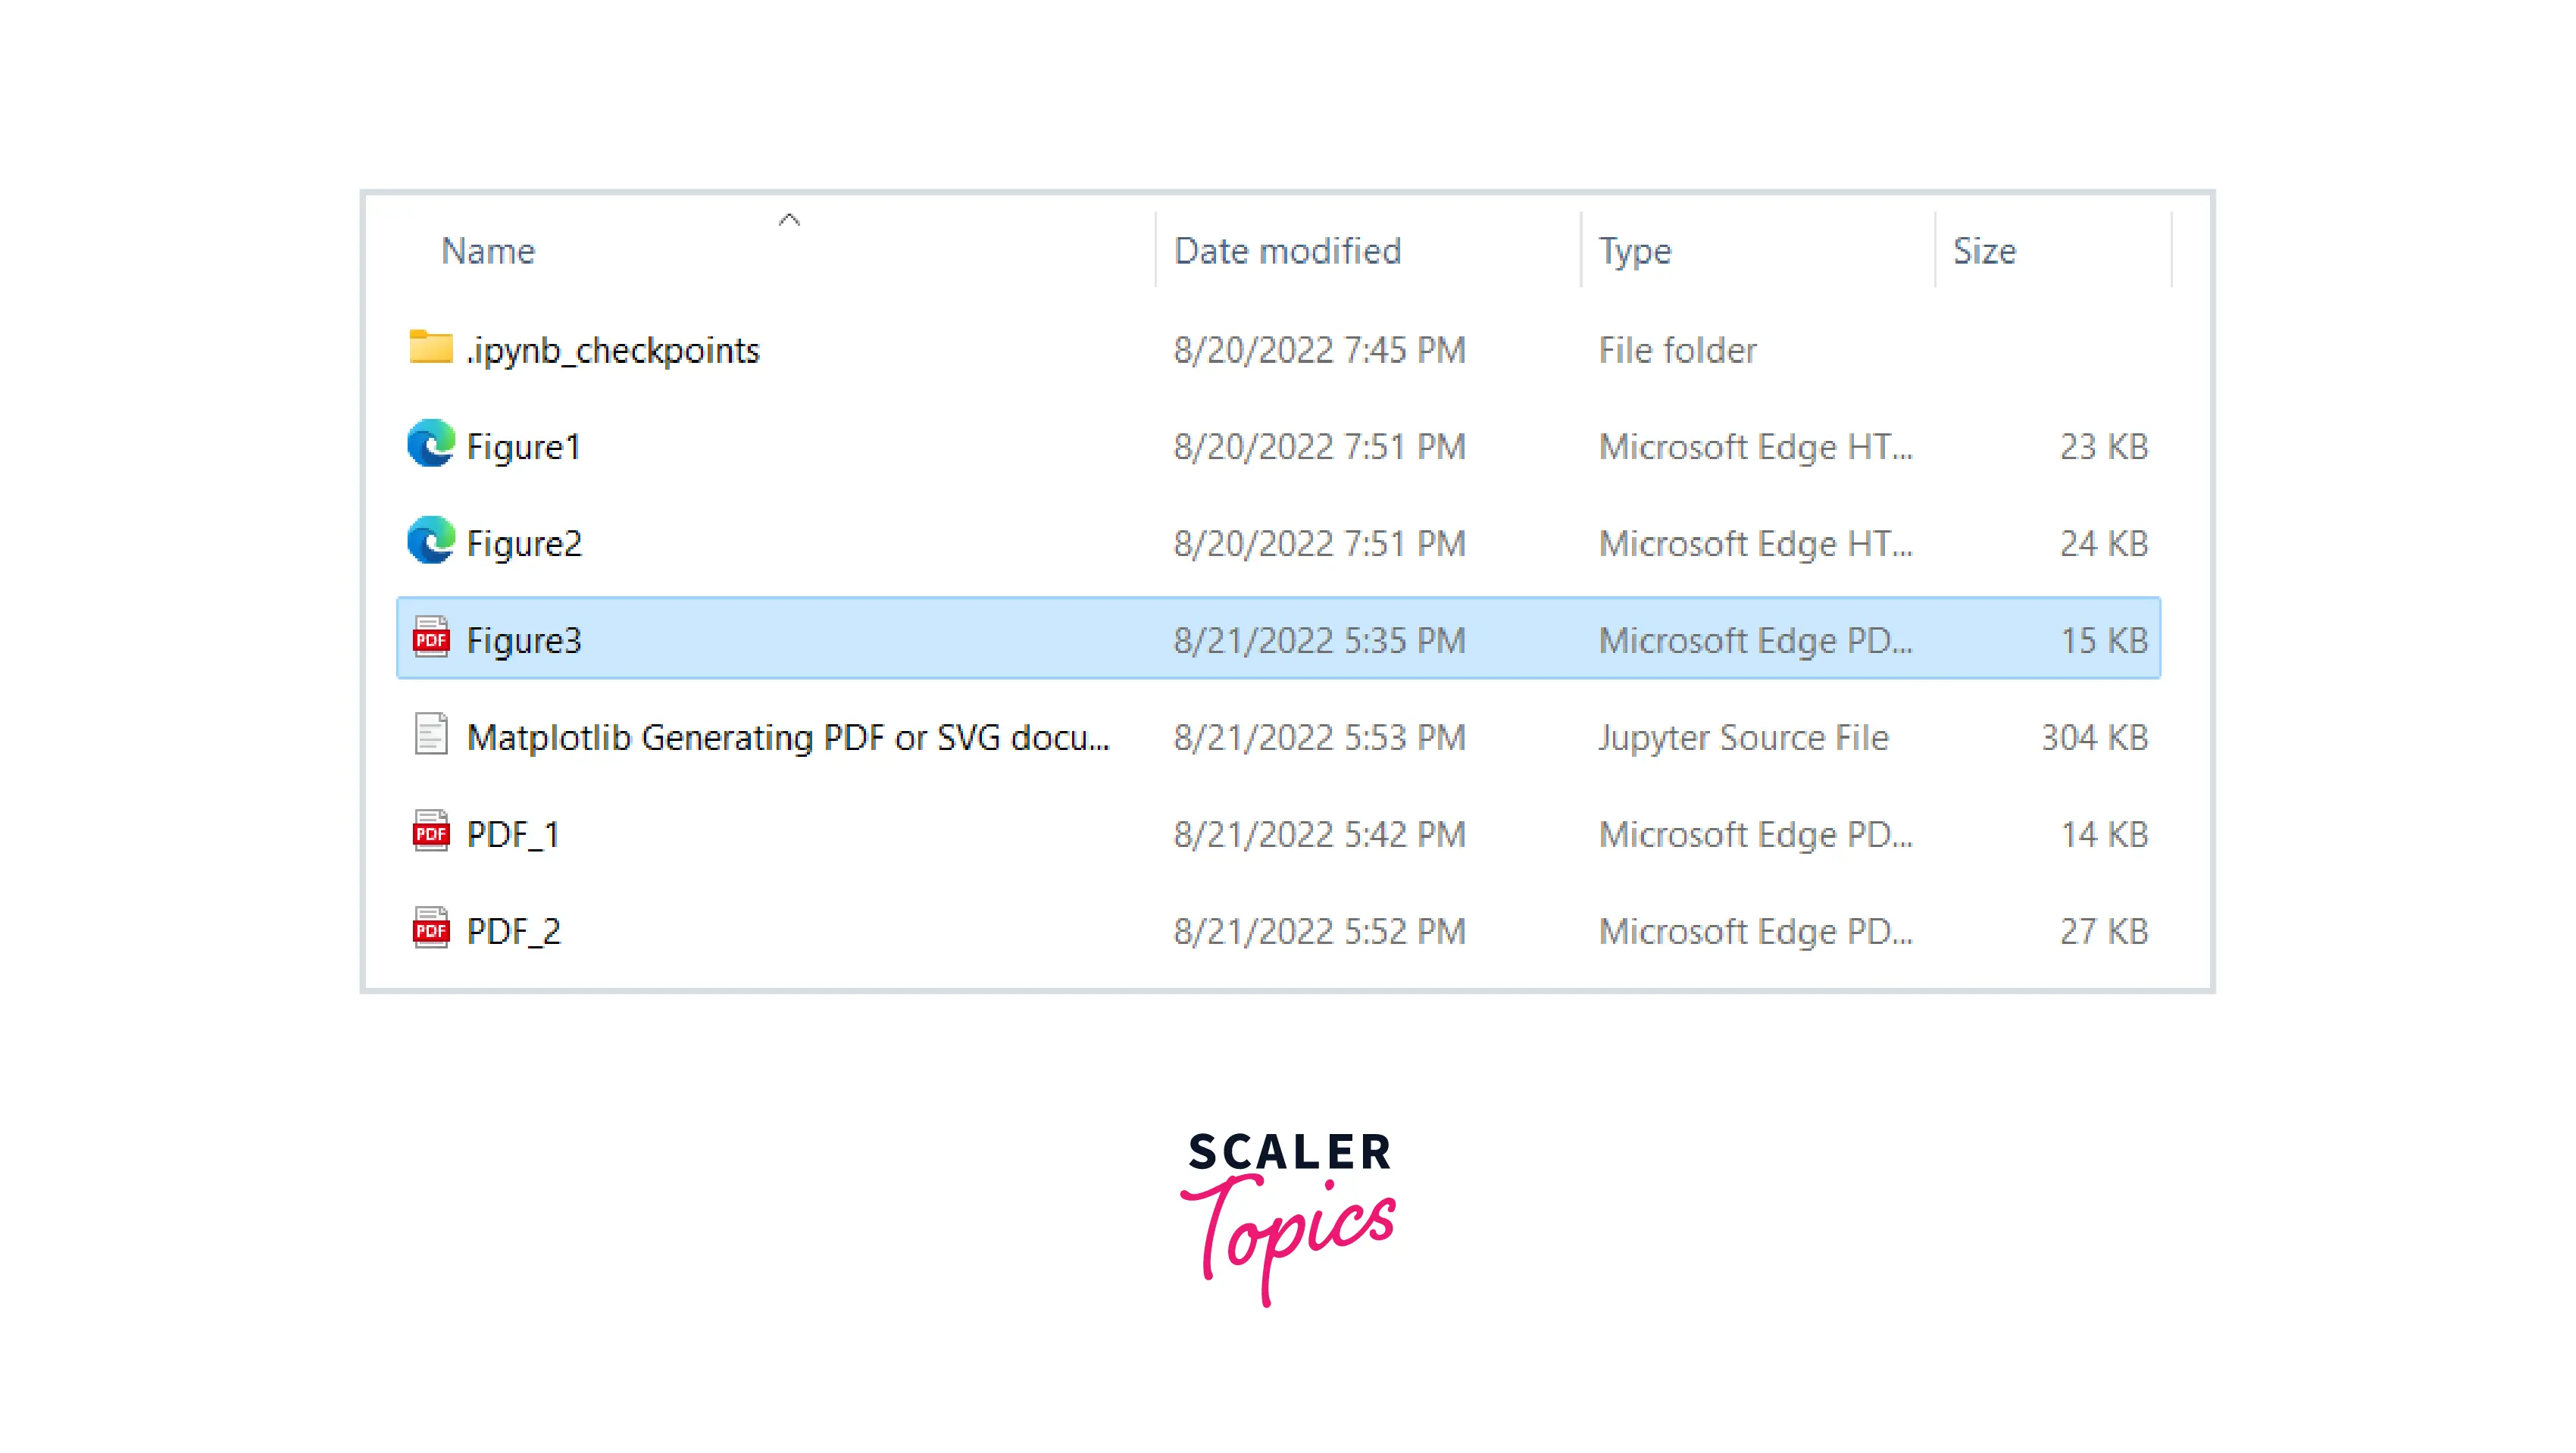
Example2: Saving plot to a specific location
Output:
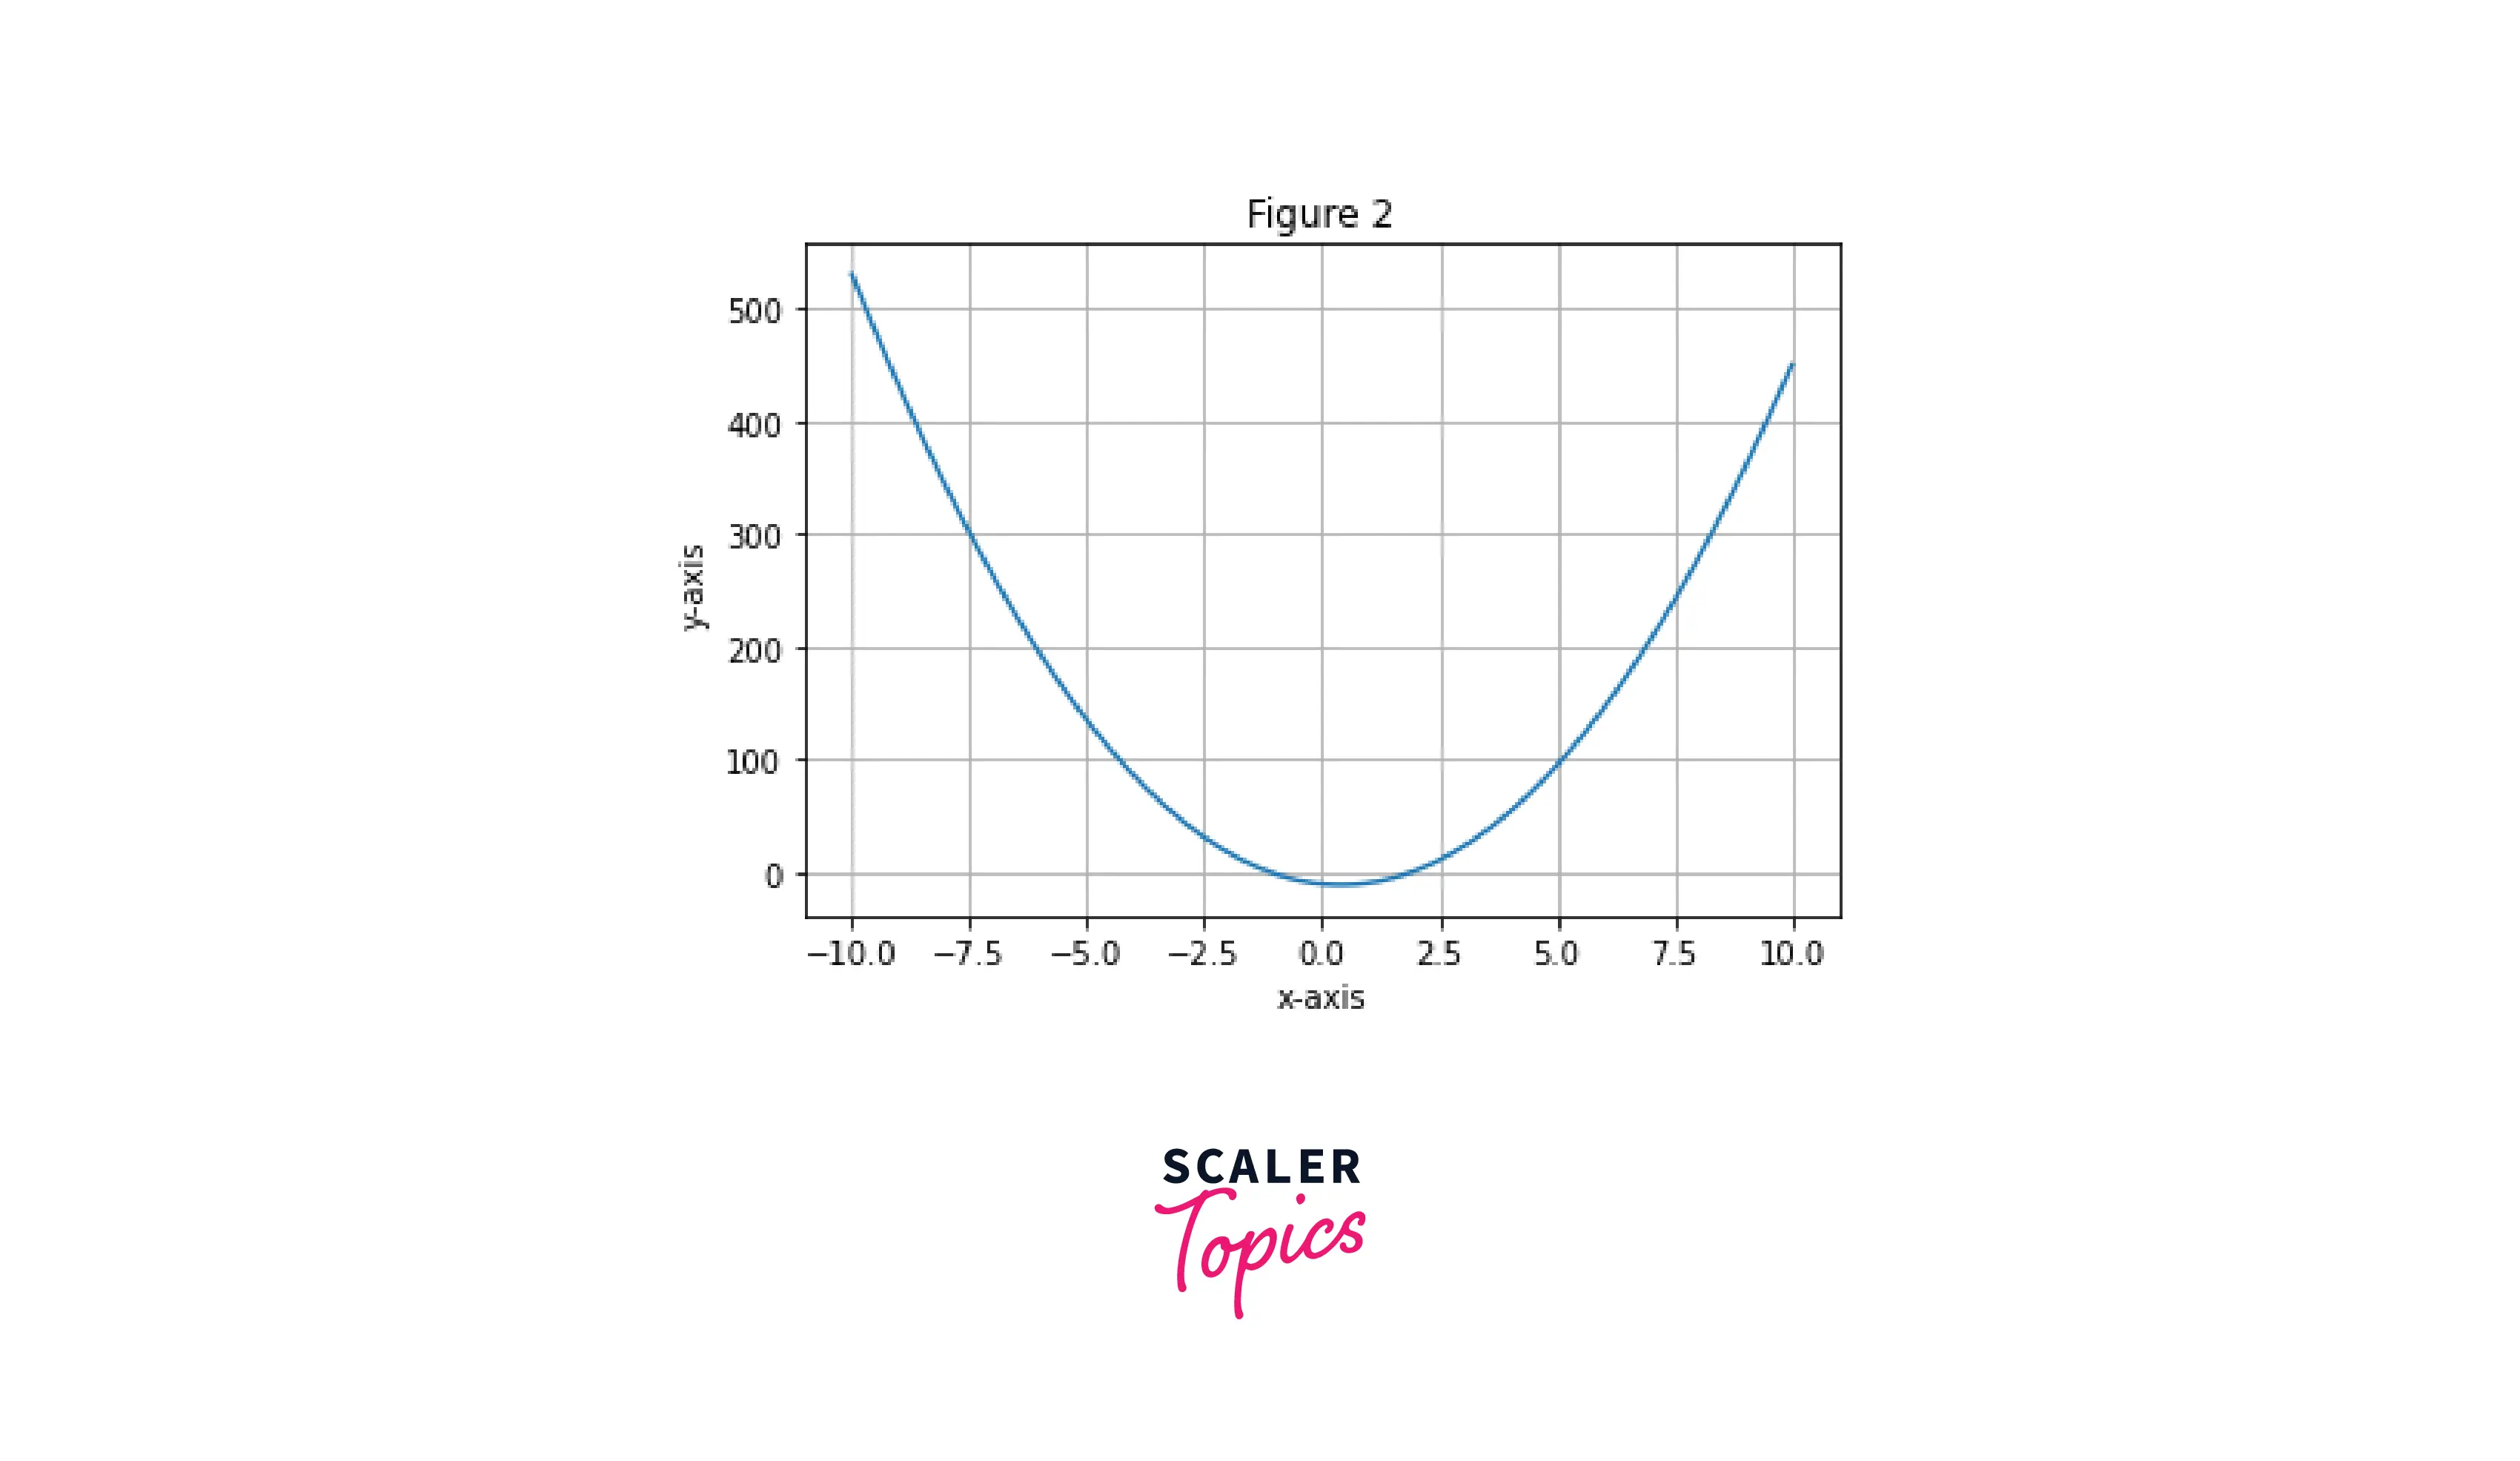
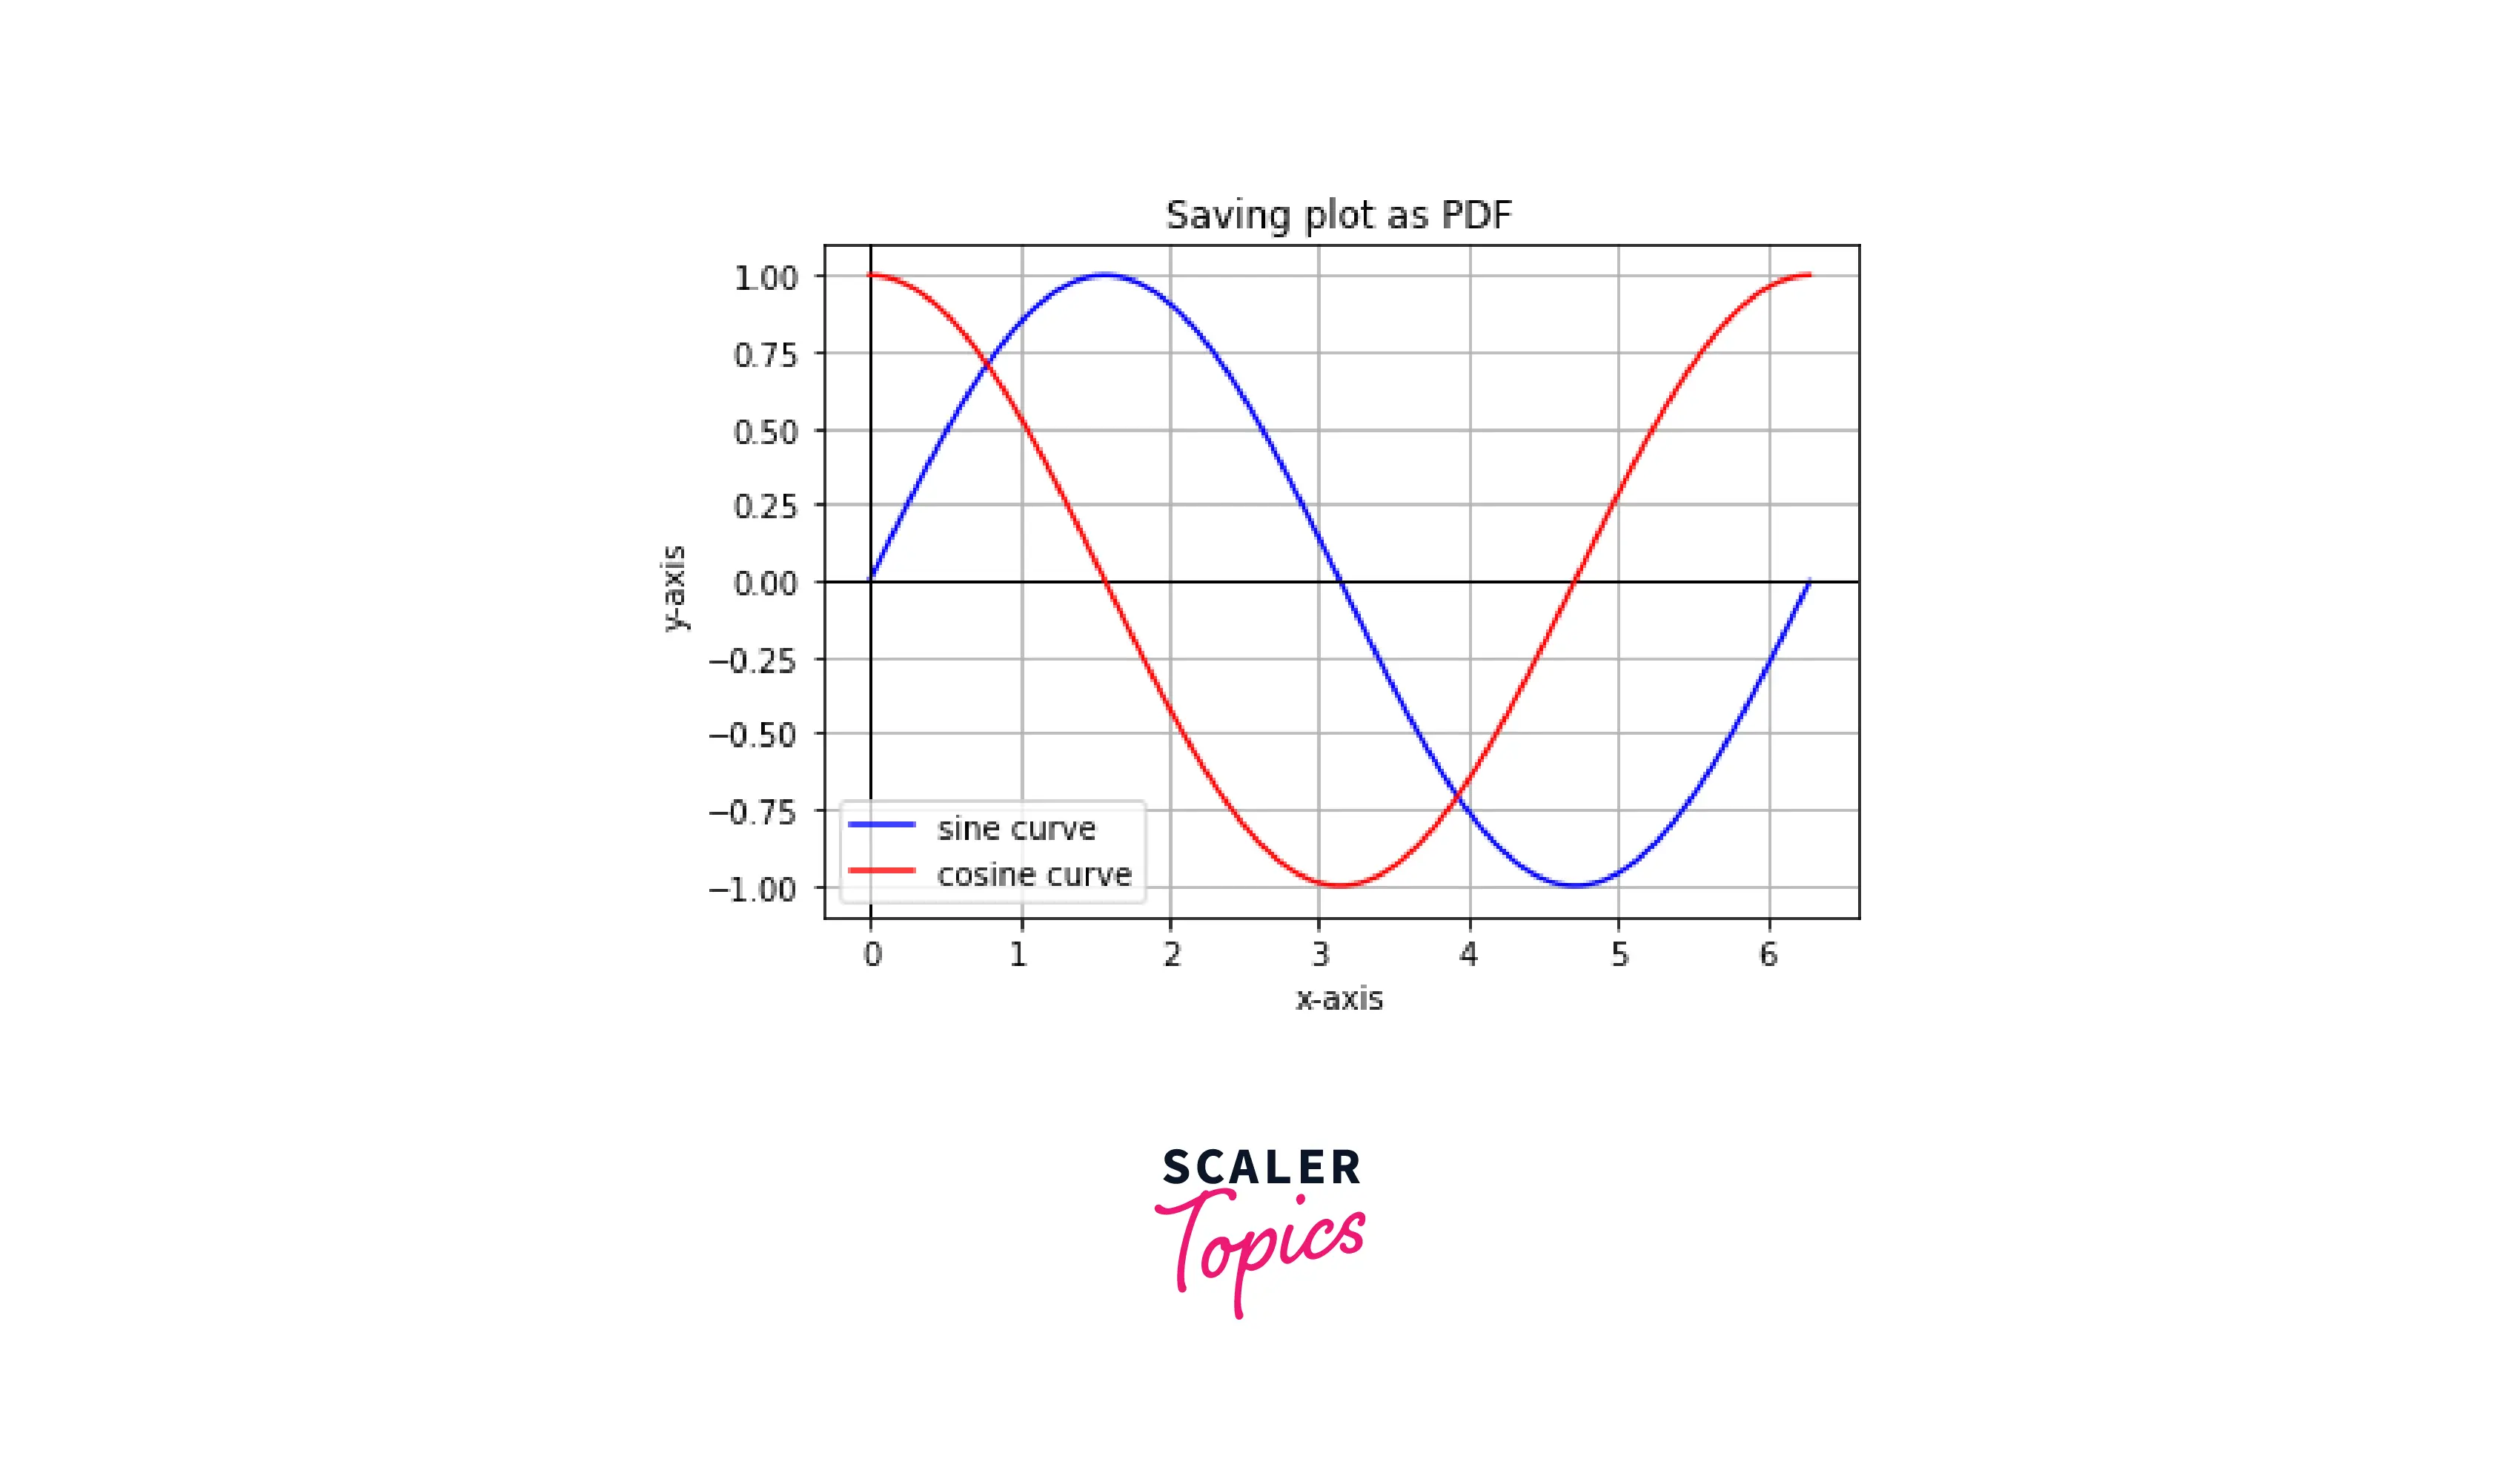
Example3: Saving plot in PDF format
Output:
savefig() Method of the PdfPages Class
Syntax
Parameters
figure: Figure or int, default: the active figure
The figure, or index of the figure, is saved to the file.
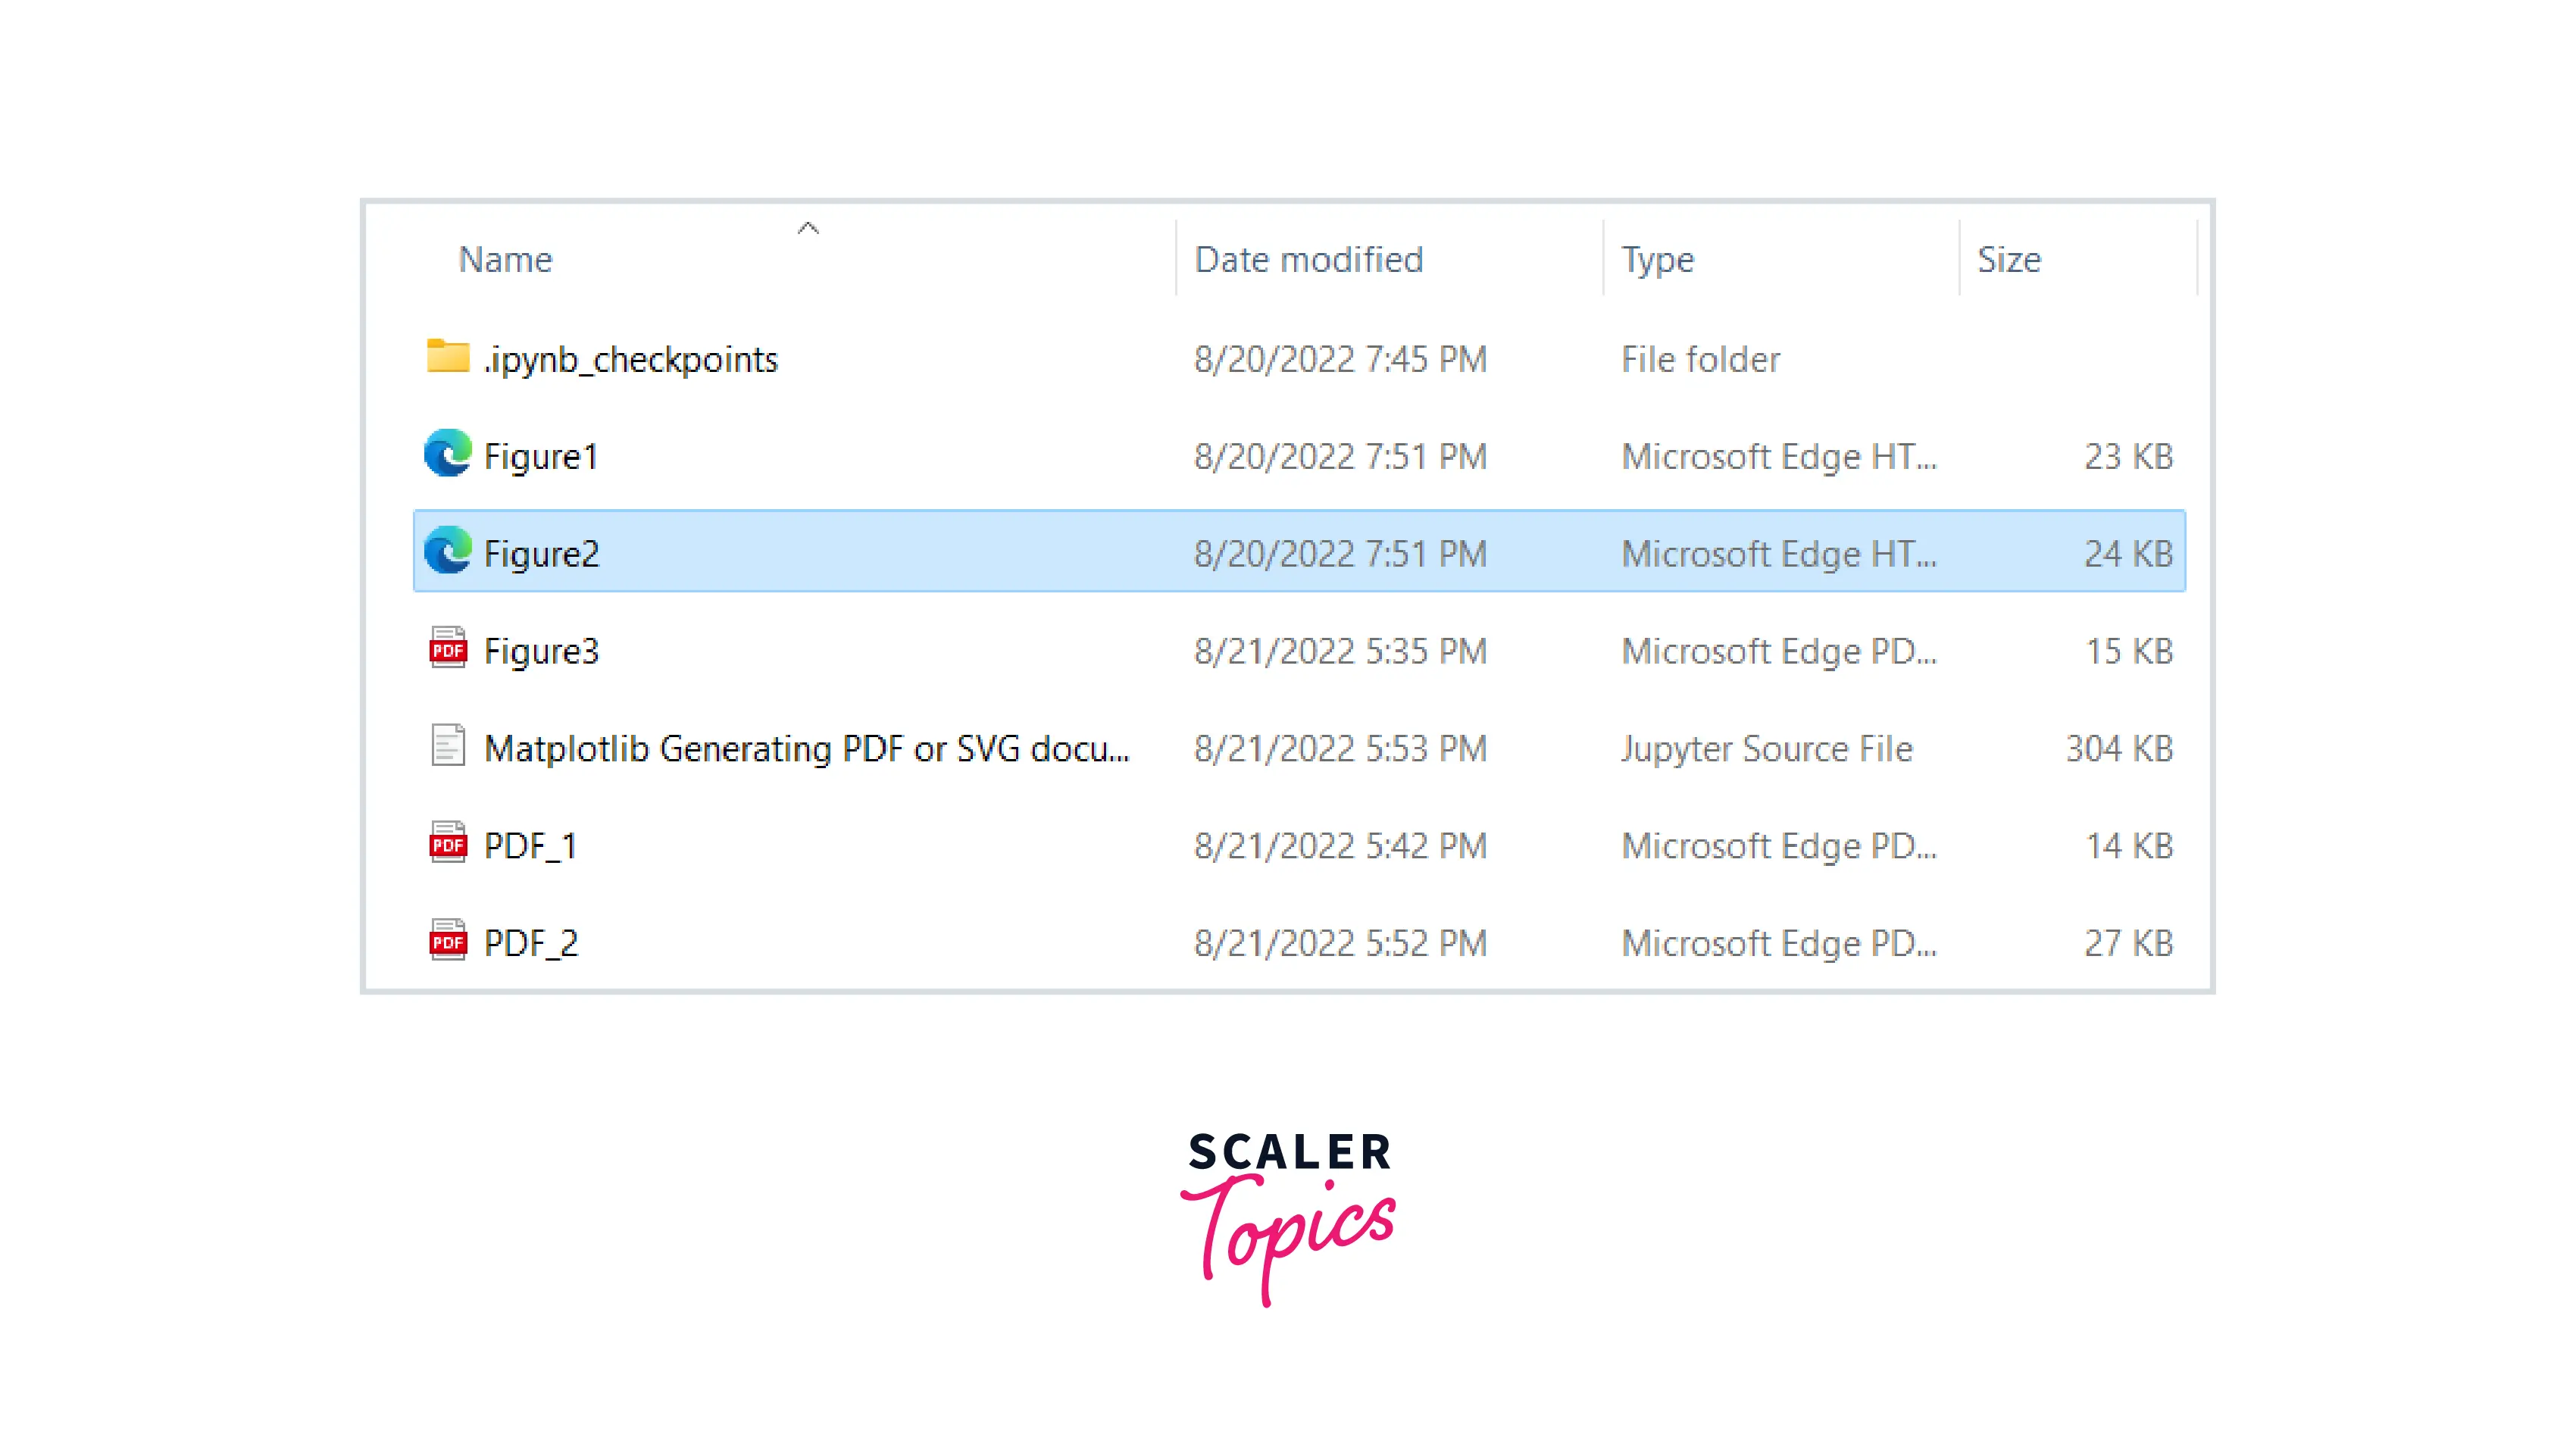
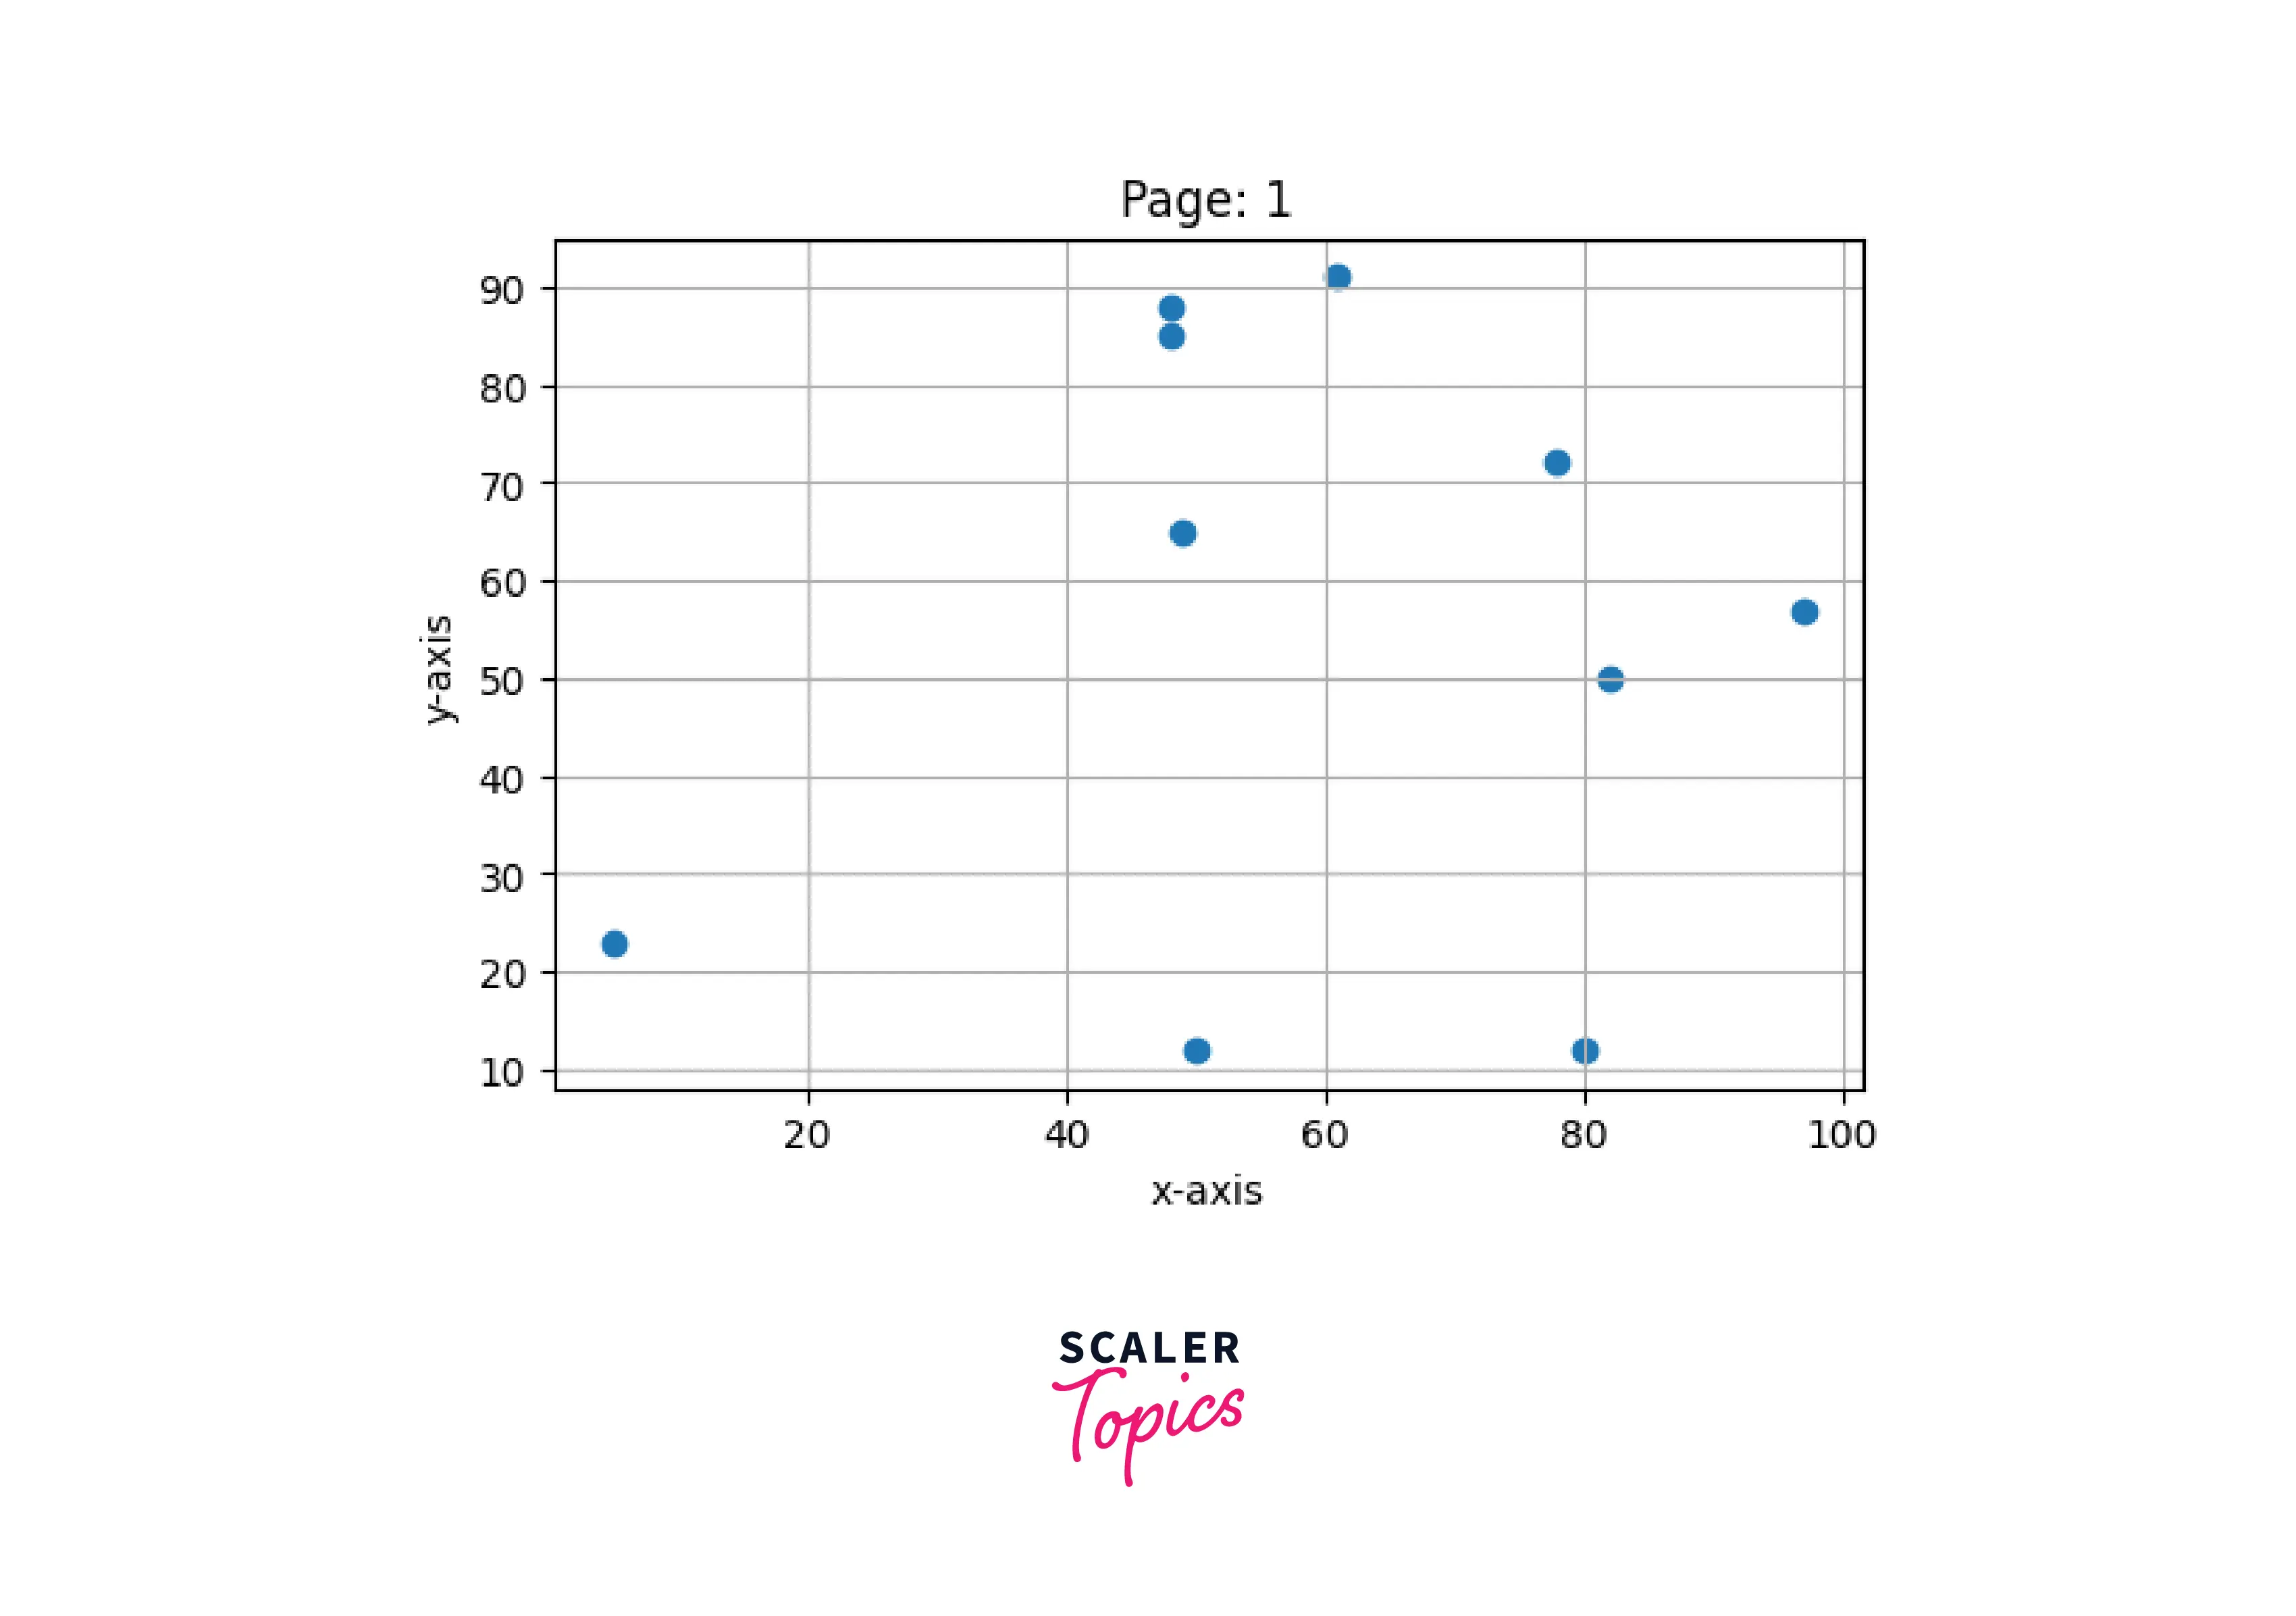
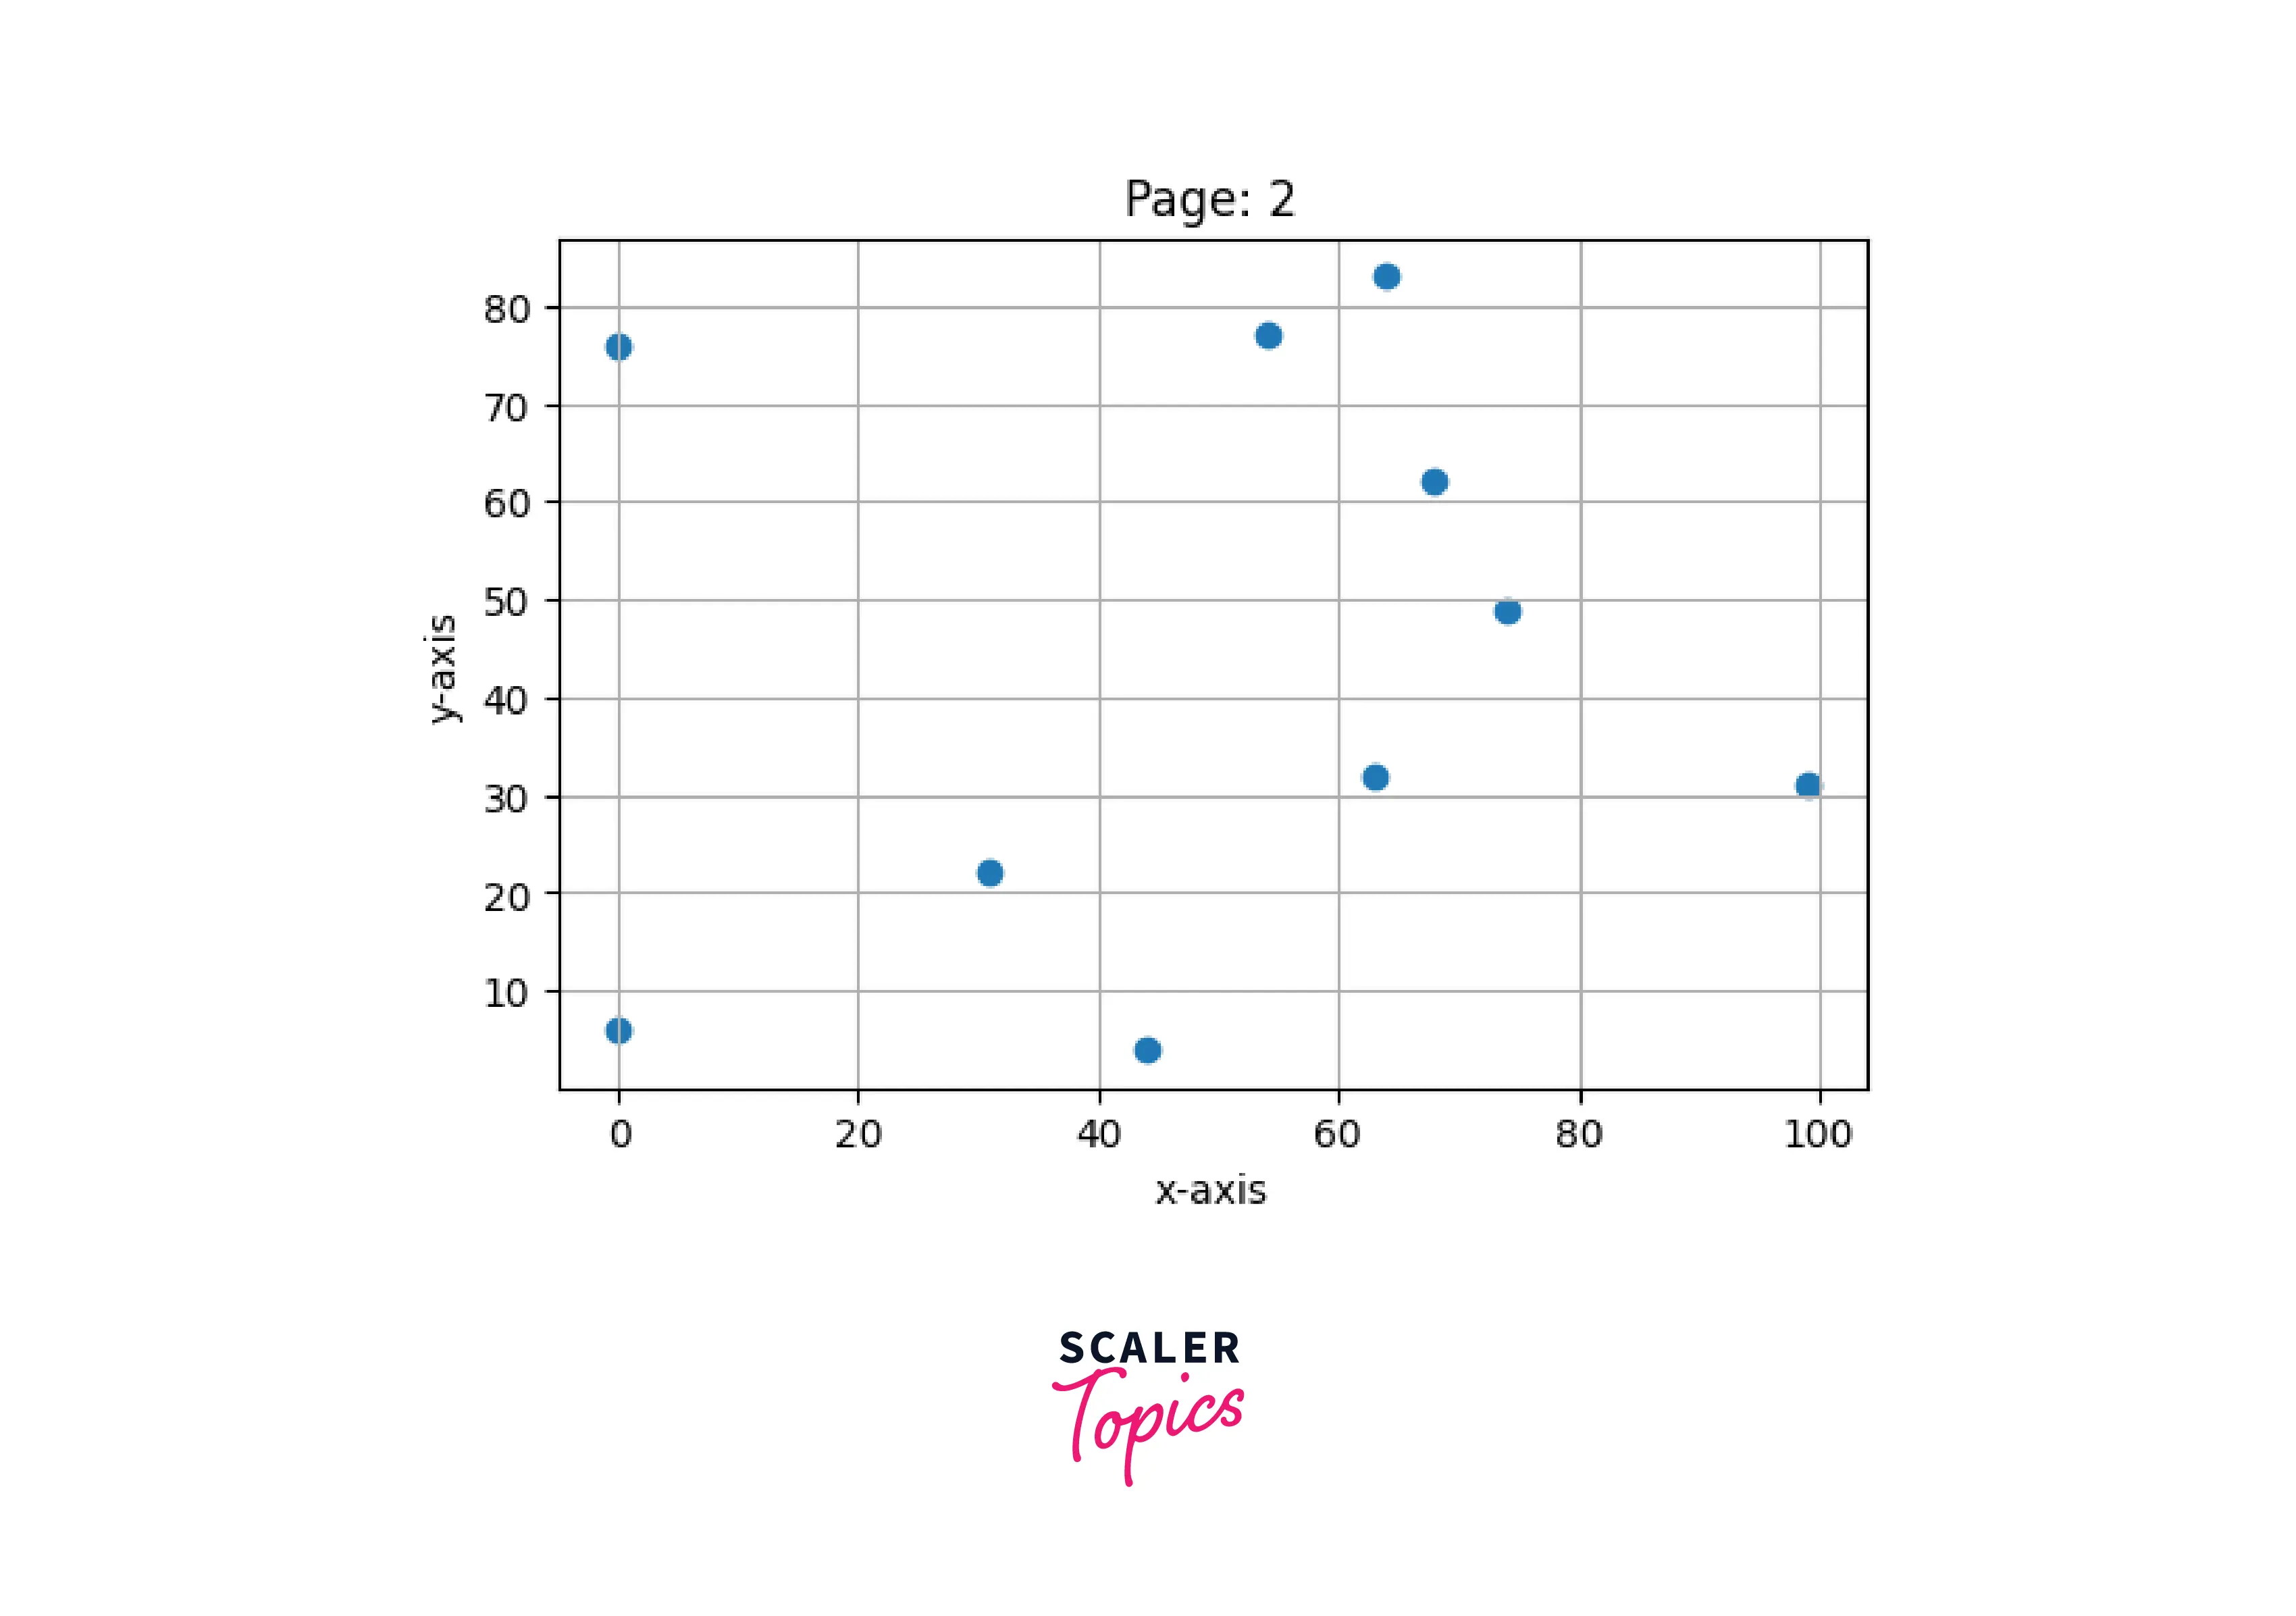
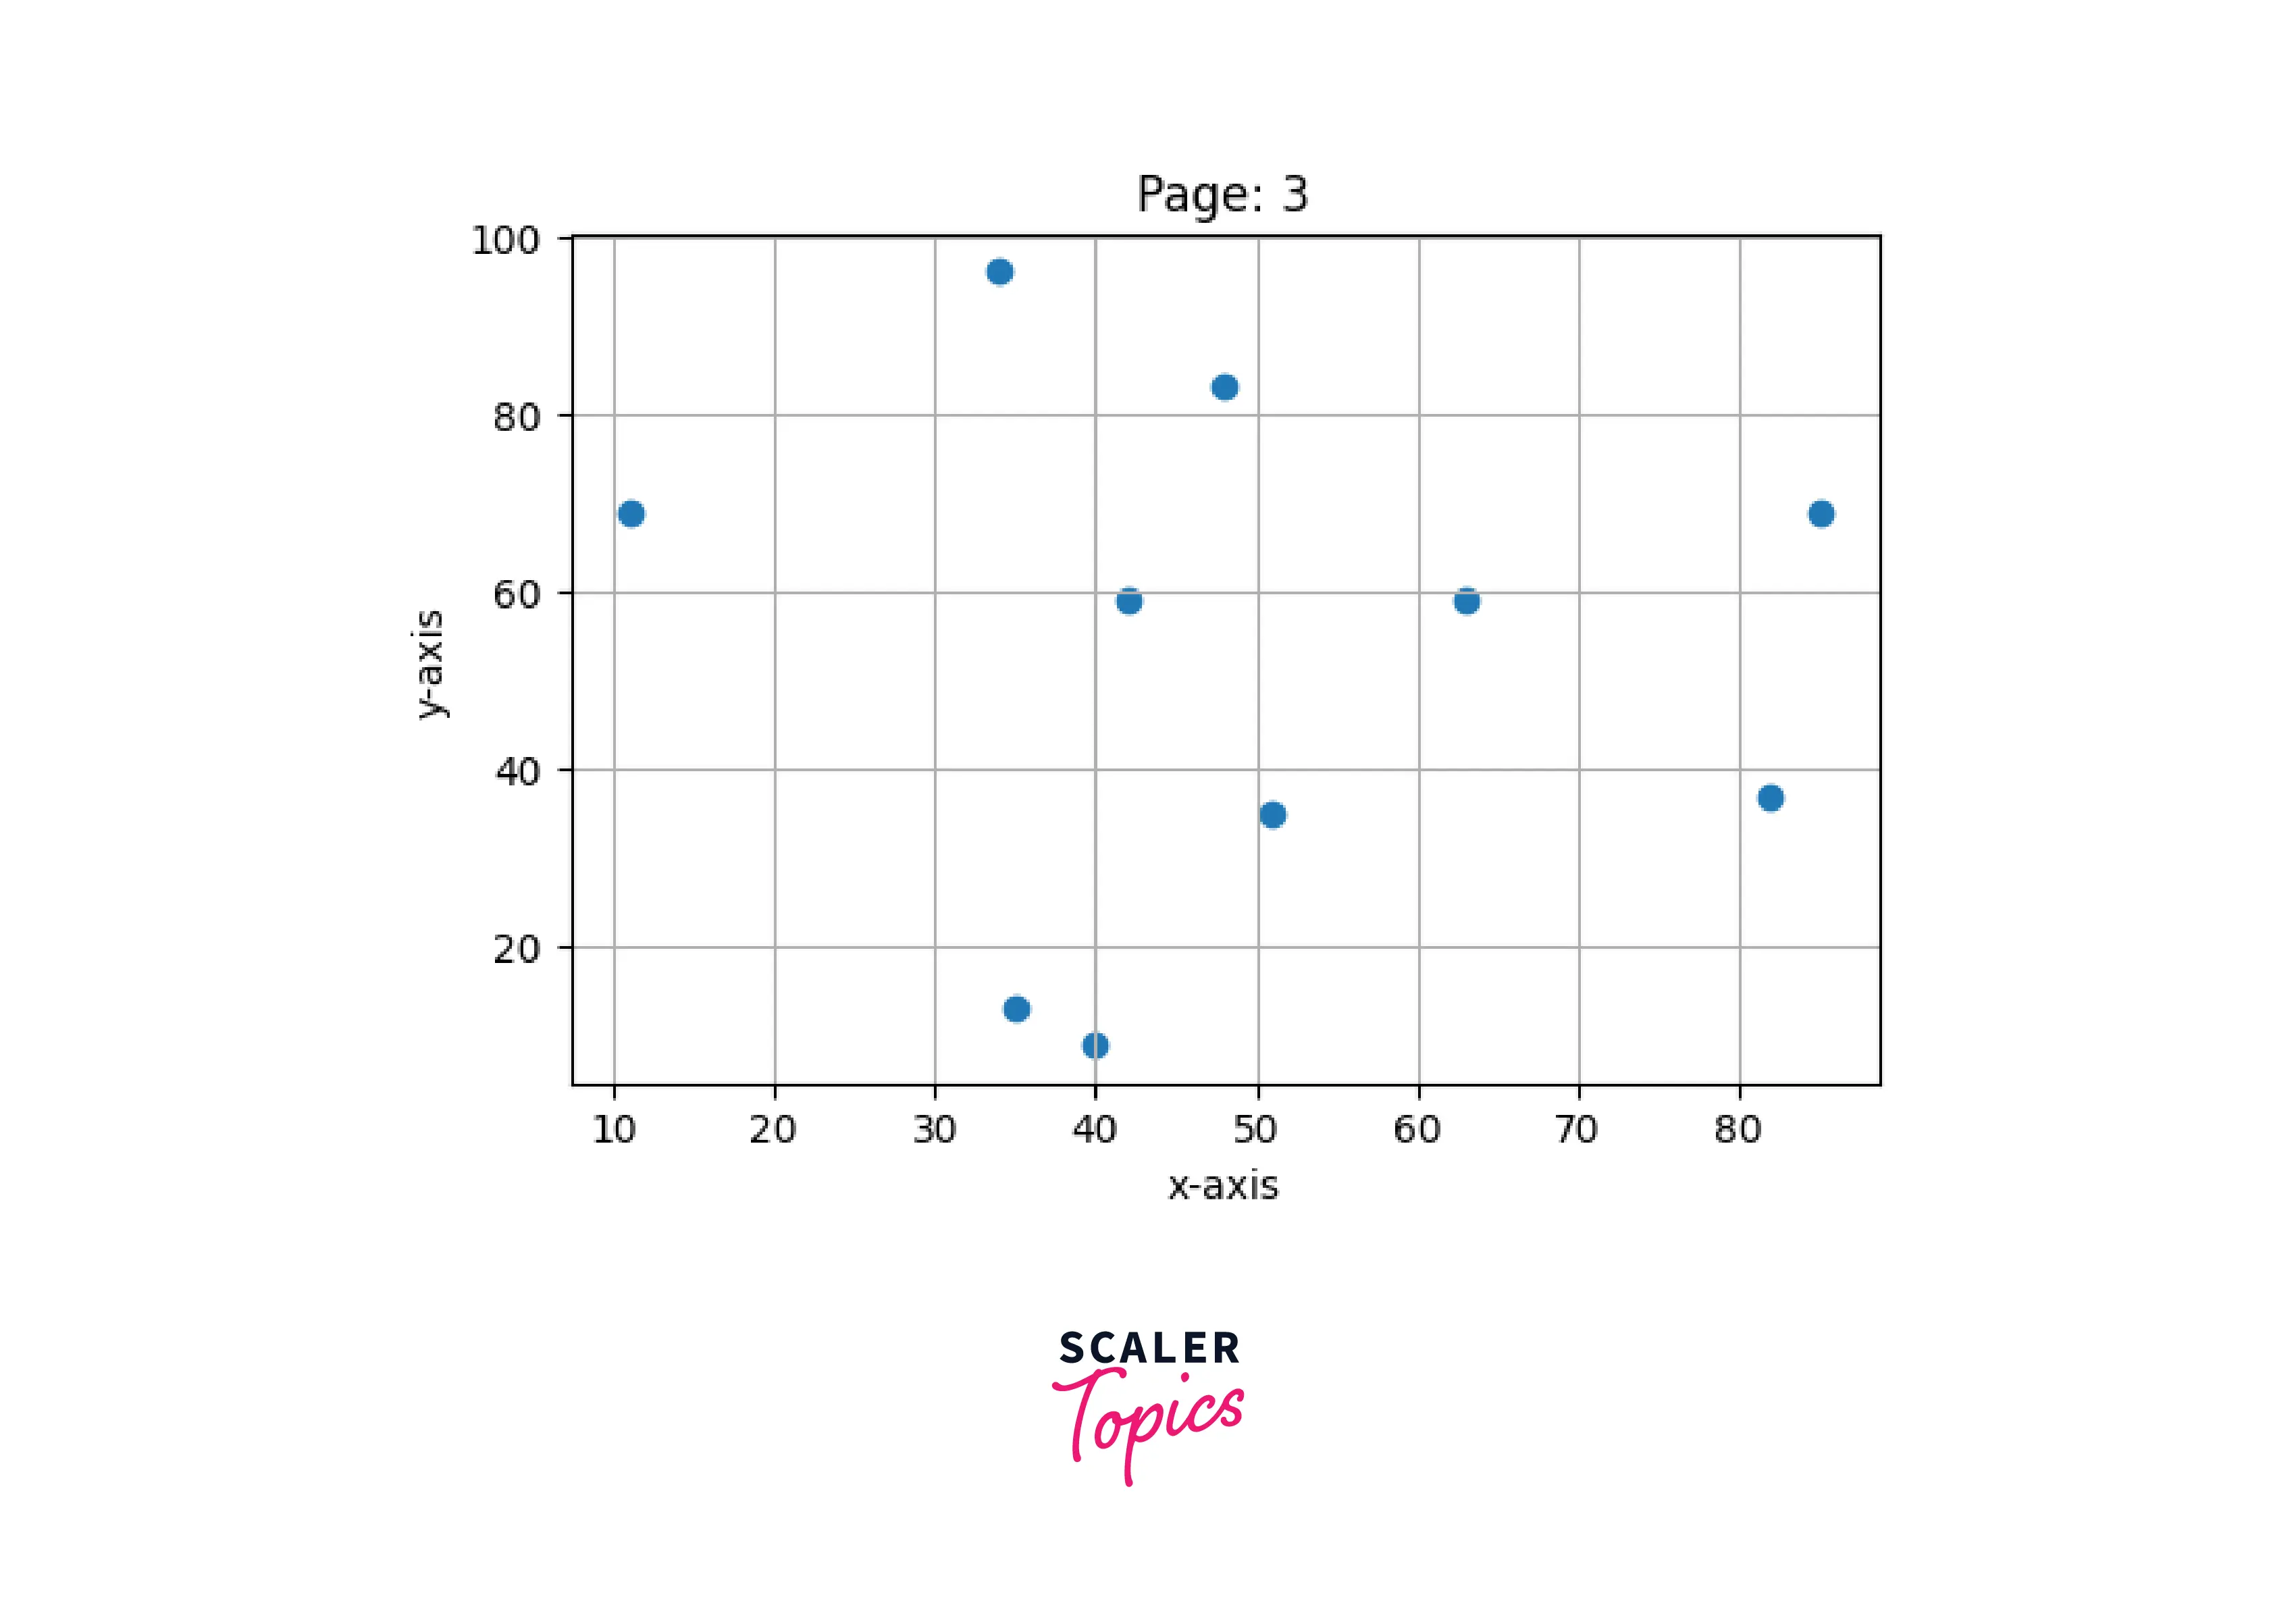
Example1: Saving multiple figures in PDF format
Output:
Conclusion
- There are two ways to generate PDF and SVG documents in matplotlib.
- We can use the savefig() method from the pyplot module to save a figure in PDF and SVG format.
- We can also use the savefig() method from PdfPages class to save a figure in SVG format and multiple figures in PDF format.
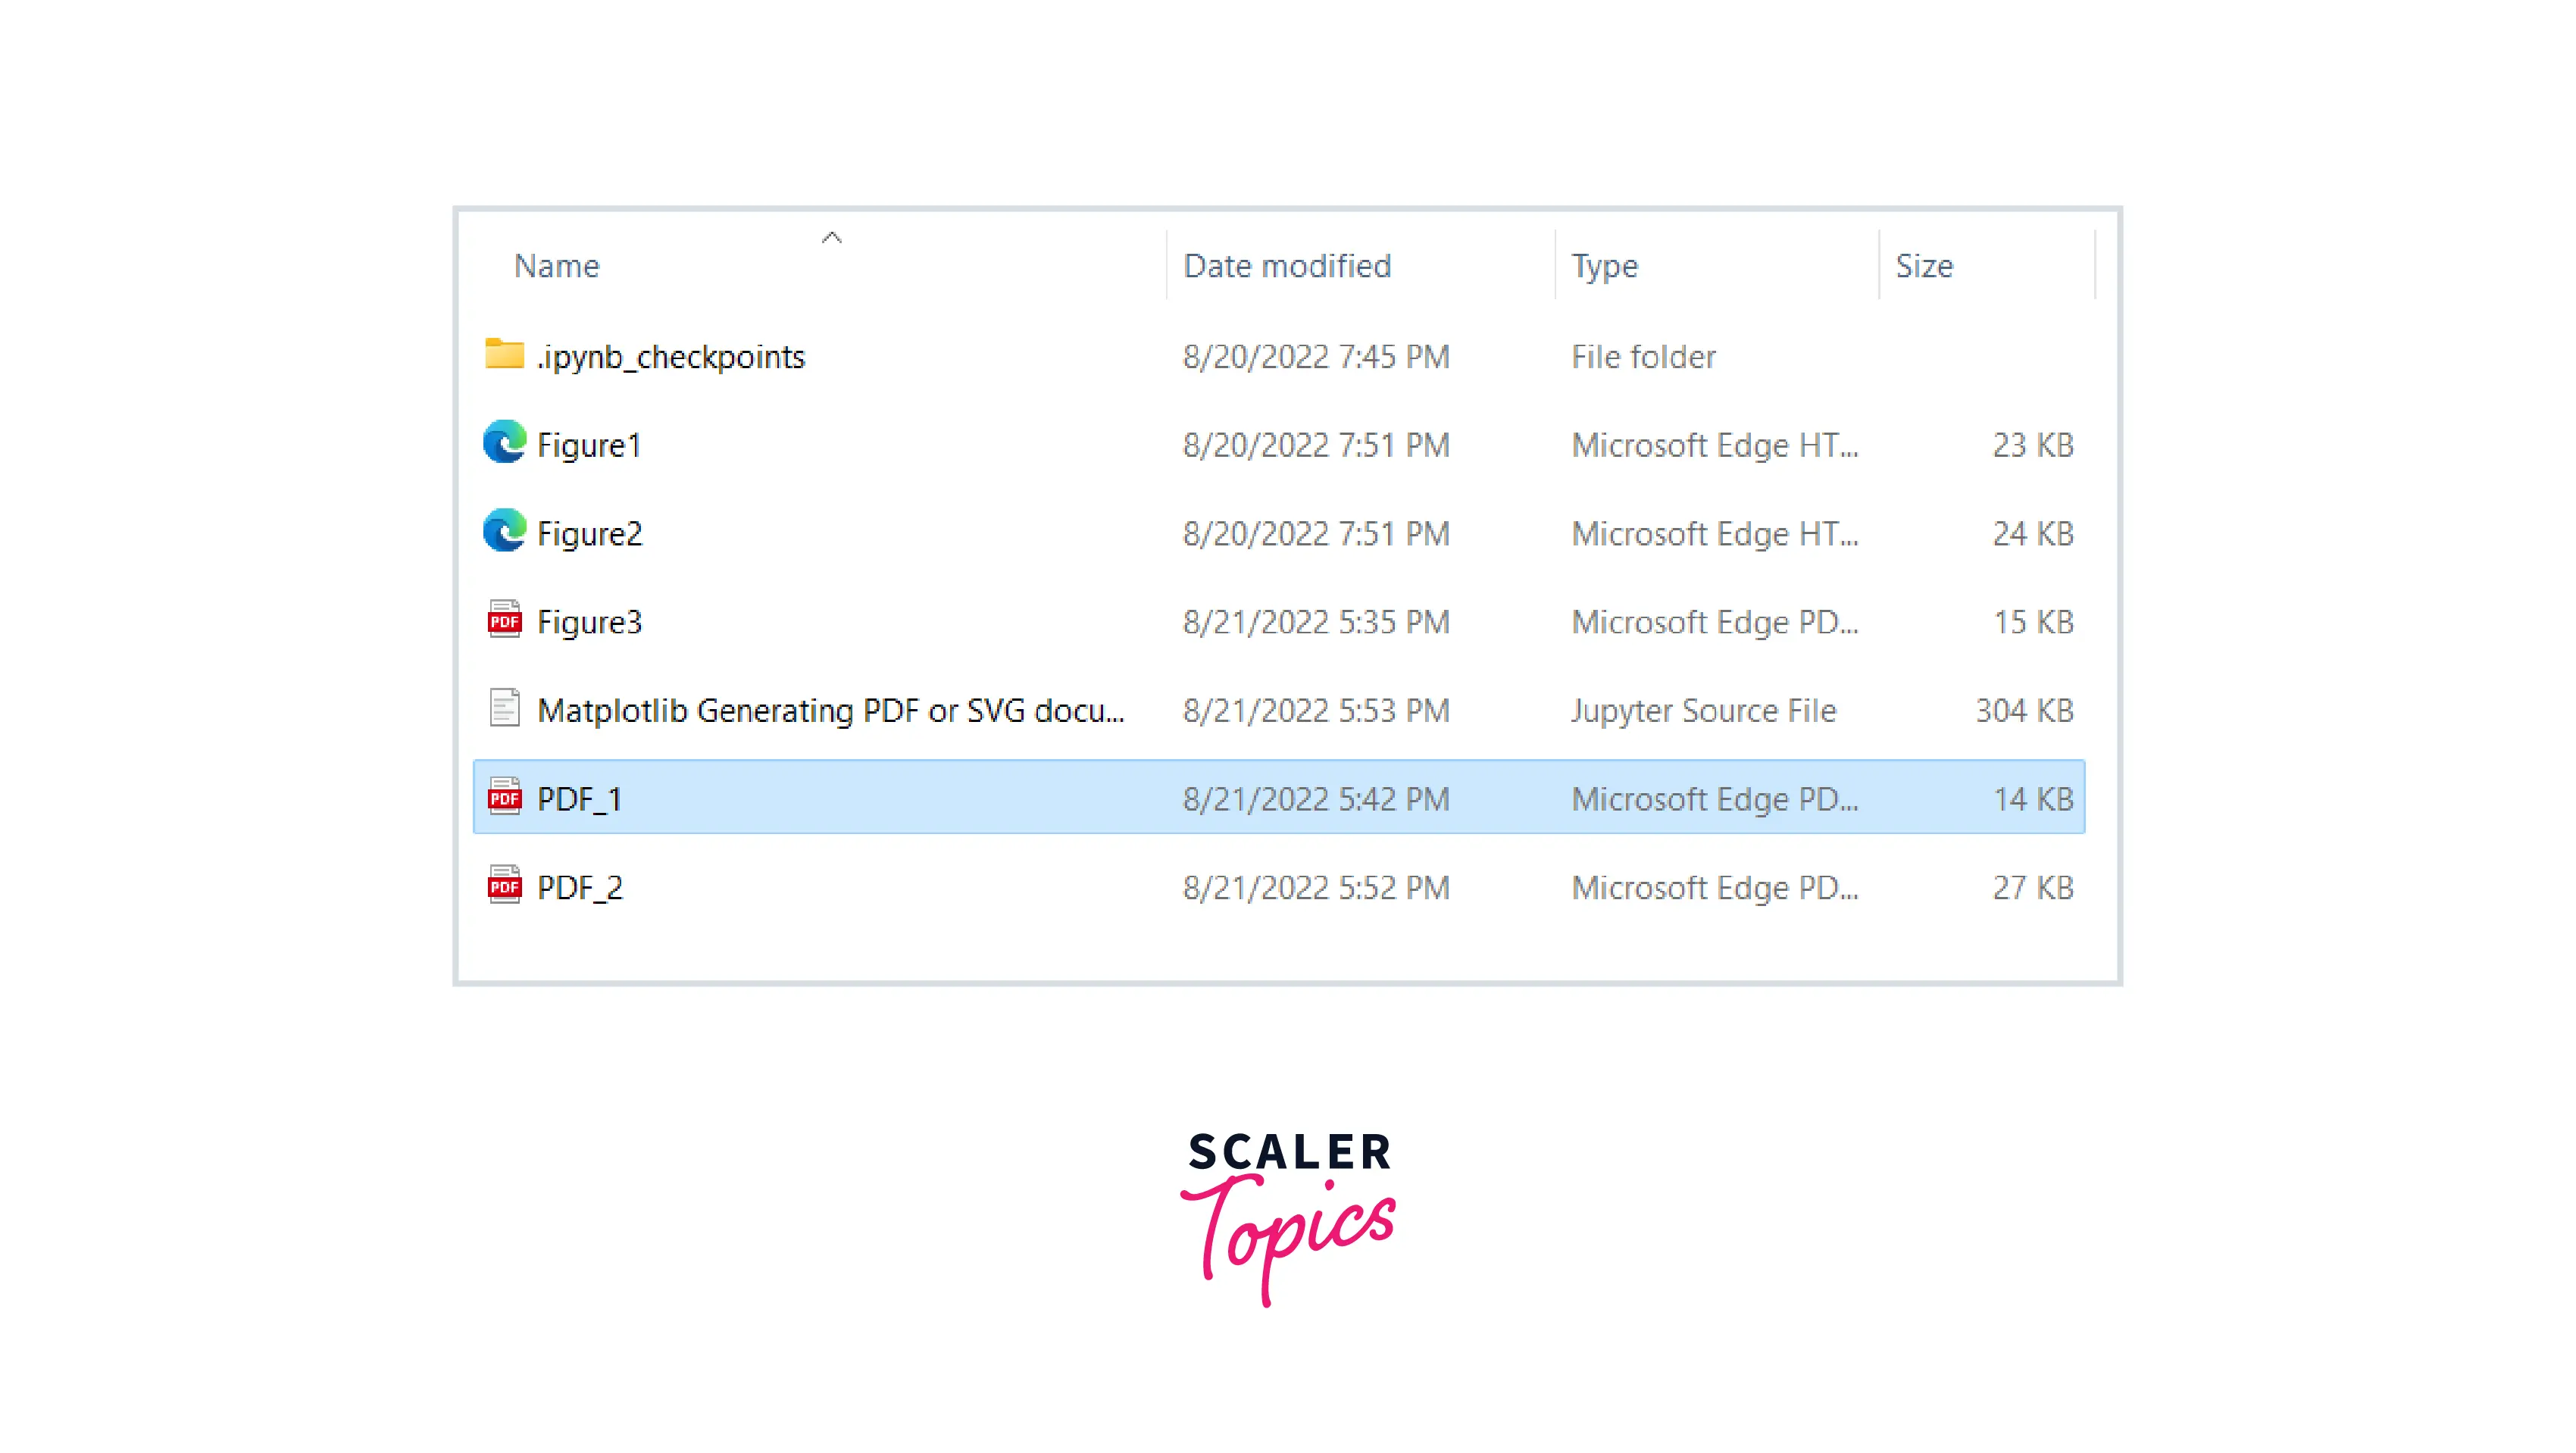
- We can save plots on the local disk at any location by specifying the location ending with the file name. For example, if we only give the file name in the parameter file will be saved on the local disk.