How to Add a Matplotlib Grid on a Figure
Overview
- Matplotlib is a robust and dynamic Python library that helps users create meaningful and interactive plots.
- Plots and other visualizations in Python increase the chances of understanding complex datasets. Hence we can derive meaningful inferences from them.
- A grid is a collection of straight lines that help us show our plots' divisions. It makes something like finding the slope of a graph easy.
Transform Your Career
Choose from our industry-leading programs designed for career success
Modern Software and AI Engineering Program
Master full-stack development with AI integration

Modern Data Science and ML with specialisation in AI
Advanced data science techniques with AI specialization
Advanced AIML with Specialisation in Agentic AI
Deep dive into AIML with focus on Agentic systems
DevOps, Cloud & AI Platform Engineering
Build and manage AI-powered cloud infrastructure
AI Engineering Advanced Certification by IIT-Roorkee
Premier AI engineering certification from IIT-Roorkee
Grid in Matplotlib
- A grid is a collection of straight lines that help us show our plots' divisions.
- Grids help us visualize our plots a lot better, and it also helps us calculate plots' slopes and gradients.
- The syntax of grid is:
x: horizontal grids y: vertical grids color: color of the grid
How to Add a Grid to a Plot?
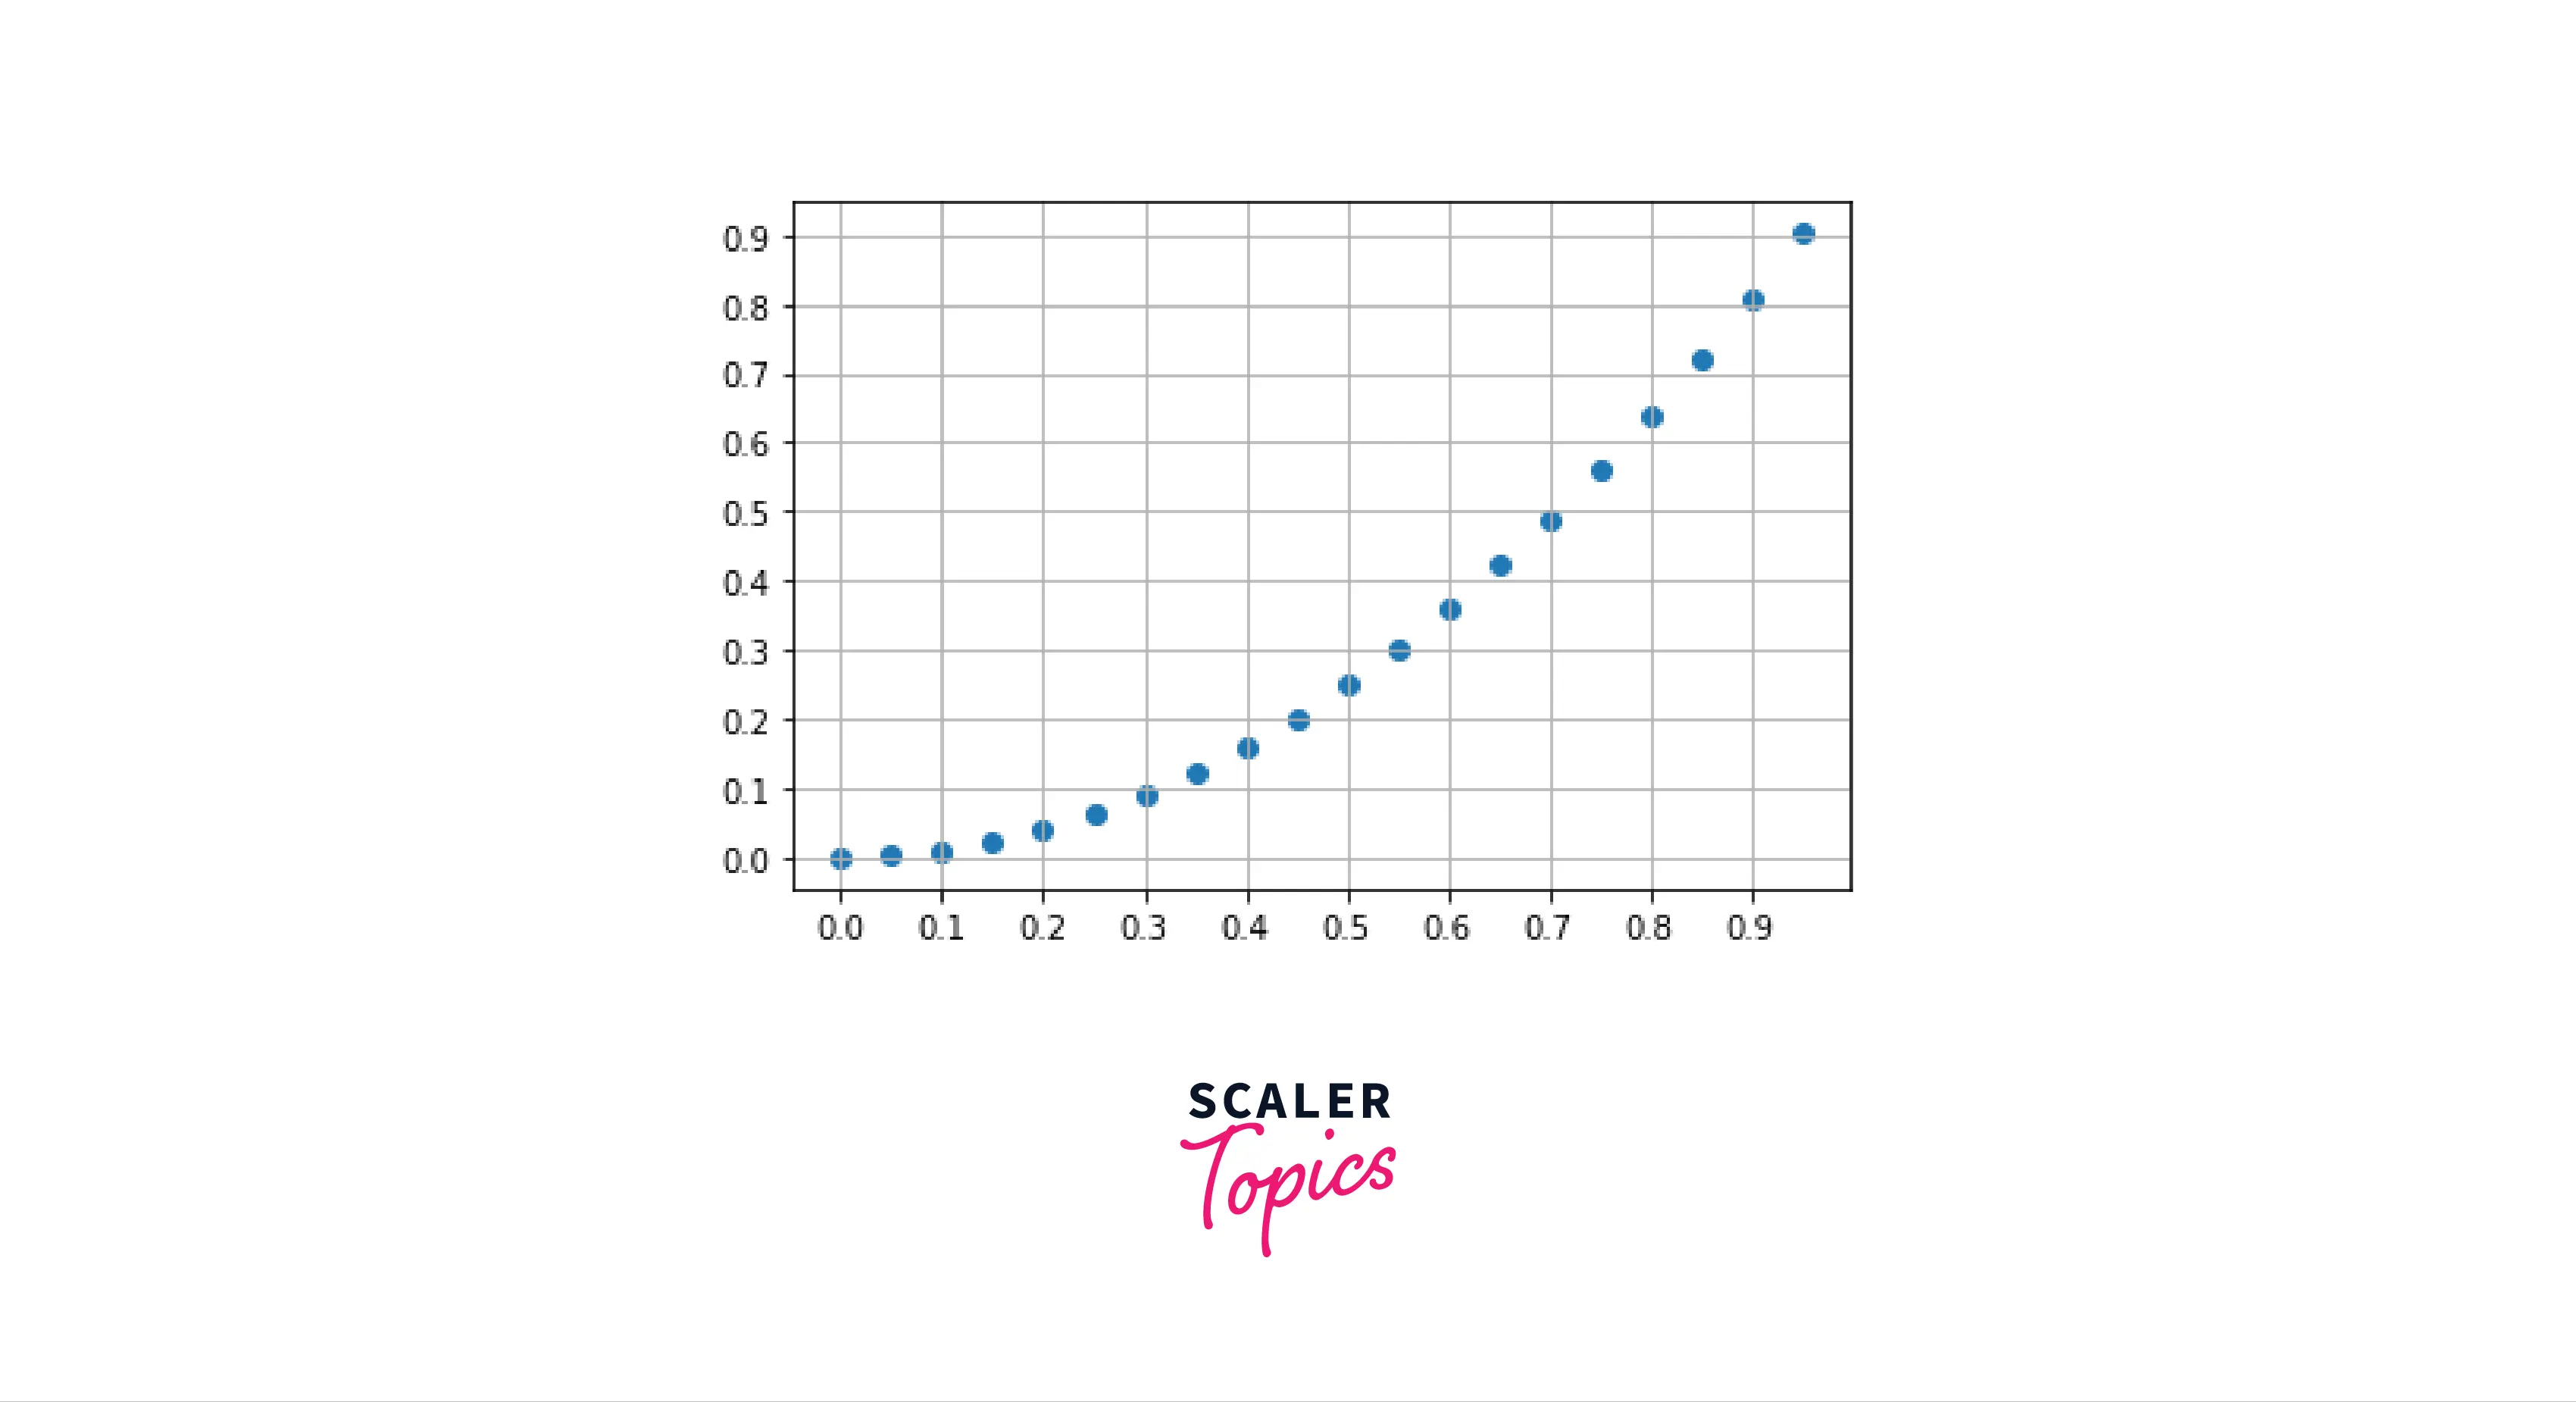
a) In this example, we will try to make grids on our strictly increasing plot:
b) Here, we create a strictly increasing graph (the slope will constantly increase).
- We use a scatter plot to display our data points.
- The .gca() function is used to get the current polar axes of our plot.
- We use the .grid() function to represent grids in our plots.
- Here's the output of the above code:


Note: There are many other ways to add grids to your plots, but this will ensure your code's scalability and readability.
c) Let's talk about a very efficient type of grid, the logarithmic grid
-
Logarithmic grids help us to analyse data more efficiently, as the spaces in the grid are logarithmic-spaced.
-
For a logarithmic grid, we must add the which and axis parameters to our grid function.
-
Syntax:
- Logarithmic grids will look something like this:

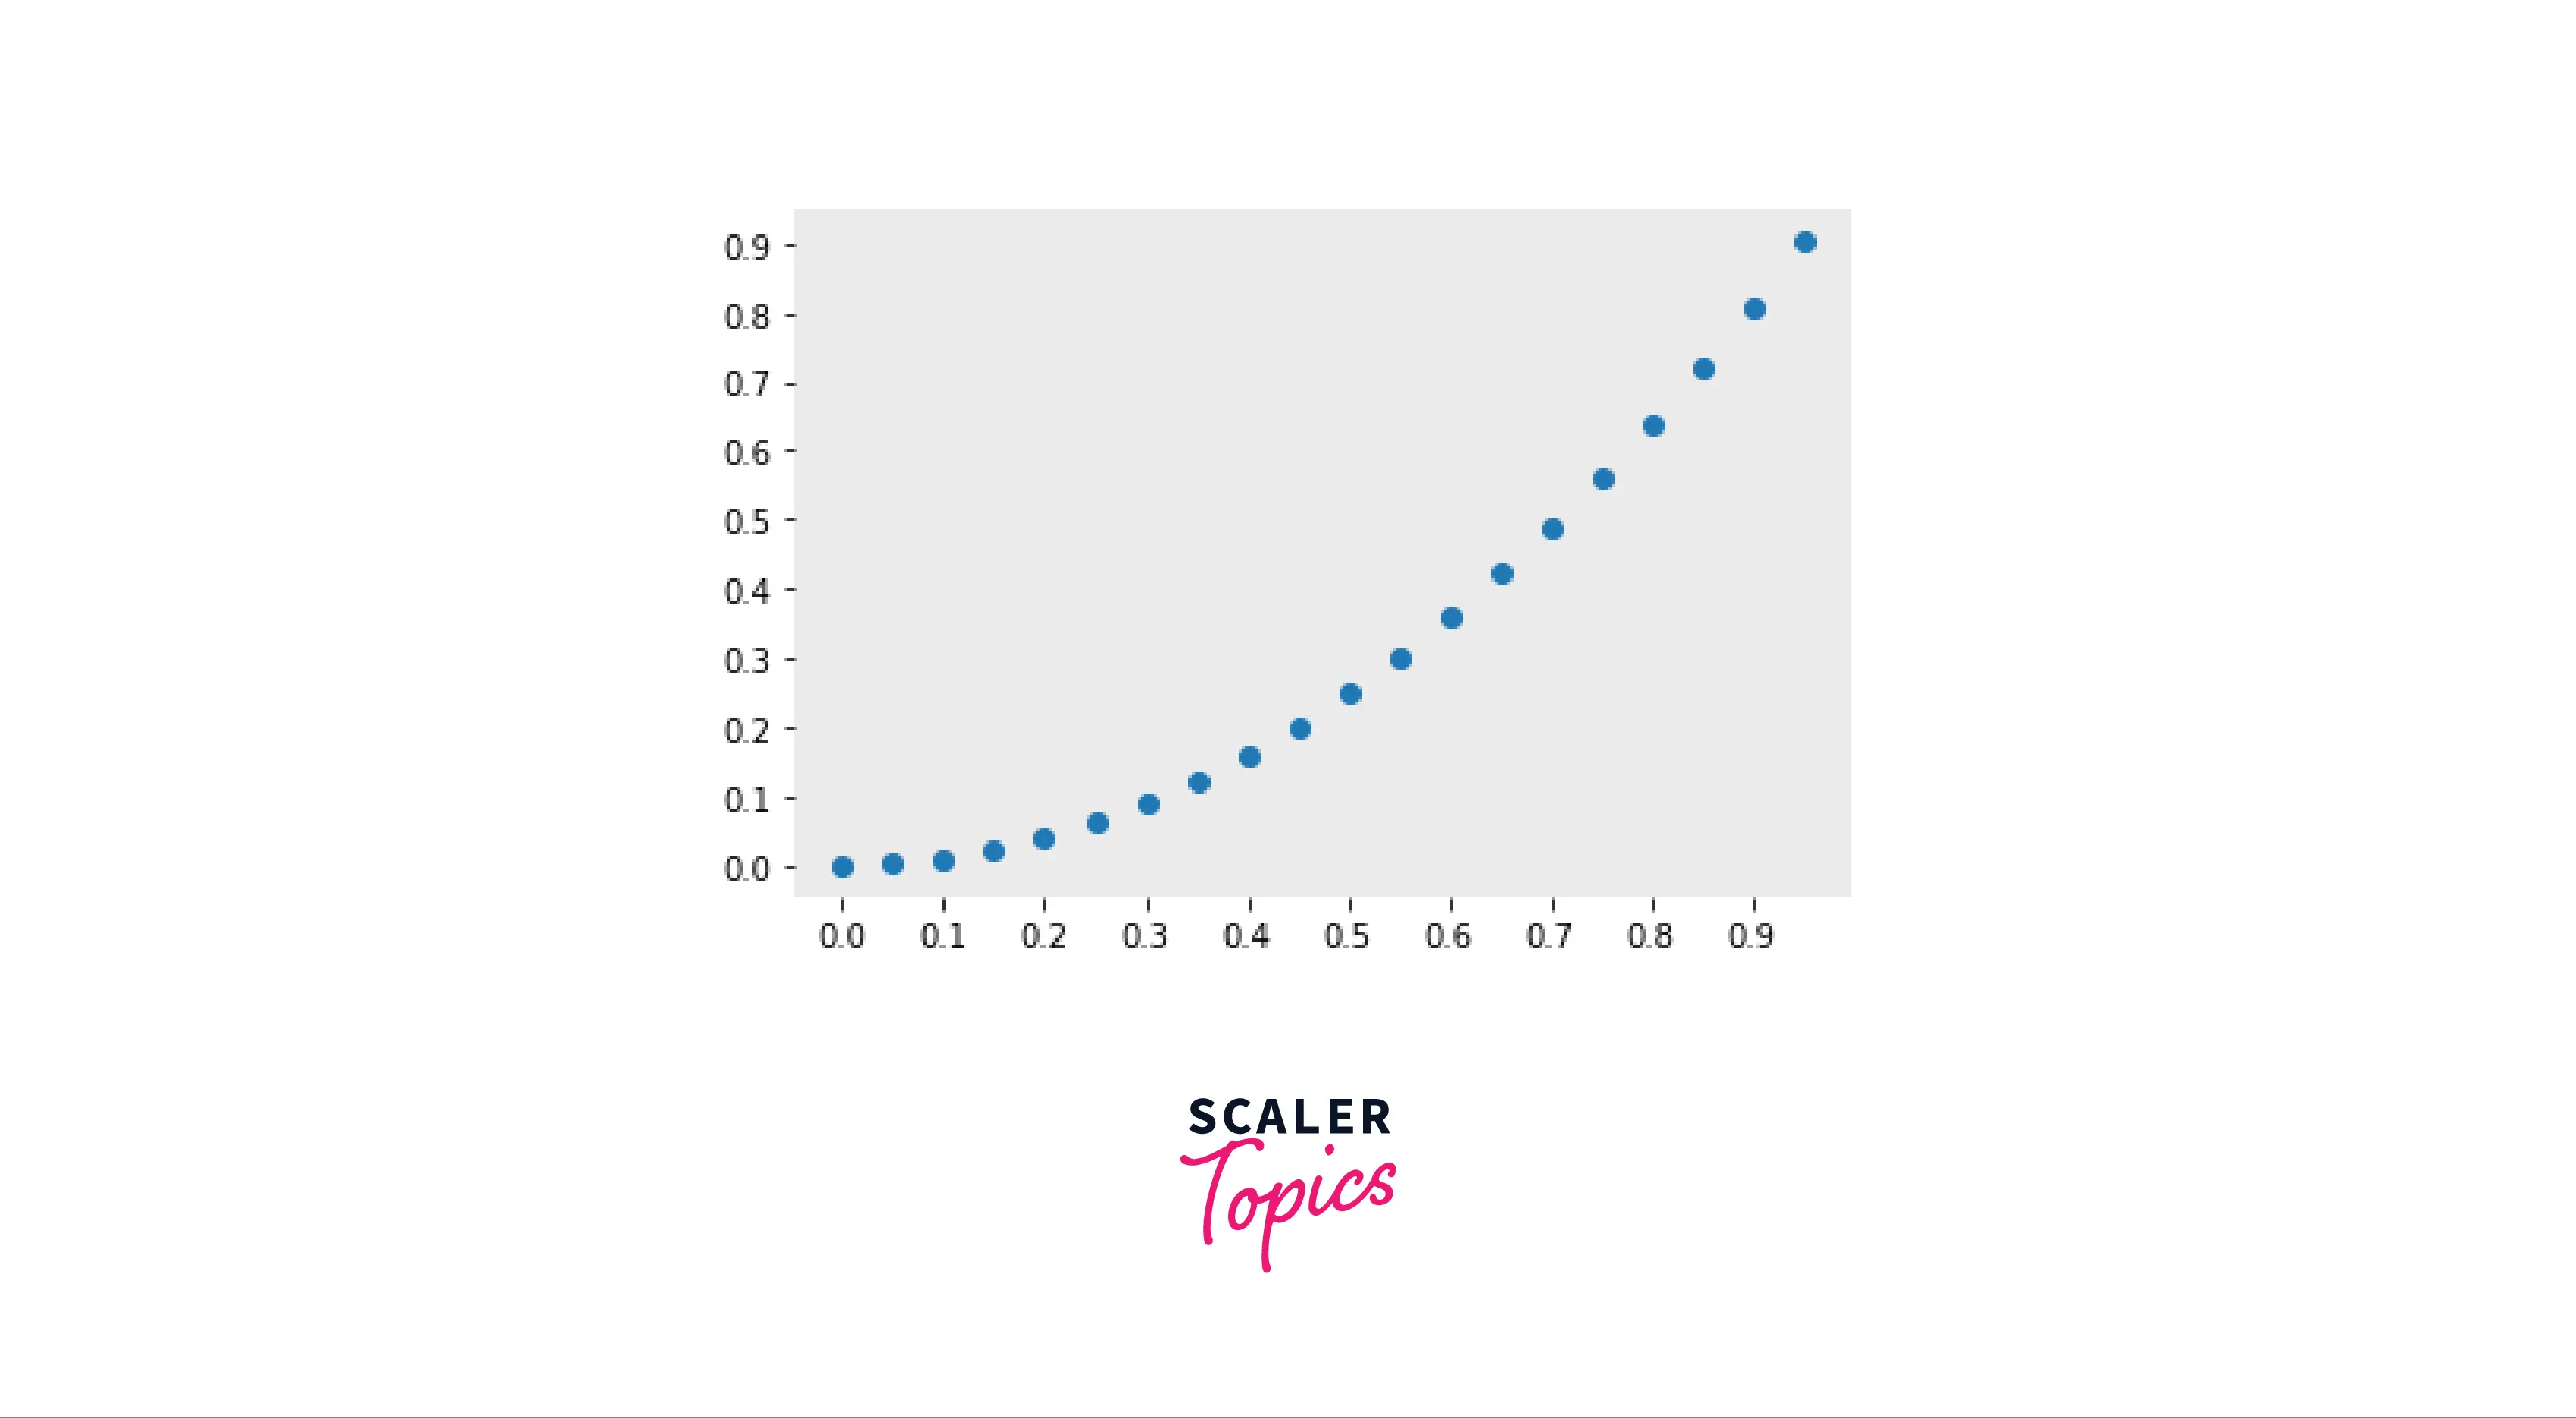
What is Background Grid in Matplotlib?
- A background grid in Matplotlib is when we try to superimpose a rectangular grid in the background of a plot.
- The normal grid consists of straight lines intersecting at specific points. However, regarding background grids, the shape and density of the grid can be varied according to our needs.
- We can specify parameters if we want our grids to be dotted or have breaks.
Output:
Turn Learning into Career Growth
How to Customize a Grid in Matplotlib?
- Customizing grids in matplotlib is one of the most salient features in matplotlib. It has many use cases.
- Suppose your client wants you to sort women's clothing by red and men's clothing by blue. You would have to create a grid in such a way that it differentiates between red and blue clothes.
- There are a lot of functions in Matplotlib to customize grids. A few of them are:
- set_facecolor()
where: color: hex-code of any colour.
- Example****Example:
Output:

- Removing borders around our plots:
- For removing borders around our plots, we need to use the .spines function, and change the set_visible() to False.
Output:
- Showing minorticks
- Minorticks can be switched on/off using the minorticks_on() function.
Output:

How to Add a Grid When the Ticks are Off?
- The values used to display certain positions on the coordinate axis are called ticks. It might be a string or a number.
- The axes automatically change and take the default ticks whenever we plot a graph.
- To demonstrate this, we will take the "GDP-2014" dataset.

- To turn off all the ticks, we will use the .tick_params() function, and we will set every tick to "off".
Output:

More Grid Examples
-
Here are some grid examples that will help you understand the concept and meaning of grids in a better way.
-
In this example, we will try to create a simple and comprehensive grid for a plot.
Output:

-
In this example, we will try to render a major and minor grid.
-
Rendering a major grid on a minor grid means that we would have our smaller/minor grids inside our major grids.
Output:

Conclusion
- In this article, we covered what grids in matplotlib are.
- We went through the process of adding a grid to our plot.
- Apart from this, we also covered logarithmic grids that enhance our visualizations.
- Customizing grids according to our own needs was also covered in depth.
- We learned how to add a grid when the ticks are off in a plot.