What is Matplotlib Inline in Python?
Overview
Magic commands perform special functions in the IPython shell. For example, Matplotlib Inline command is a magic command that makes the plots generated by matplotlib show in the IPython shell we are running and not in a separate output window. Different IPython IDEs offer a slightly different representation of the plots generated using matplotlib.
Introduction
Magic commands, also known as magics, are one of the improved distinctions that IPython has compared to the classic Python shell. Magics are introduced to ease the efforts of commonly occurring tasks in data analysis using Python. They majorly determine the behavior of the IPython session.
matplotlib inline is a magic command that acts as a convenience function instead of clumsy python code to perform some configuration for the matplotlib in the current IPython session.
Scaler Placement Report and Statistics
Scaler learners achieved 2.5x salary growth with average post-Scaler CTC reaching ₹23L.
What is matplotlib inline in Python?
In IPython, there are various built-in functions known as magic functions. The magic functions are also called magic commands as they have a specific syntax used to call these magic functions.
The magic commands are of two kinds
- line-oriented magic commands
- cell-oriented magic commands
Line-Oriented Magic Commands
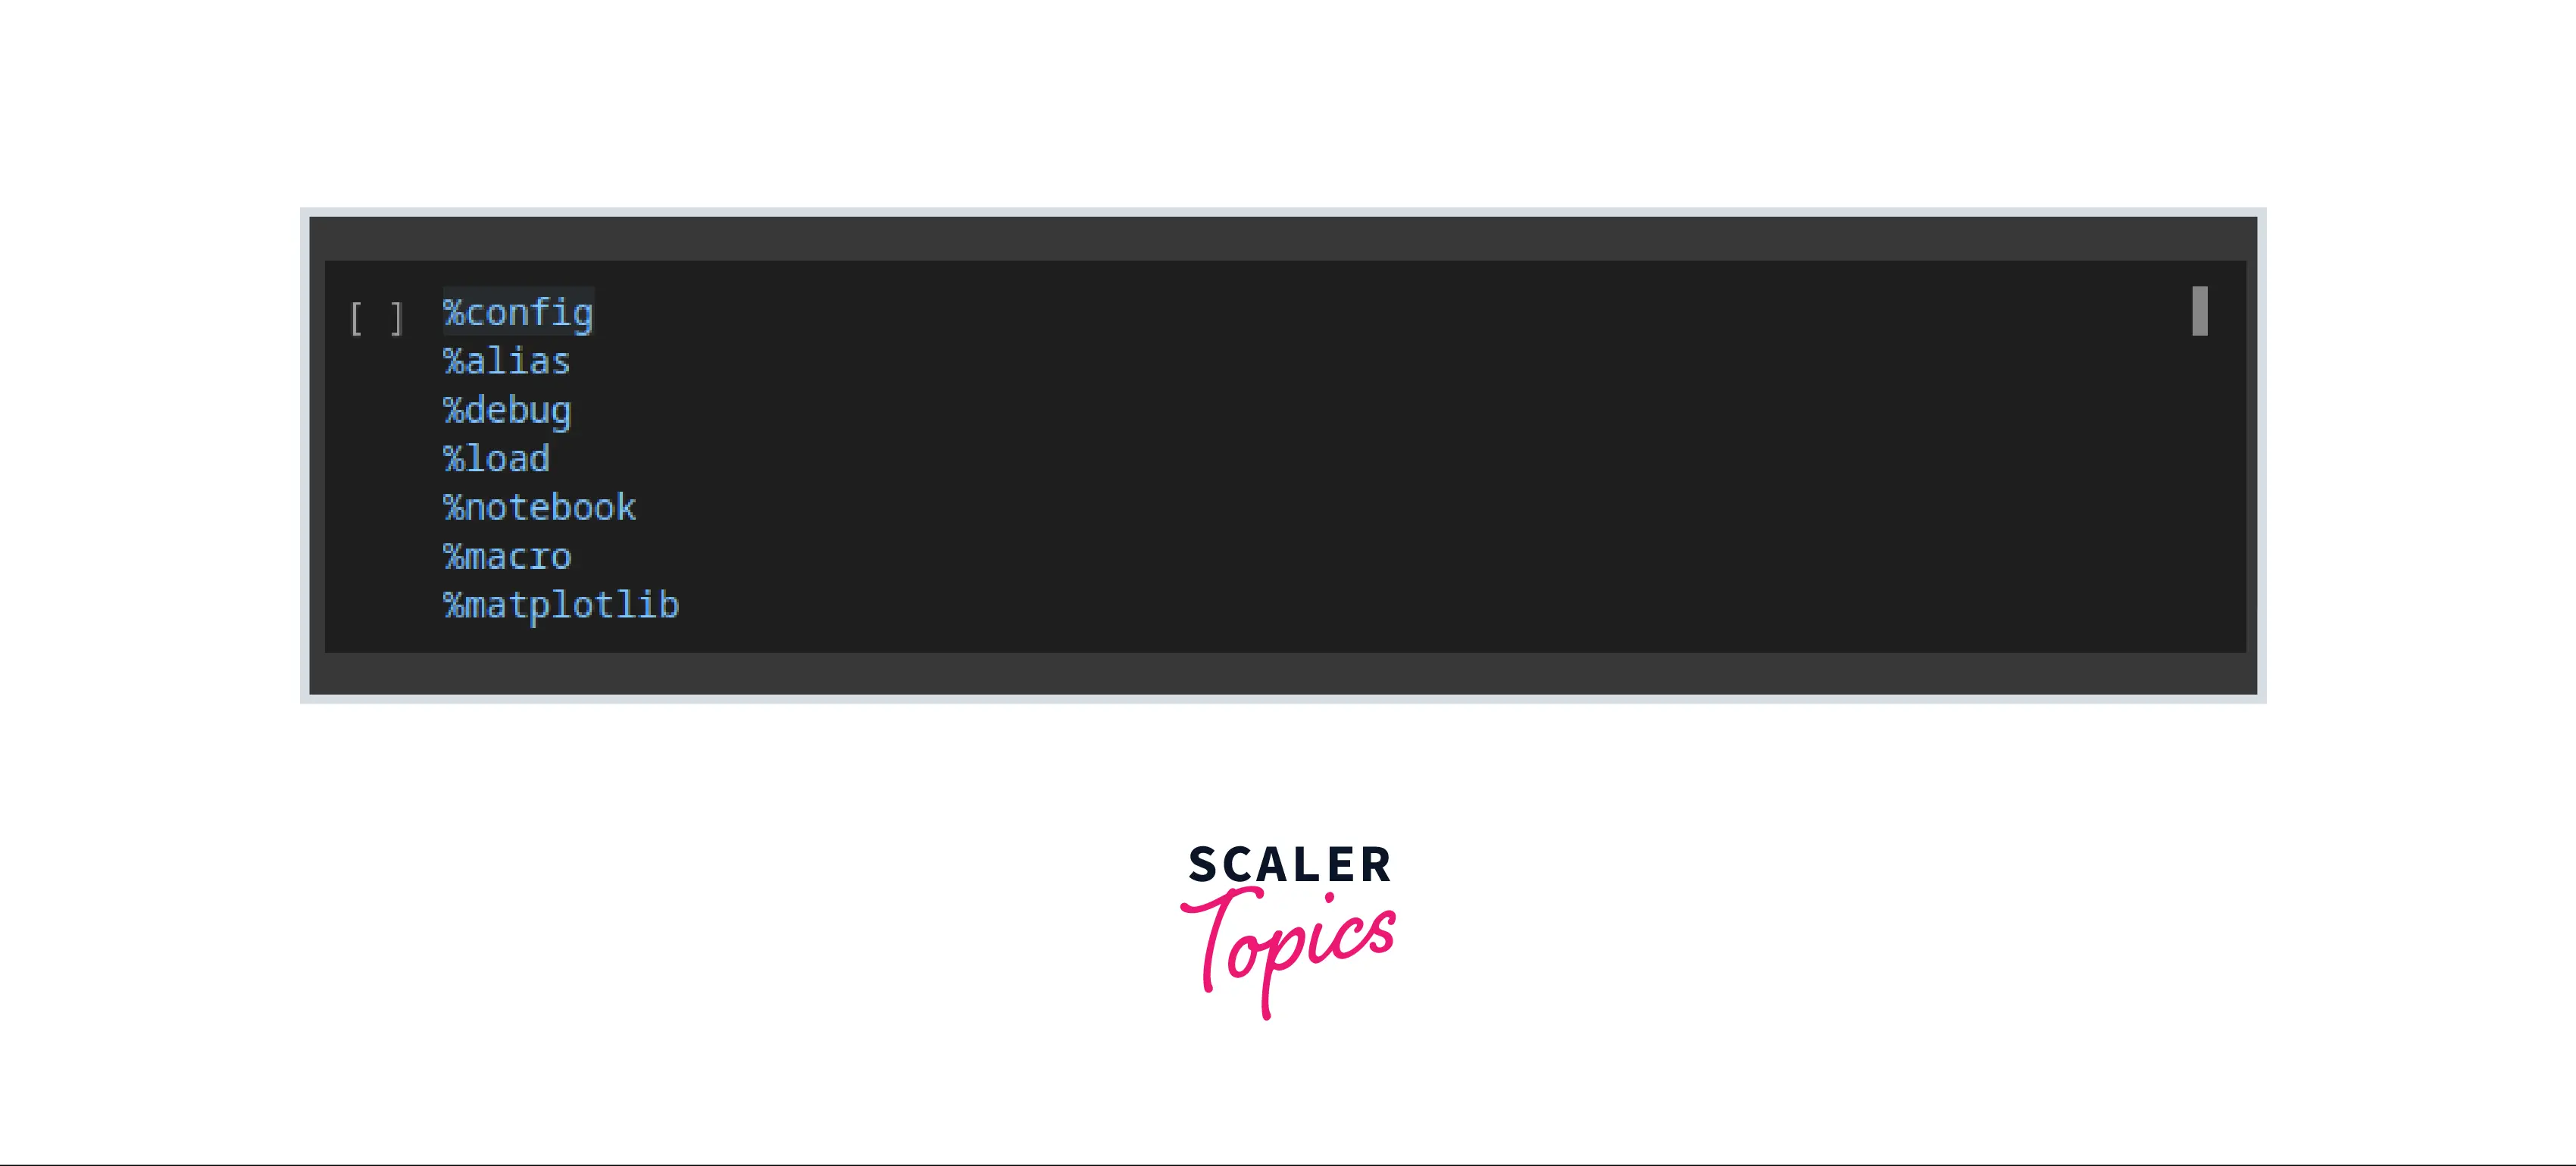
The line-oriented magic commands are also known as line magics. The syntax of line magics starts with a single percentage % followed by a command name followed by arguments. The command after % sign analogy can be seen with the command line interface of the operating system. The line magics do not contain any parenthesis or quotes.
Examples of line magics are: - %autowait, - %config, - %alias, - %conda, - %debug, - %load, - %notebook, - %macro, - %matplotlib, - so on
Some line magics have returns values that can be assigned to some variable and further used.
For example
Output

Transform Your Career
Choose from our industry-leading programs designed for career success
Modern Software and AI Engineering Program
Master full-stack development with AI integration

Modern Data Science and ML with specialisation in AI
Advanced data science techniques with AI specialization
Advanced AIML with Specialisation in Agentic AI
Deep dive into AIML with focus on Agentic systems
DevOps, Cloud & AI Platform Engineering
Build and manage AI-powered cloud infrastructure
AI Engineering Advanced Certification by IIT-Roorkee
Premier AI engineering certification from IIT-Roorkee
Cell-Oriented Magic Commands
The cell-oriented magic commands are also known as cell magics. The syntax of cell magics starts with a double percentage %% followed by a command name followed by arguments. The lines below the cell magic command form a separate argument from the cell magic command.
Examples of Cell magics are:
- %%javascrit,
- %%ruby,
- %%bash,
- %%perl,
- %%script,
- %%html,
- %%sh,
- %%python2,
- so on,
The matplotlib inline command is a line magic command that configures the matplotlib settings in the current IPython environment. These commands enable the matplotlib functionality in an IPython session.
The syntax to enable matplotlib support using the magic command is
The matplotlib magic command takes an argument backend_name. This argument tells the IPython session which particular back-end will be used for matplotlib.
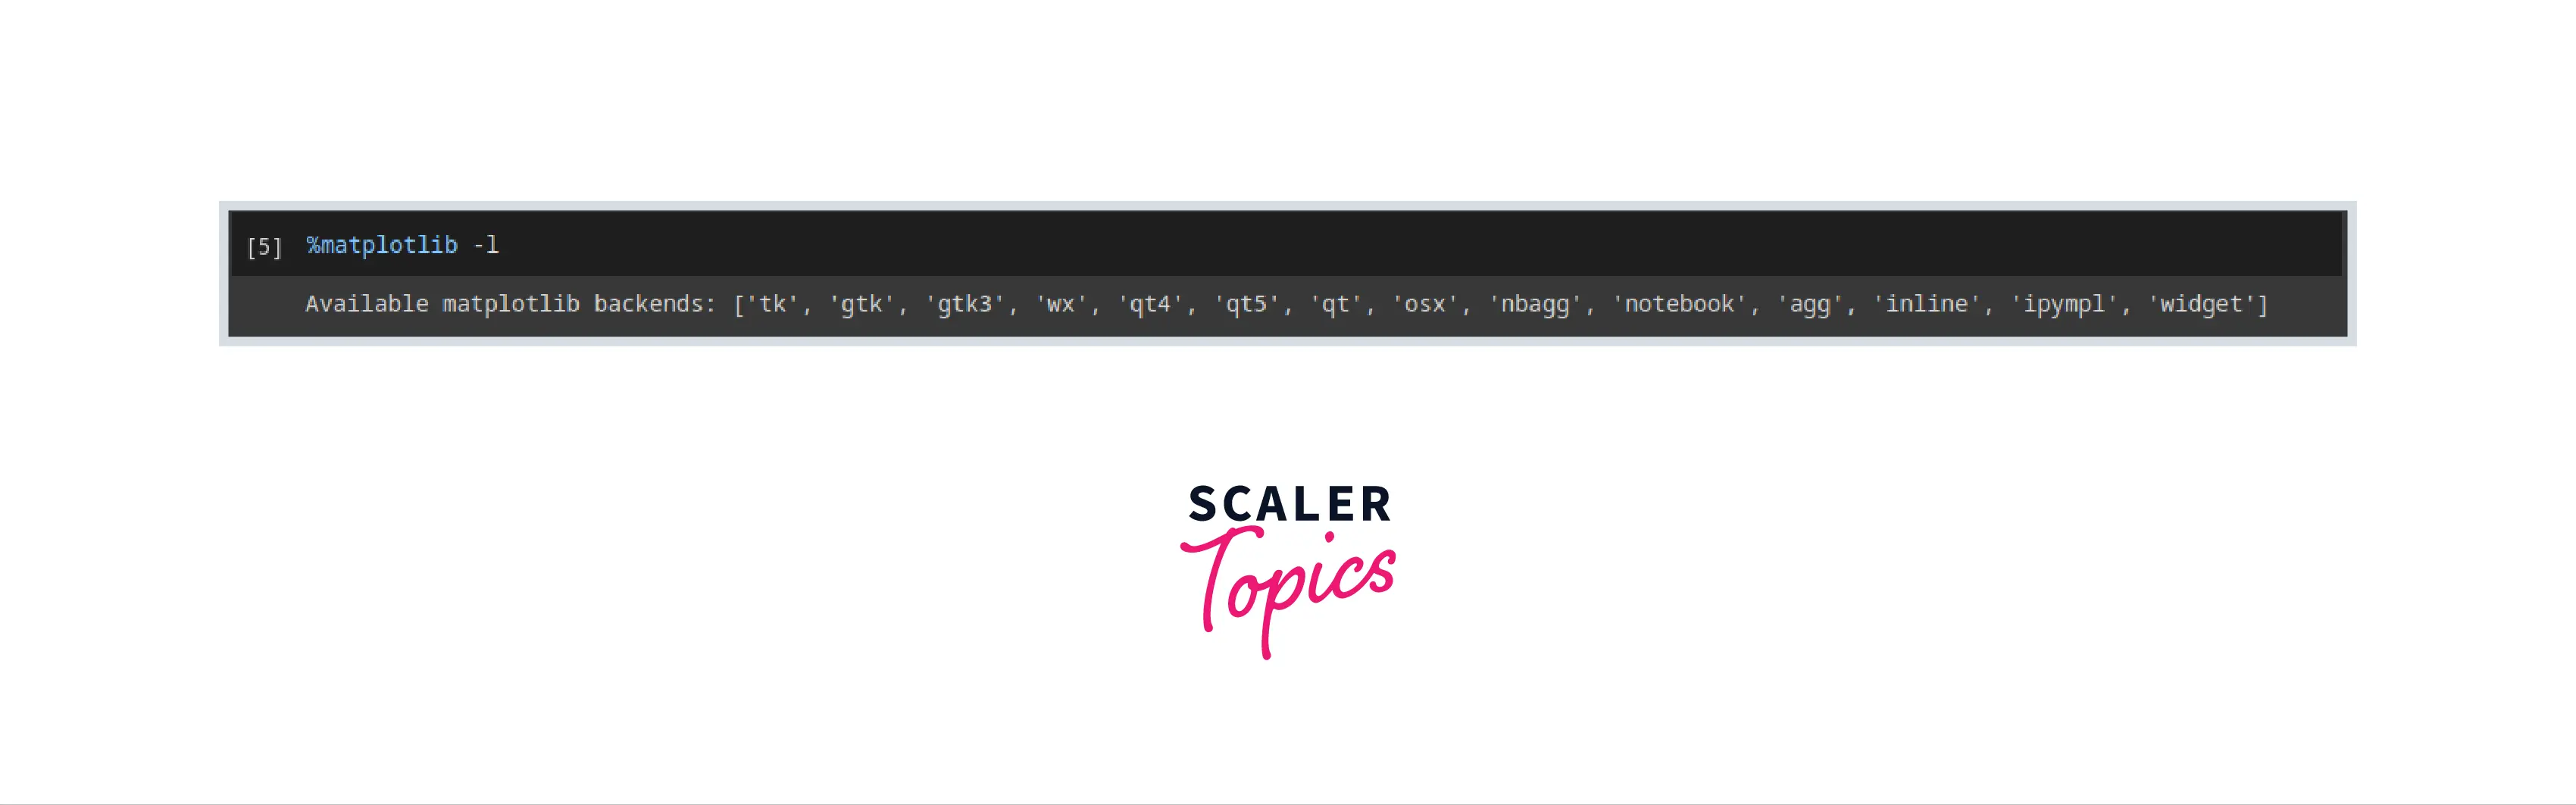
The available matplotlib back-ends can be listed using the following command.
Output:
The %matplotlib inline command tells the IPython environment to draw the plots immediately after the current cell. The drawn plots are shown below the code and stored in the notebook document for future reference.
Why matplotlib inline is Used?
The line magic command %matplotlib inline enables the drawing of matplotlib figures in the IPython environment. Once this command is executed in any cell, the matplotlib plots will appear directly below the cell in which the plot function was called for the rest of the session.
The matplotlib inline command is greatly helpful as it distinguishes between plots of different cells. For each cell, the graph is plotted after the current cell, which does not affect the graphs of previous cells.
It creates a separation between graphs between cells such that settings like color pallets if applied in the current cell, will not affect the plots of any previous cells.
In the latest versions of IPython and Jupyter notebooks, the command %matplotlib inline is unnecessary as the plots are displayed below the cell by default.
In older versions of IPython and Jupyter notebooks, if the interactive mode is disabled and the graphs are plotted using matplotlib, they will not appear unless the matplotlib.pyplot.show() function is called.
How to use Matplotlib Inline?
The magic command matplotlib inline should be written on the first line in a cell, followed by the code for plotting the graphs.
The syntax is
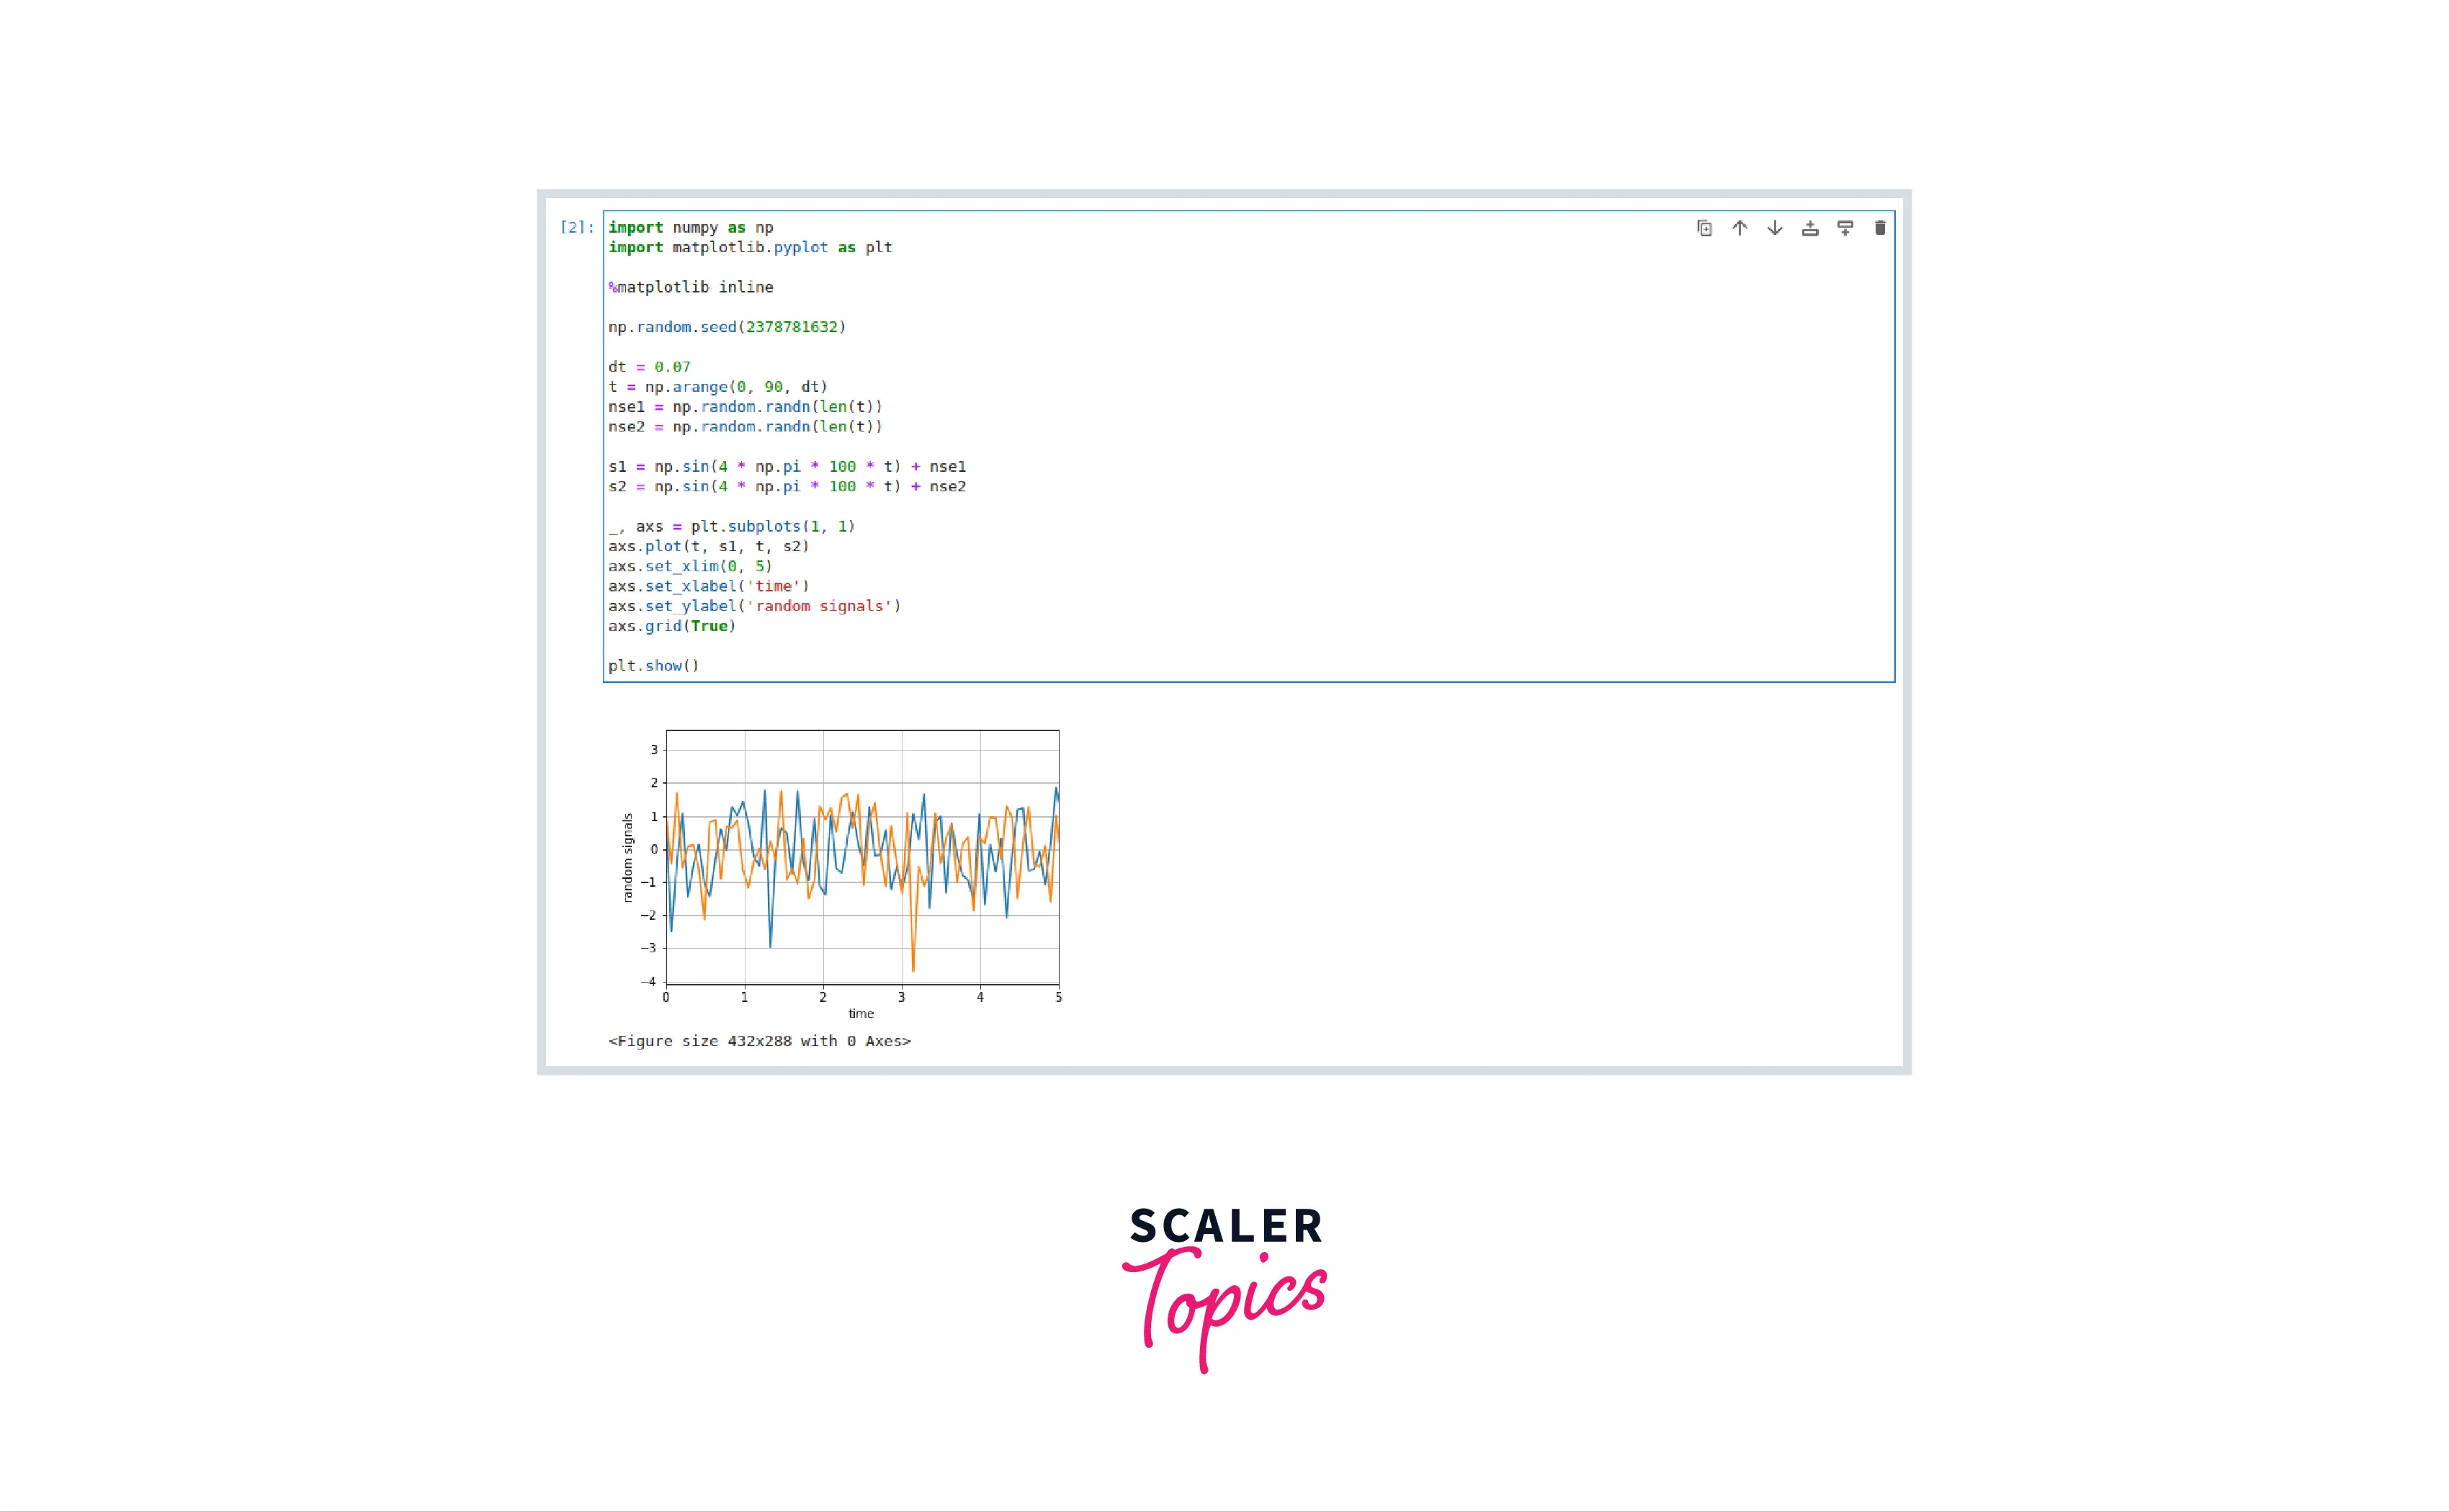
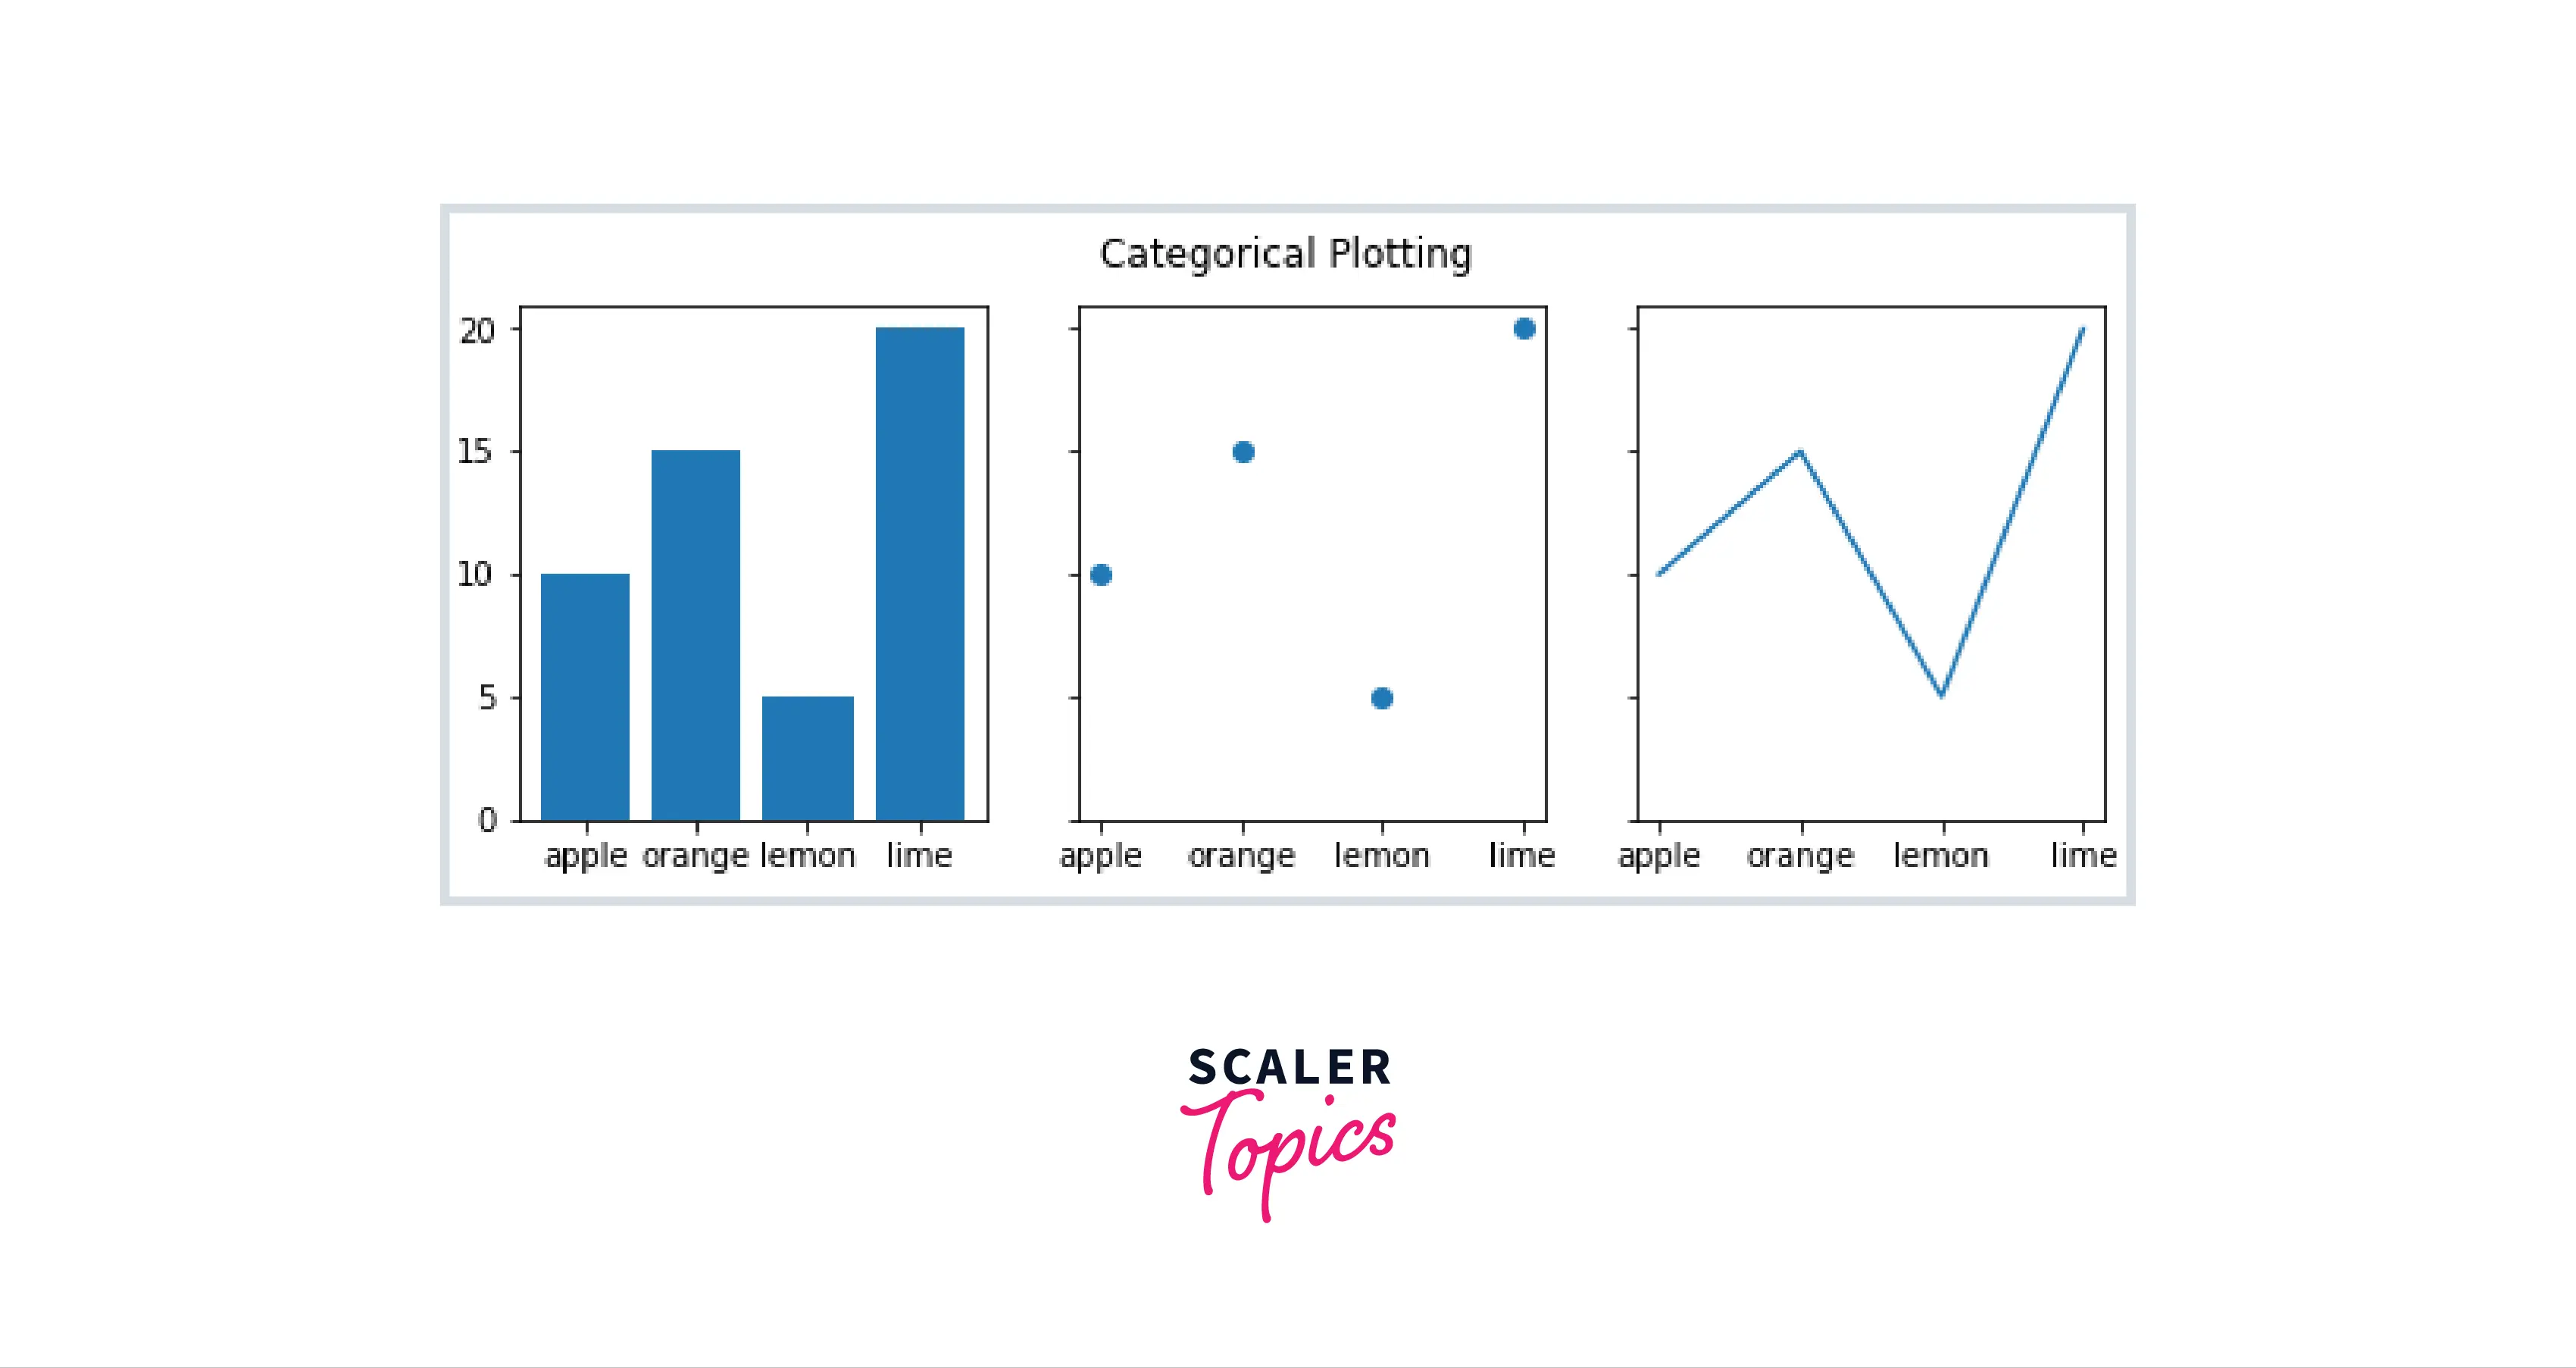
Example:
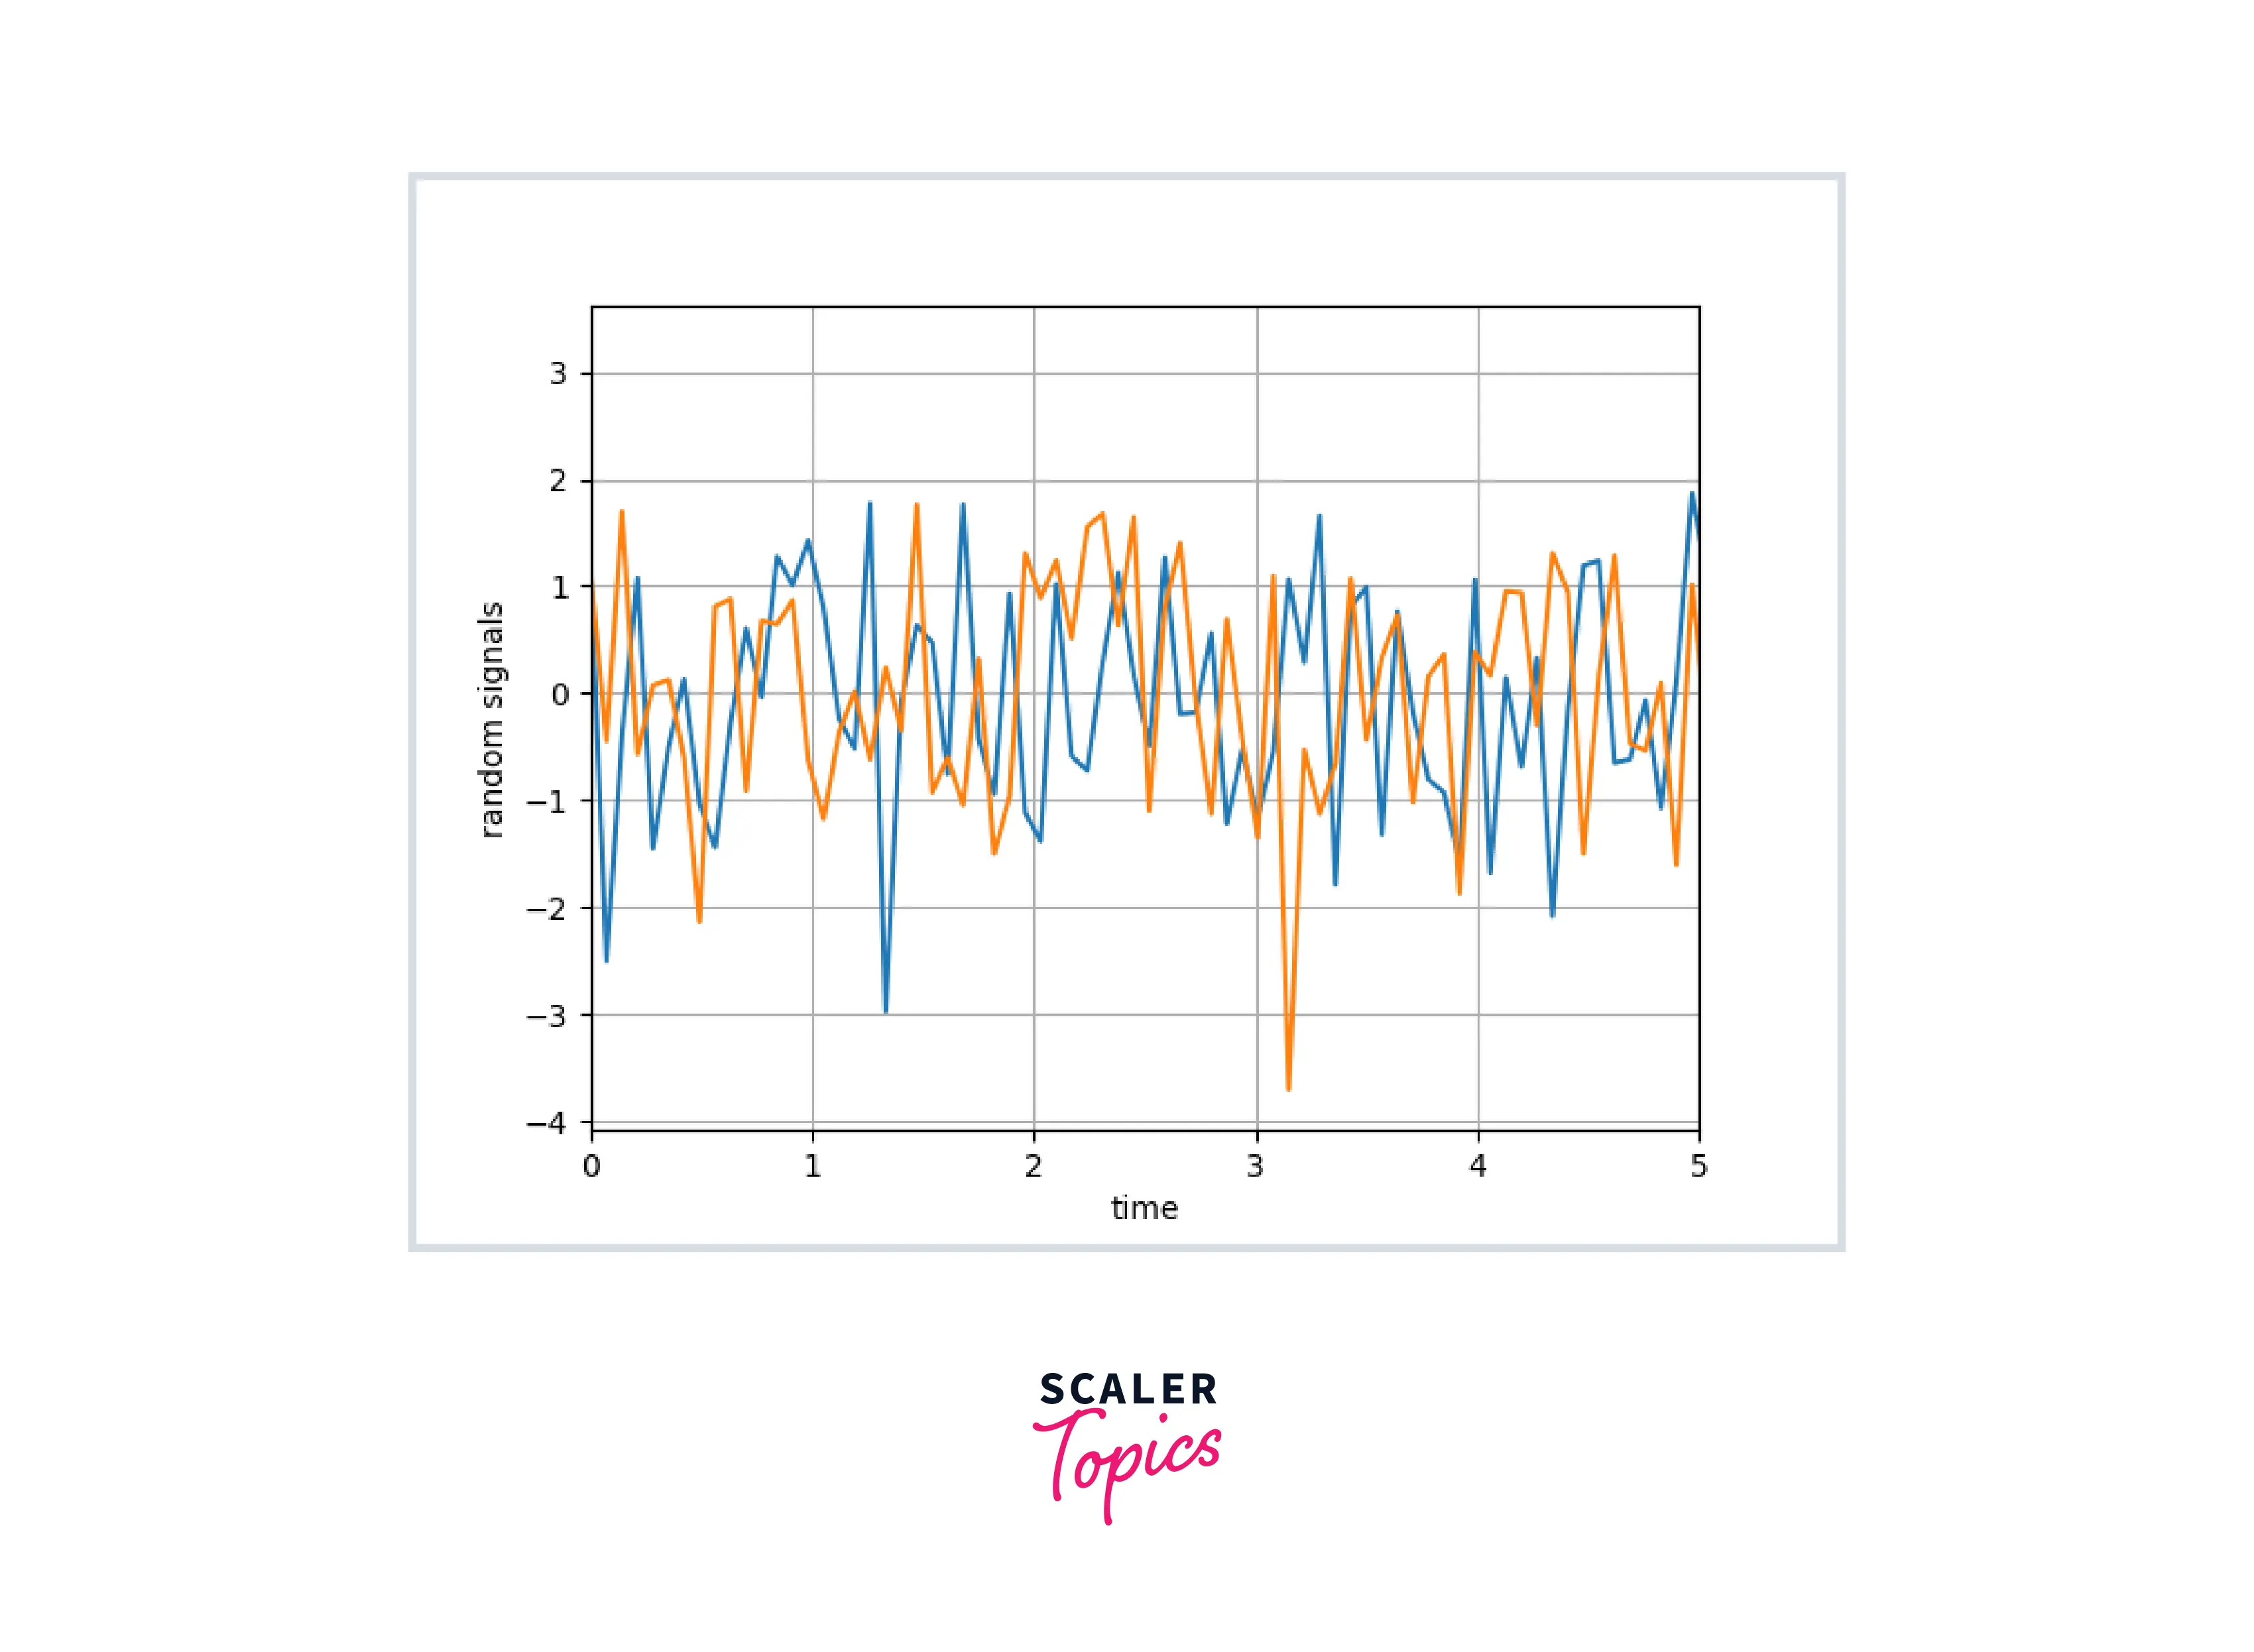
Output:

Explanation:
The %matplotlib inline command in the third line of the cell causes the graph to appear right below the cell.
How to Use Matplotlib Inline in Popular IDE?
As pointed out earlier, the matplotlib plots have slight variations across different IDEs. Let us look at the %matplotlib inline command in various IDEs.
Turn Learning into Career Growth
matplotlib inline Jupyter
In the above example, the matplotlib function is already shown. So here we'll look at one more example.
Program
Output:
Jupyter Interface
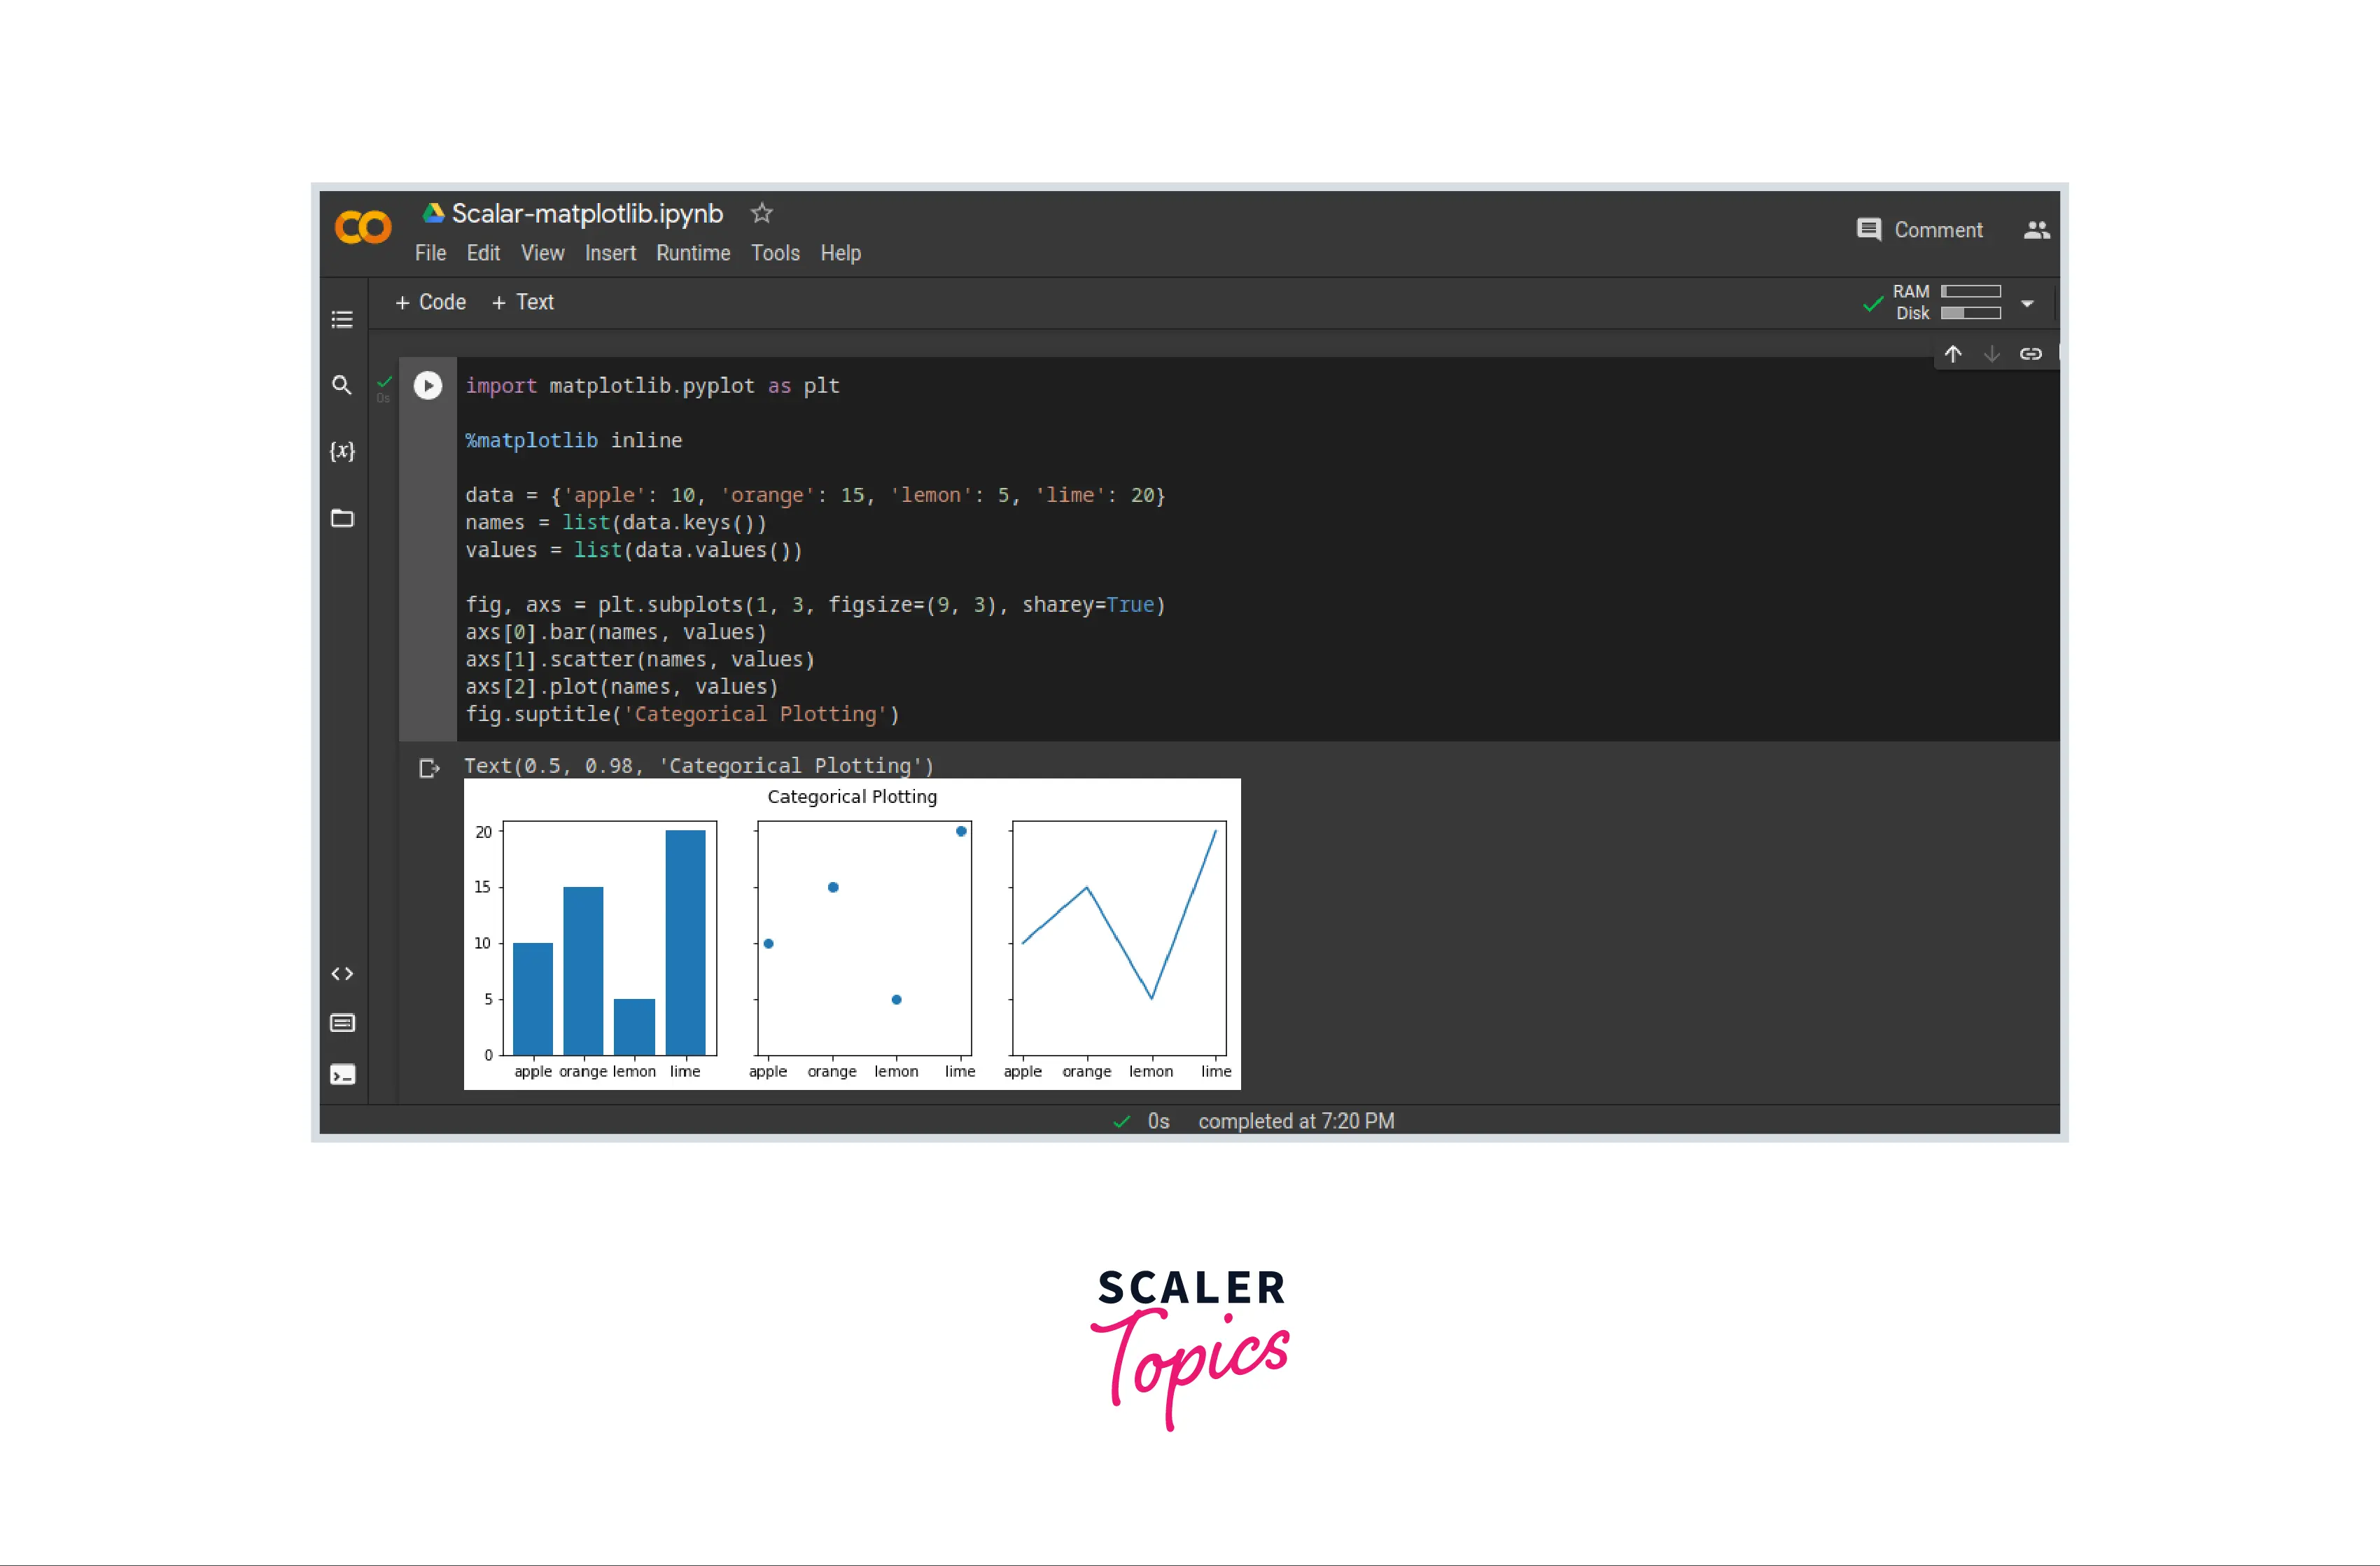
matplotlib inline in Google Colab
Google Colab is a Jupyter implementation provided by Google meant for researchers and scholars and runs entirely on the cloud. The advantage of Google Colab is that it runs entirely on the cloud and provides a powerful advantage over the computing machines of Google Cloud.
Program
Output:
Google Colab Interface:
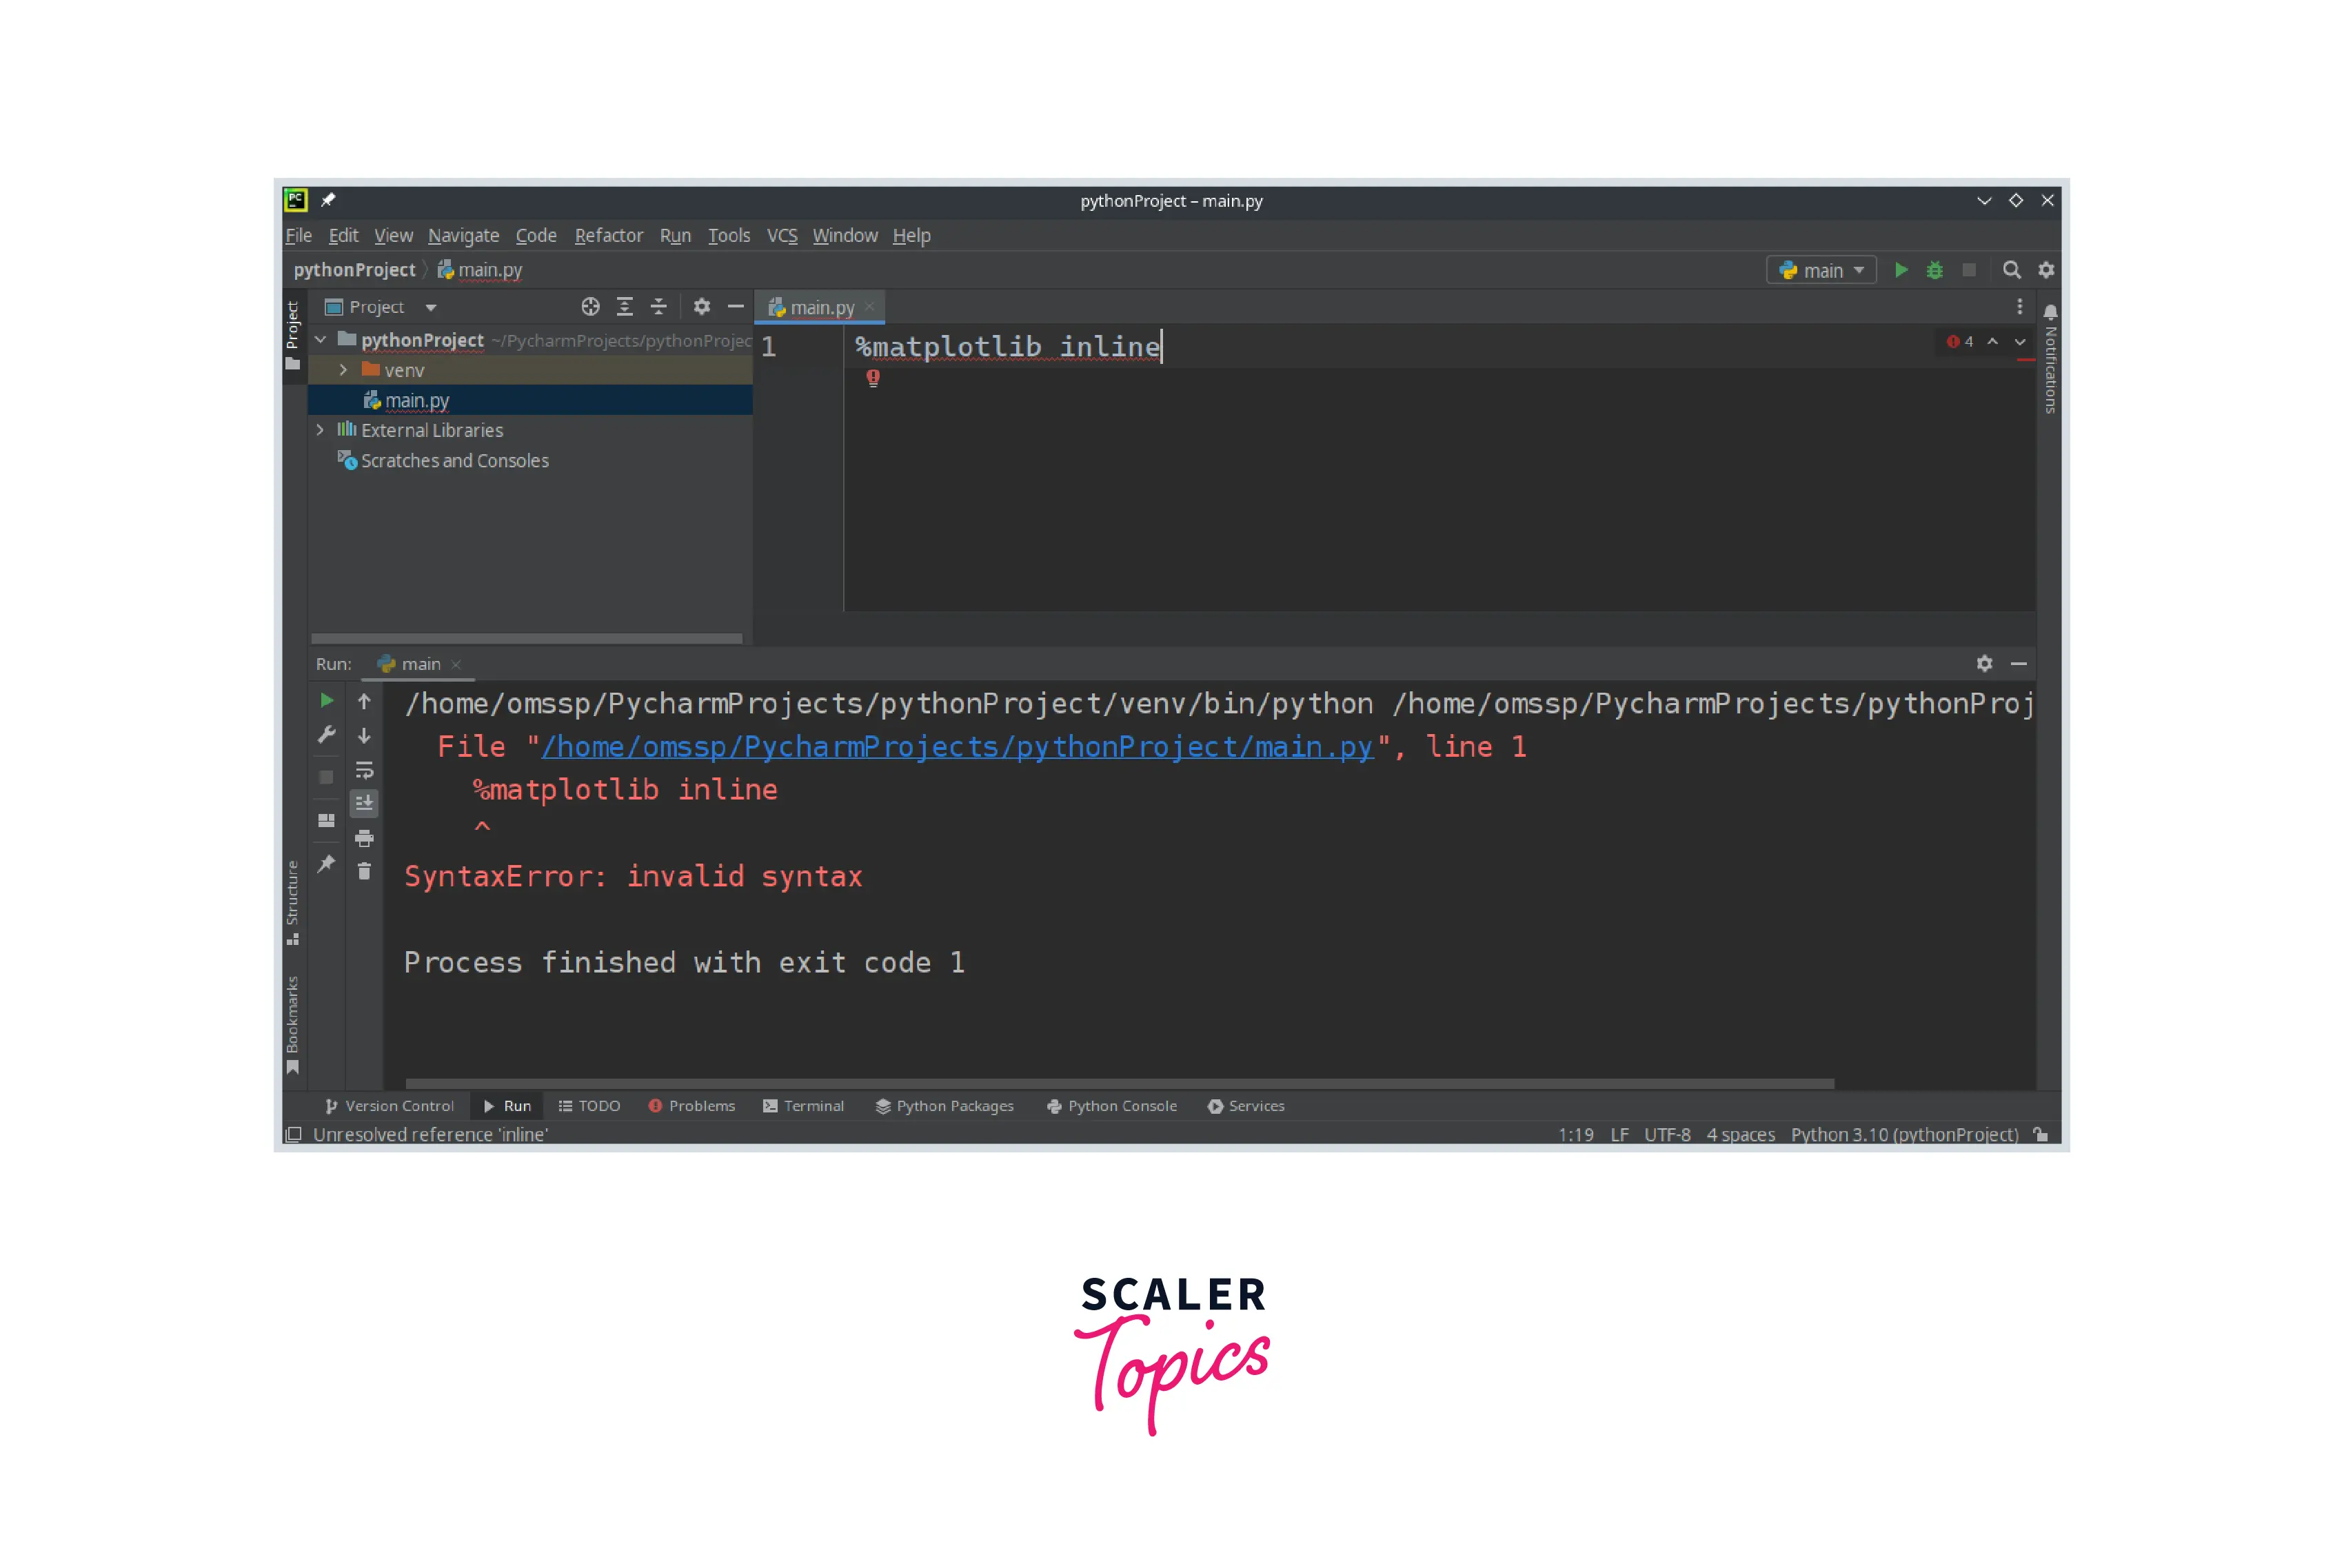
matplotlib inline in PyCharm
PyCharm is a Python IDE. The magic commands are available in the IPython environment; hence, the matplotlib inline command is unavailable in PyCharm.
The command %matplotlib inline throws an error if executed in a normal Python environment.
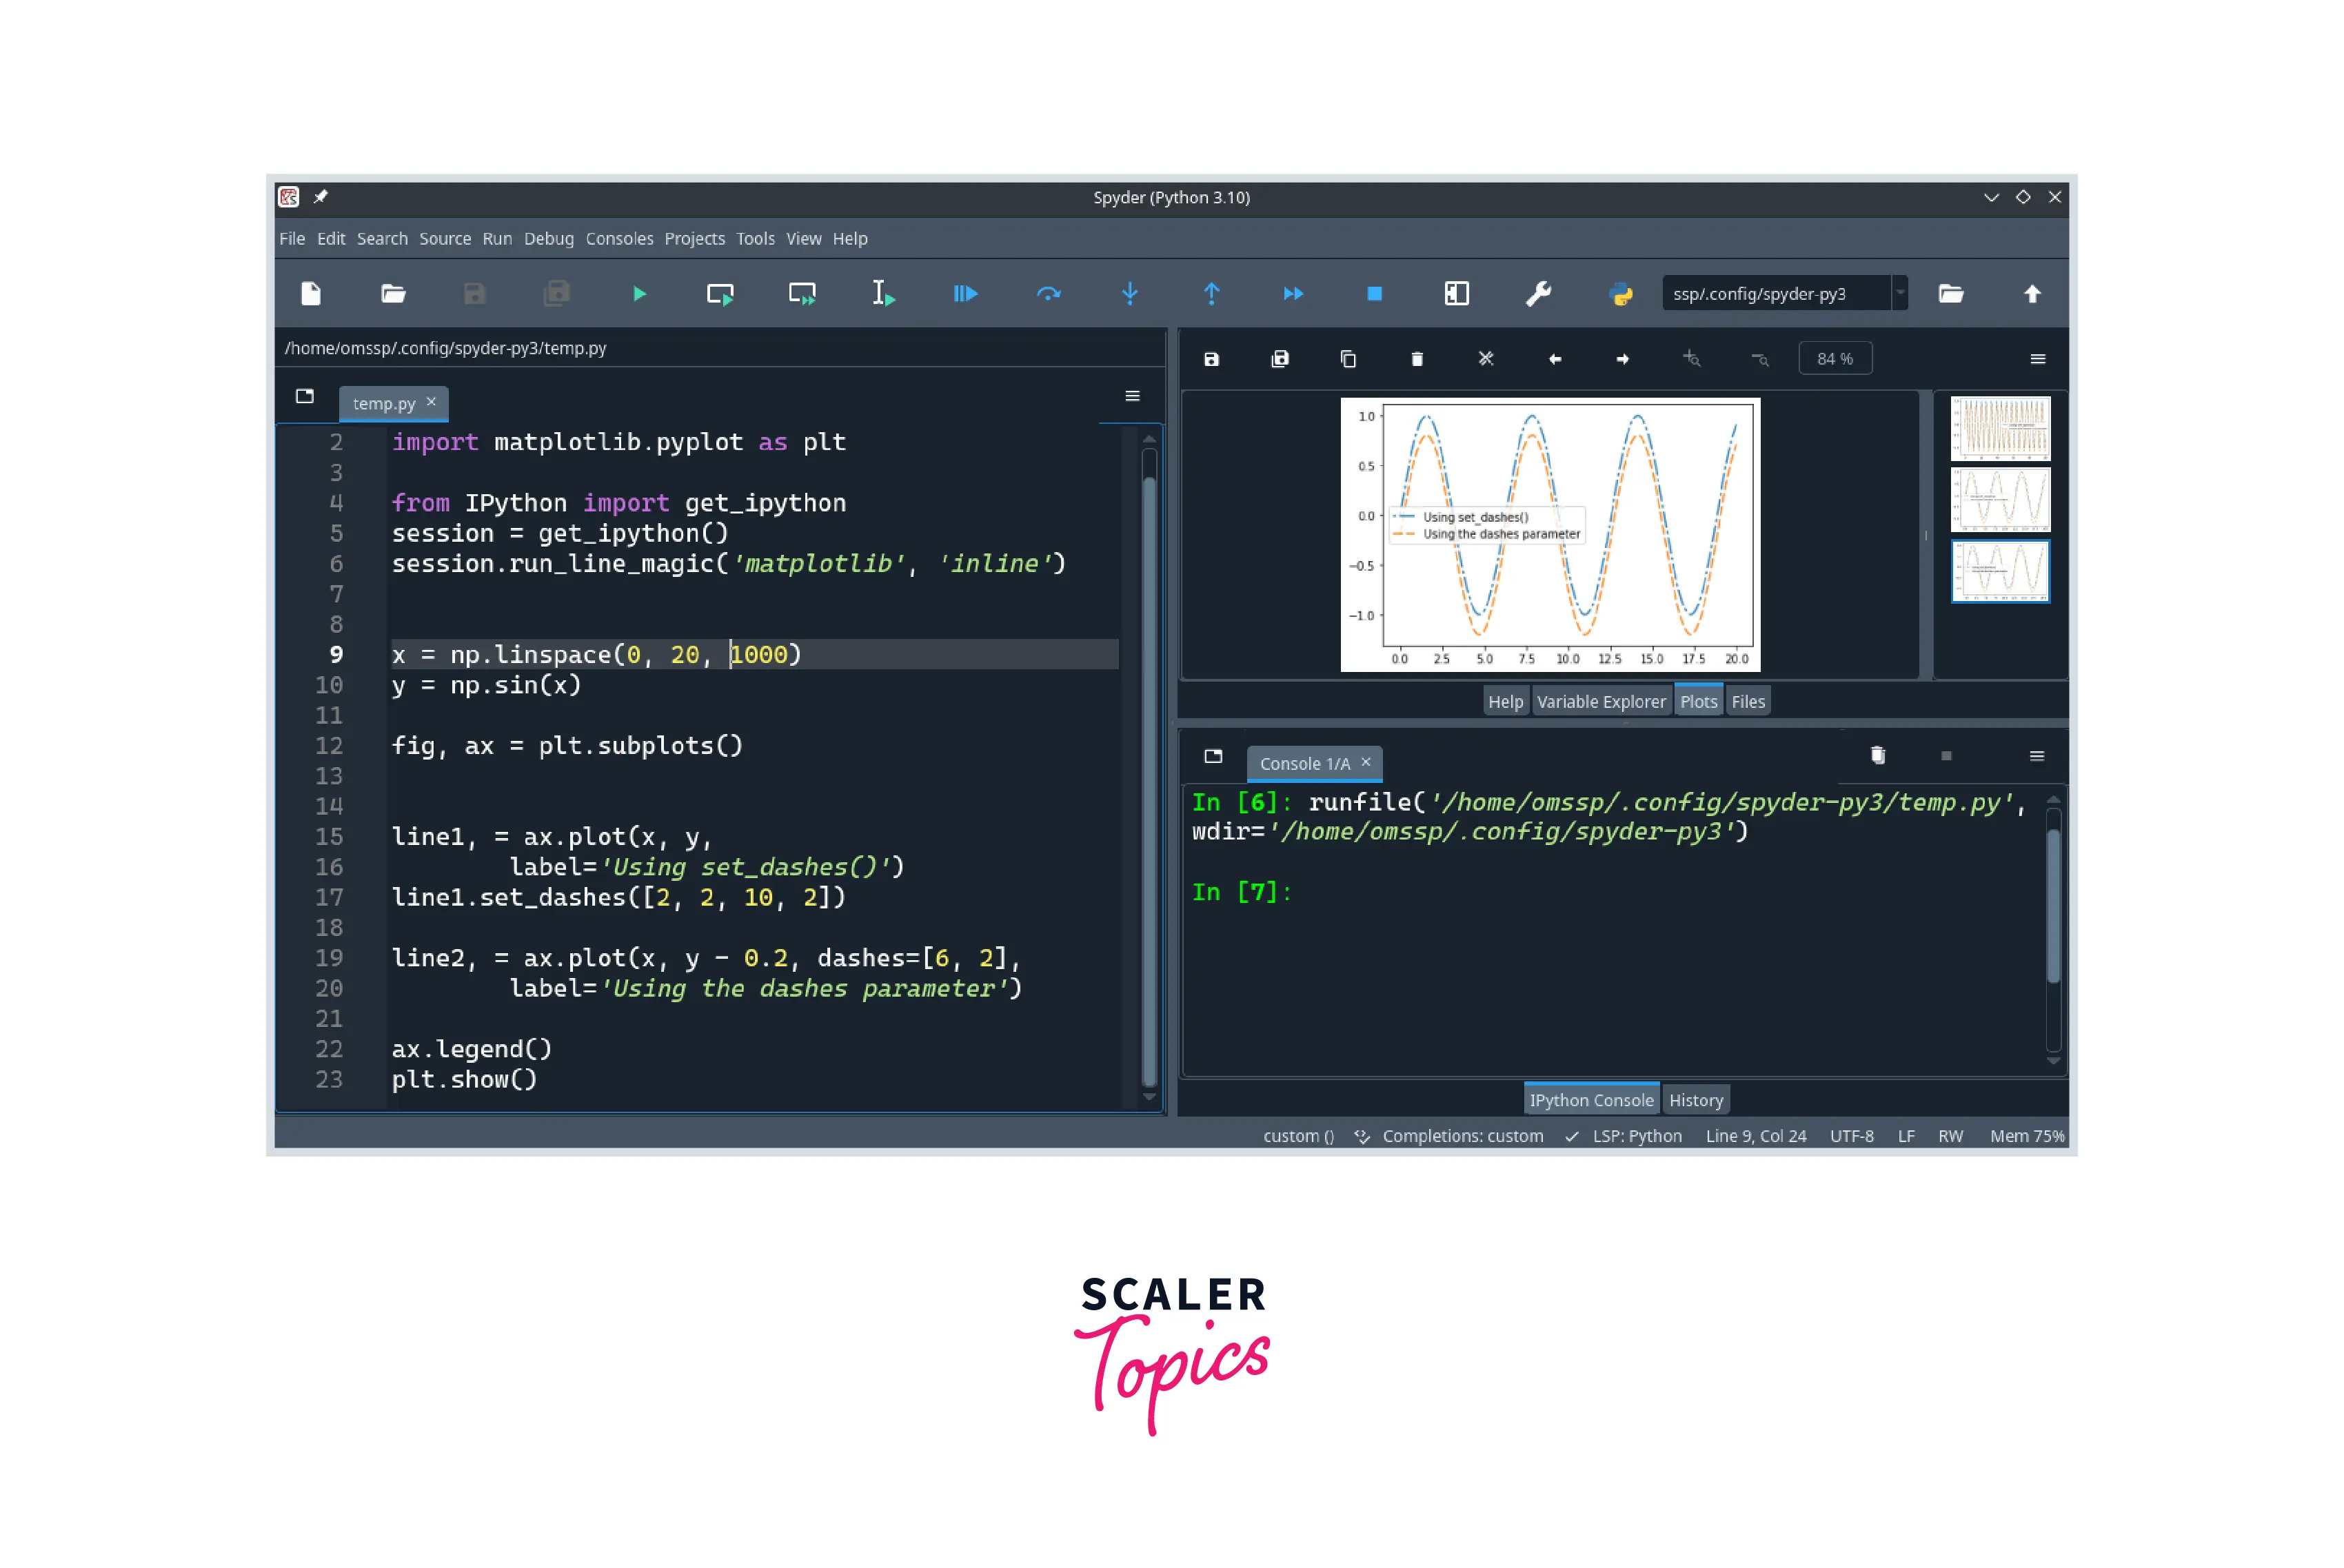
matplotlib inline in Spyder
Since the magic commands are available only in IPython sessions, to execute the %matplotlib inline command, we have two ways:
- Import IPython and execute the magic command using the run_line_magic() function.
- Set the matplotlib back-end using Spyder IDE's preferences
Importing IPython to execute the magic command
To import the IPython in Python, use the following code:
The get_ipython() function can return the current IPython session object. The session object has functions that can be called to run the magic commands. The %matplotlib inline command then can be executed using the following code
Example:
Output:
Changing Spyder preference
In the matplotlib back-end, the setting can be changed by navigating to the Tools Menu > Preferences > IPython console > Graphics > Inline or Automatic.

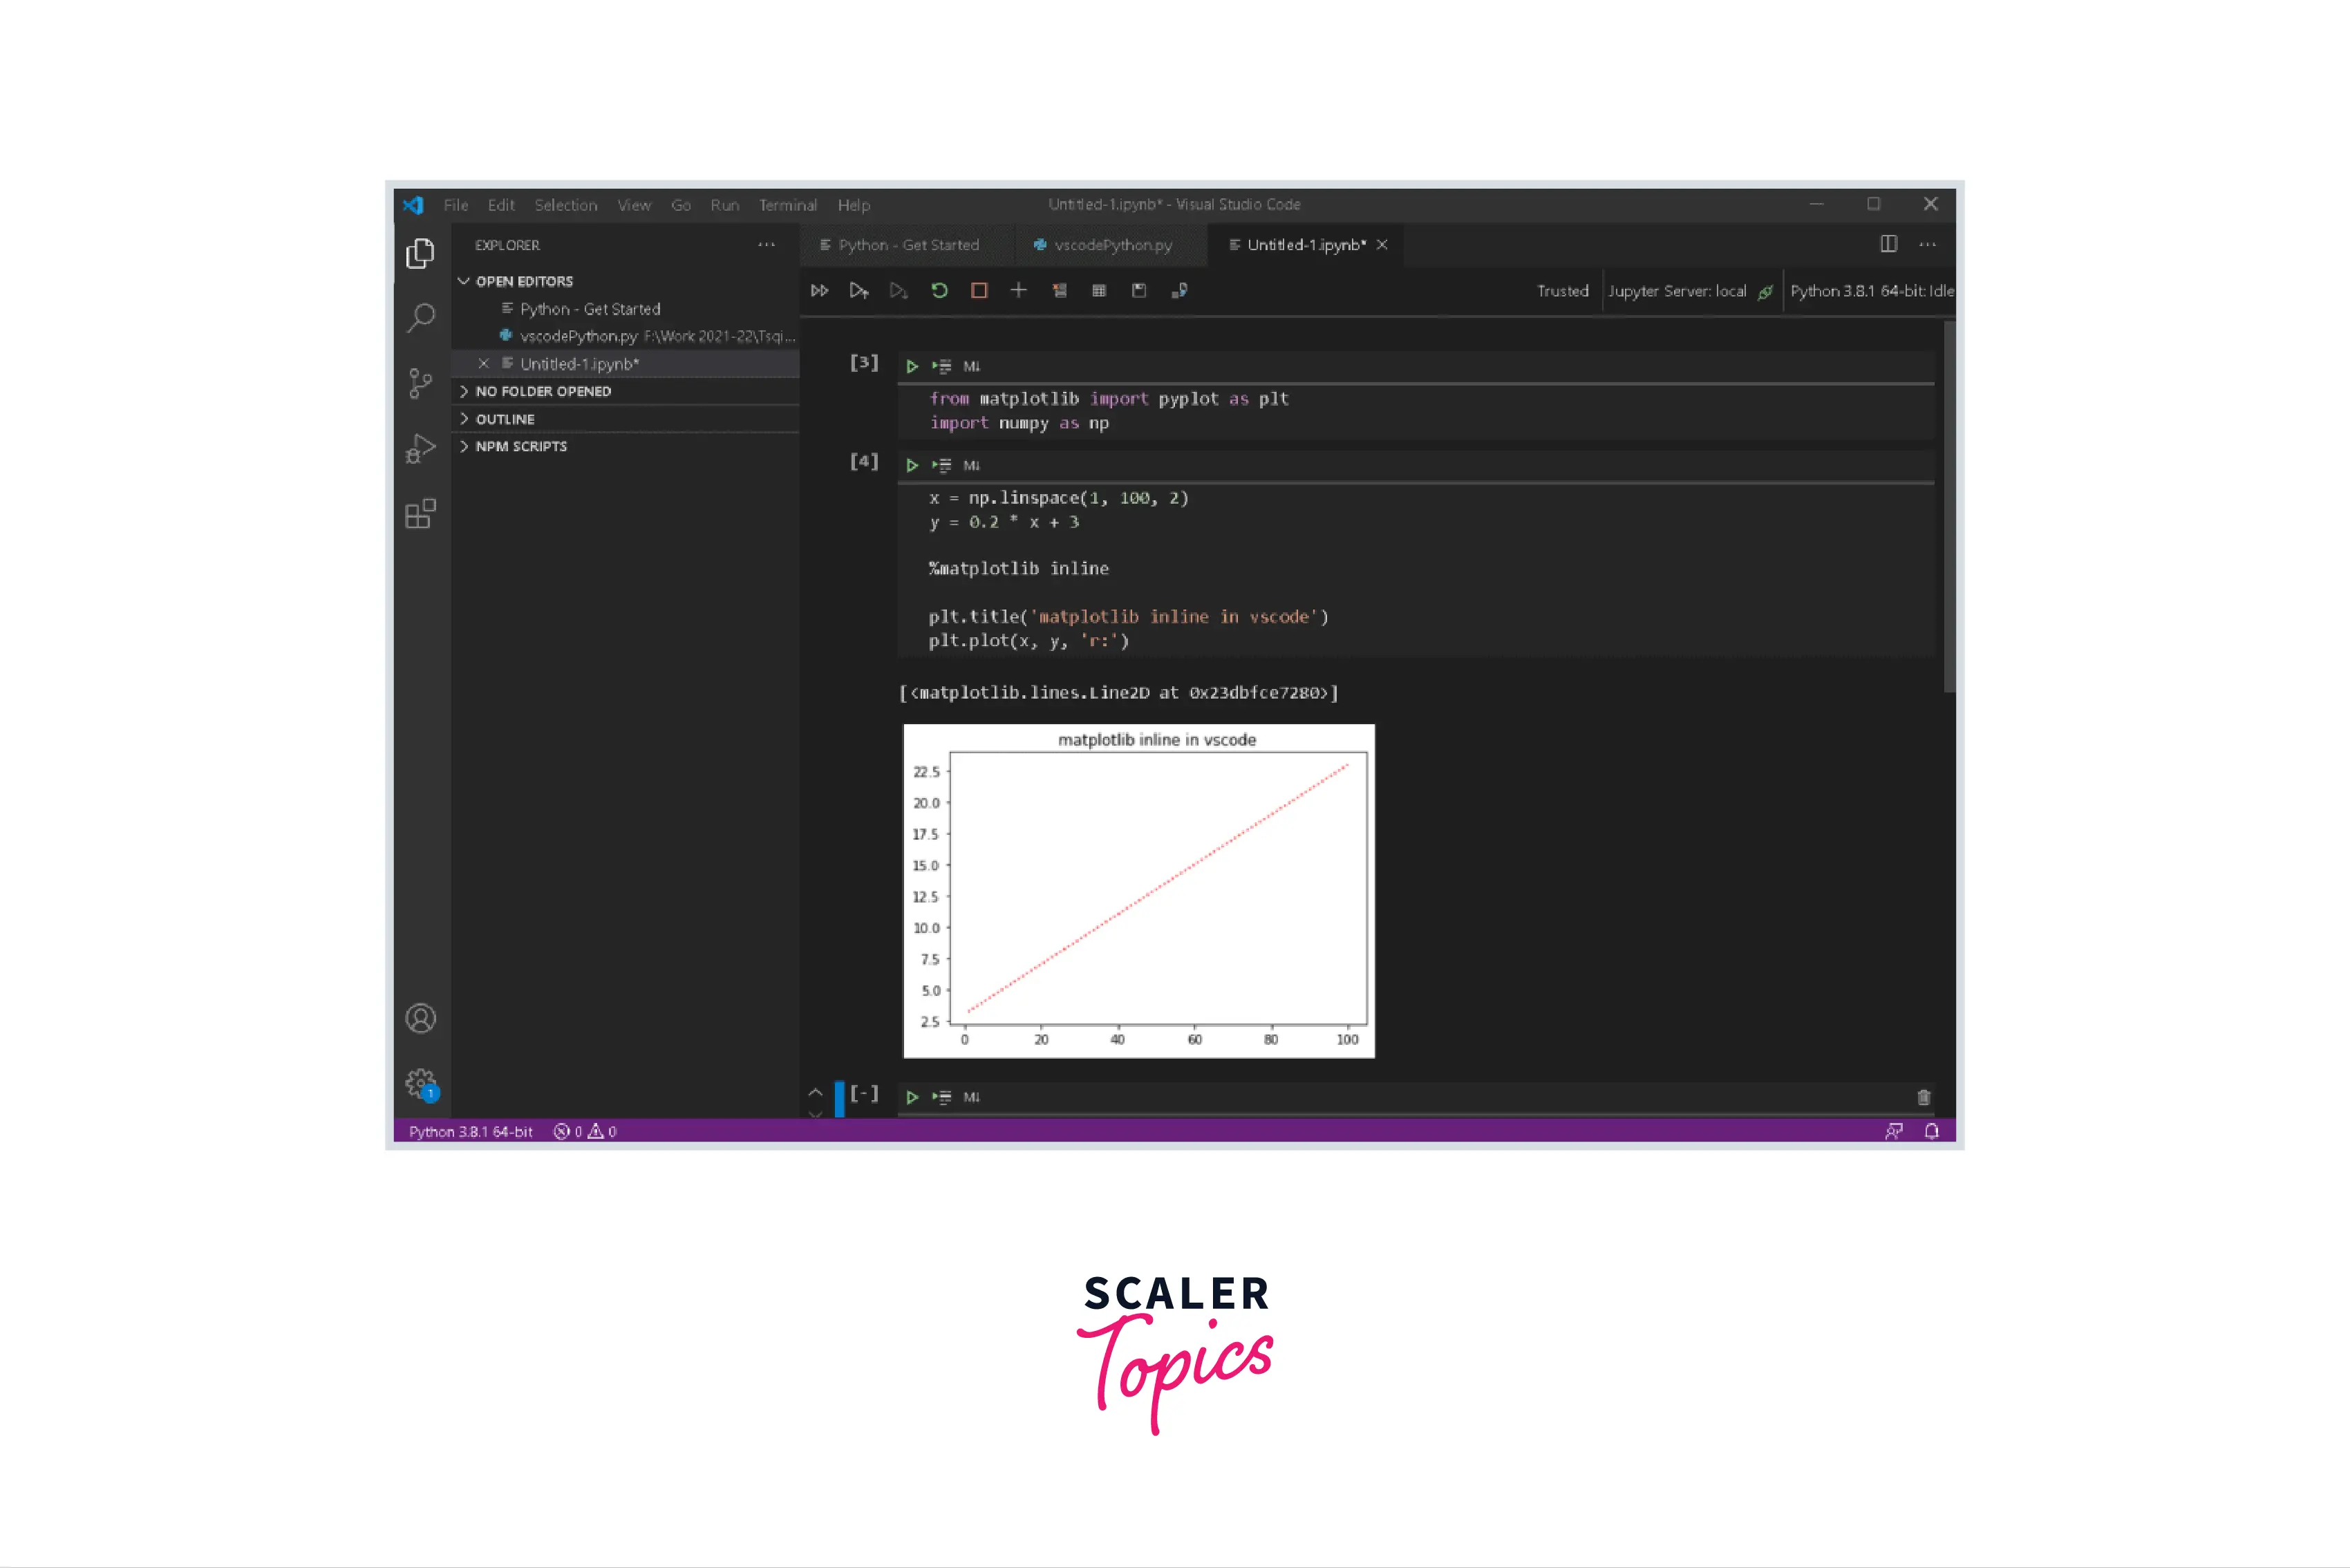
matplotlib inline in VSCode
To run the matplotlib inline magic command in Visual Studio Code, we need to install the Jupyter Notebook Extension from the Visual Studio Code extensions marketplace.

Once the extension is installed, we can create a new Jupyter notebook directly in Visual Studio Code.

Creating a new Jupyter Notebook enables the IPython session in the Visual Studio Code, and the magic commands can be used as in any other Jupyter notebook.
Example:
Output:
matplotlib inline vs matplotlib notebook
In the IPython shell, the line magic command matplotlib takes the back-end name as the argument. So far, we have been discussing the inline argument as a matplotlib backend; another argument notebook provides the plot in an interactive window.
As seen in the numerous previous examples, the matplotlib inline causes the plots to appear right below the cell.
The matplotlib notebook magic command does not only plots the graph below the cell; it also plots the graph in an interactive window. This interactive window allows graphs to be manipulated with features like zoom control, axis control, and many others.

Explore the Hands-on Applications of These Concepts in Our Data Science Courses. Enroll Now and Turn Theoretical Knowledge into Practical Mastery.
Conclusion
In this article, we have understood:
- The magic commands are used in the IPython environment to execute built-in functions.
- There are two types of magic commands:
- line magics
- cell magics
- The line magic command matplotlib inline configures the matplotlib back-end to plot the graphs below the cell.
- In the latest version of Jupyter Notebooks, the graphs are shown below the cell by default.
- In the syntax, the matplotlib line magic command takes the name of the back-end as an argument which can have values inline, notebook, qt, etc.
- We saw the representation of the matplotlib inline command in various IDEs:
- Jupyter Notebooks
- Google Colab
- PyCharm
- Spyder
- Visual Studio Code
- The command matplotlib notebook provides an interactive window for the plots.