How to Use LaTeX-style Notations in Matplotlib?
Overview
Matplotlib LaTex renders the text, mathematical expression, and special characters. Therefore, we can use LaTex in matplotlib for rendering characters. This can be done by activating LaTex by setting the text.usetex key to true. The string should be enclosed in a dollar sign for rendering the text using LaTex.
Transform Your Career
Choose from our industry-leading programs designed for career success
Modern Software and AI Engineering Program
Master full-stack development with AI integration

Modern Data Science and ML with specialisation in AI
Advanced data science techniques with AI specialization
Advanced AIML with Specialisation in Agentic AI
Deep dive into AIML with focus on Agentic systems
DevOps, Cloud & AI Platform Engineering
Build and manage AI-powered cloud infrastructure
AI Engineering Advanced Certification by IIT-Roorkee
Premier AI engineering certification from IIT-Roorkee
Introduction
Latex is a high-quality typesetting system for producing scientific and technical documentation. Matplotlib can use LaTex to render text. This is activated by setting text.usetex : True in your rcParams, or by selecting the usetex property to True on an individual Text object. Text handling through Matplotlib LaTex is slower than math text but is more flexible since different LaTex packages (font packages, math packages, etc.) can be used.
Text Rendering with LaTeX (Syntax and Some Use Cases)
Before we start text rendering with LaTex in matplotlib, we need to have the following packages installed in our system:
- LaTex system: A markup language that handles typesetting and rendering.
- DVI to PNG converter: This makes PNG graphics from DVI files obtained from TeX by producing anti-aliased screen-resolution images.
- Ghost script: An interpreter for the PostScript language and PDF.
By Default, LaTex is not installed in matplotlib, and we can install it from the given Link to use LaTex style notation in matplotlib.
Then, The next step is to tell our matplotlib to use LaTeX by setting text.usetex to True. We can do that either in our custom .matplotlibrc inside our home directory (/home/<user>/.matplotlibrc on Unix-based systems, or C:\Documents and Settings\<user>\.matplotlibrc) via rcParams['text'], or by using the following code:
Syntax for the text rendering in LaTex:
We can also change the font of the rendered text in LaTex. Here is an example of the same
To render the mathematical text in LaTex, we have to enclose the LaTex code in dollar signs. For Example,
Output:

Code explanation:
- Importing the required module.
- Improving the plot's resolution by using the function matplotlib.pyplot.figure(dpi=) to get better clarity.
- Activating the text rendering by latex by updating the value of key text.usetex to True and also changing the font from sans-serif to monospace and fonts to Computer Modern Typewriter so that we can see the new effect on the rendered text.
- Generating evenly spaced integers from 1 to 20 using the function numpy.arange(low, high, interval) and store it in the list x.
- Then list y contains the data points according to the equation.
- Using the matplotlib.pyplot.text() function adding text to the specified coordinates, which has been rendered using LaTex
- Then we set title, x-label, and y-label to add details to the plot by using the function matplotlib.pyplot.title(), matplotlib.pyplot.xlabel() and matplotlib.pyplot.ylabel() respectively.
- At last, plot the points on the graph.
Example: Text rendering in LaTex
Output:
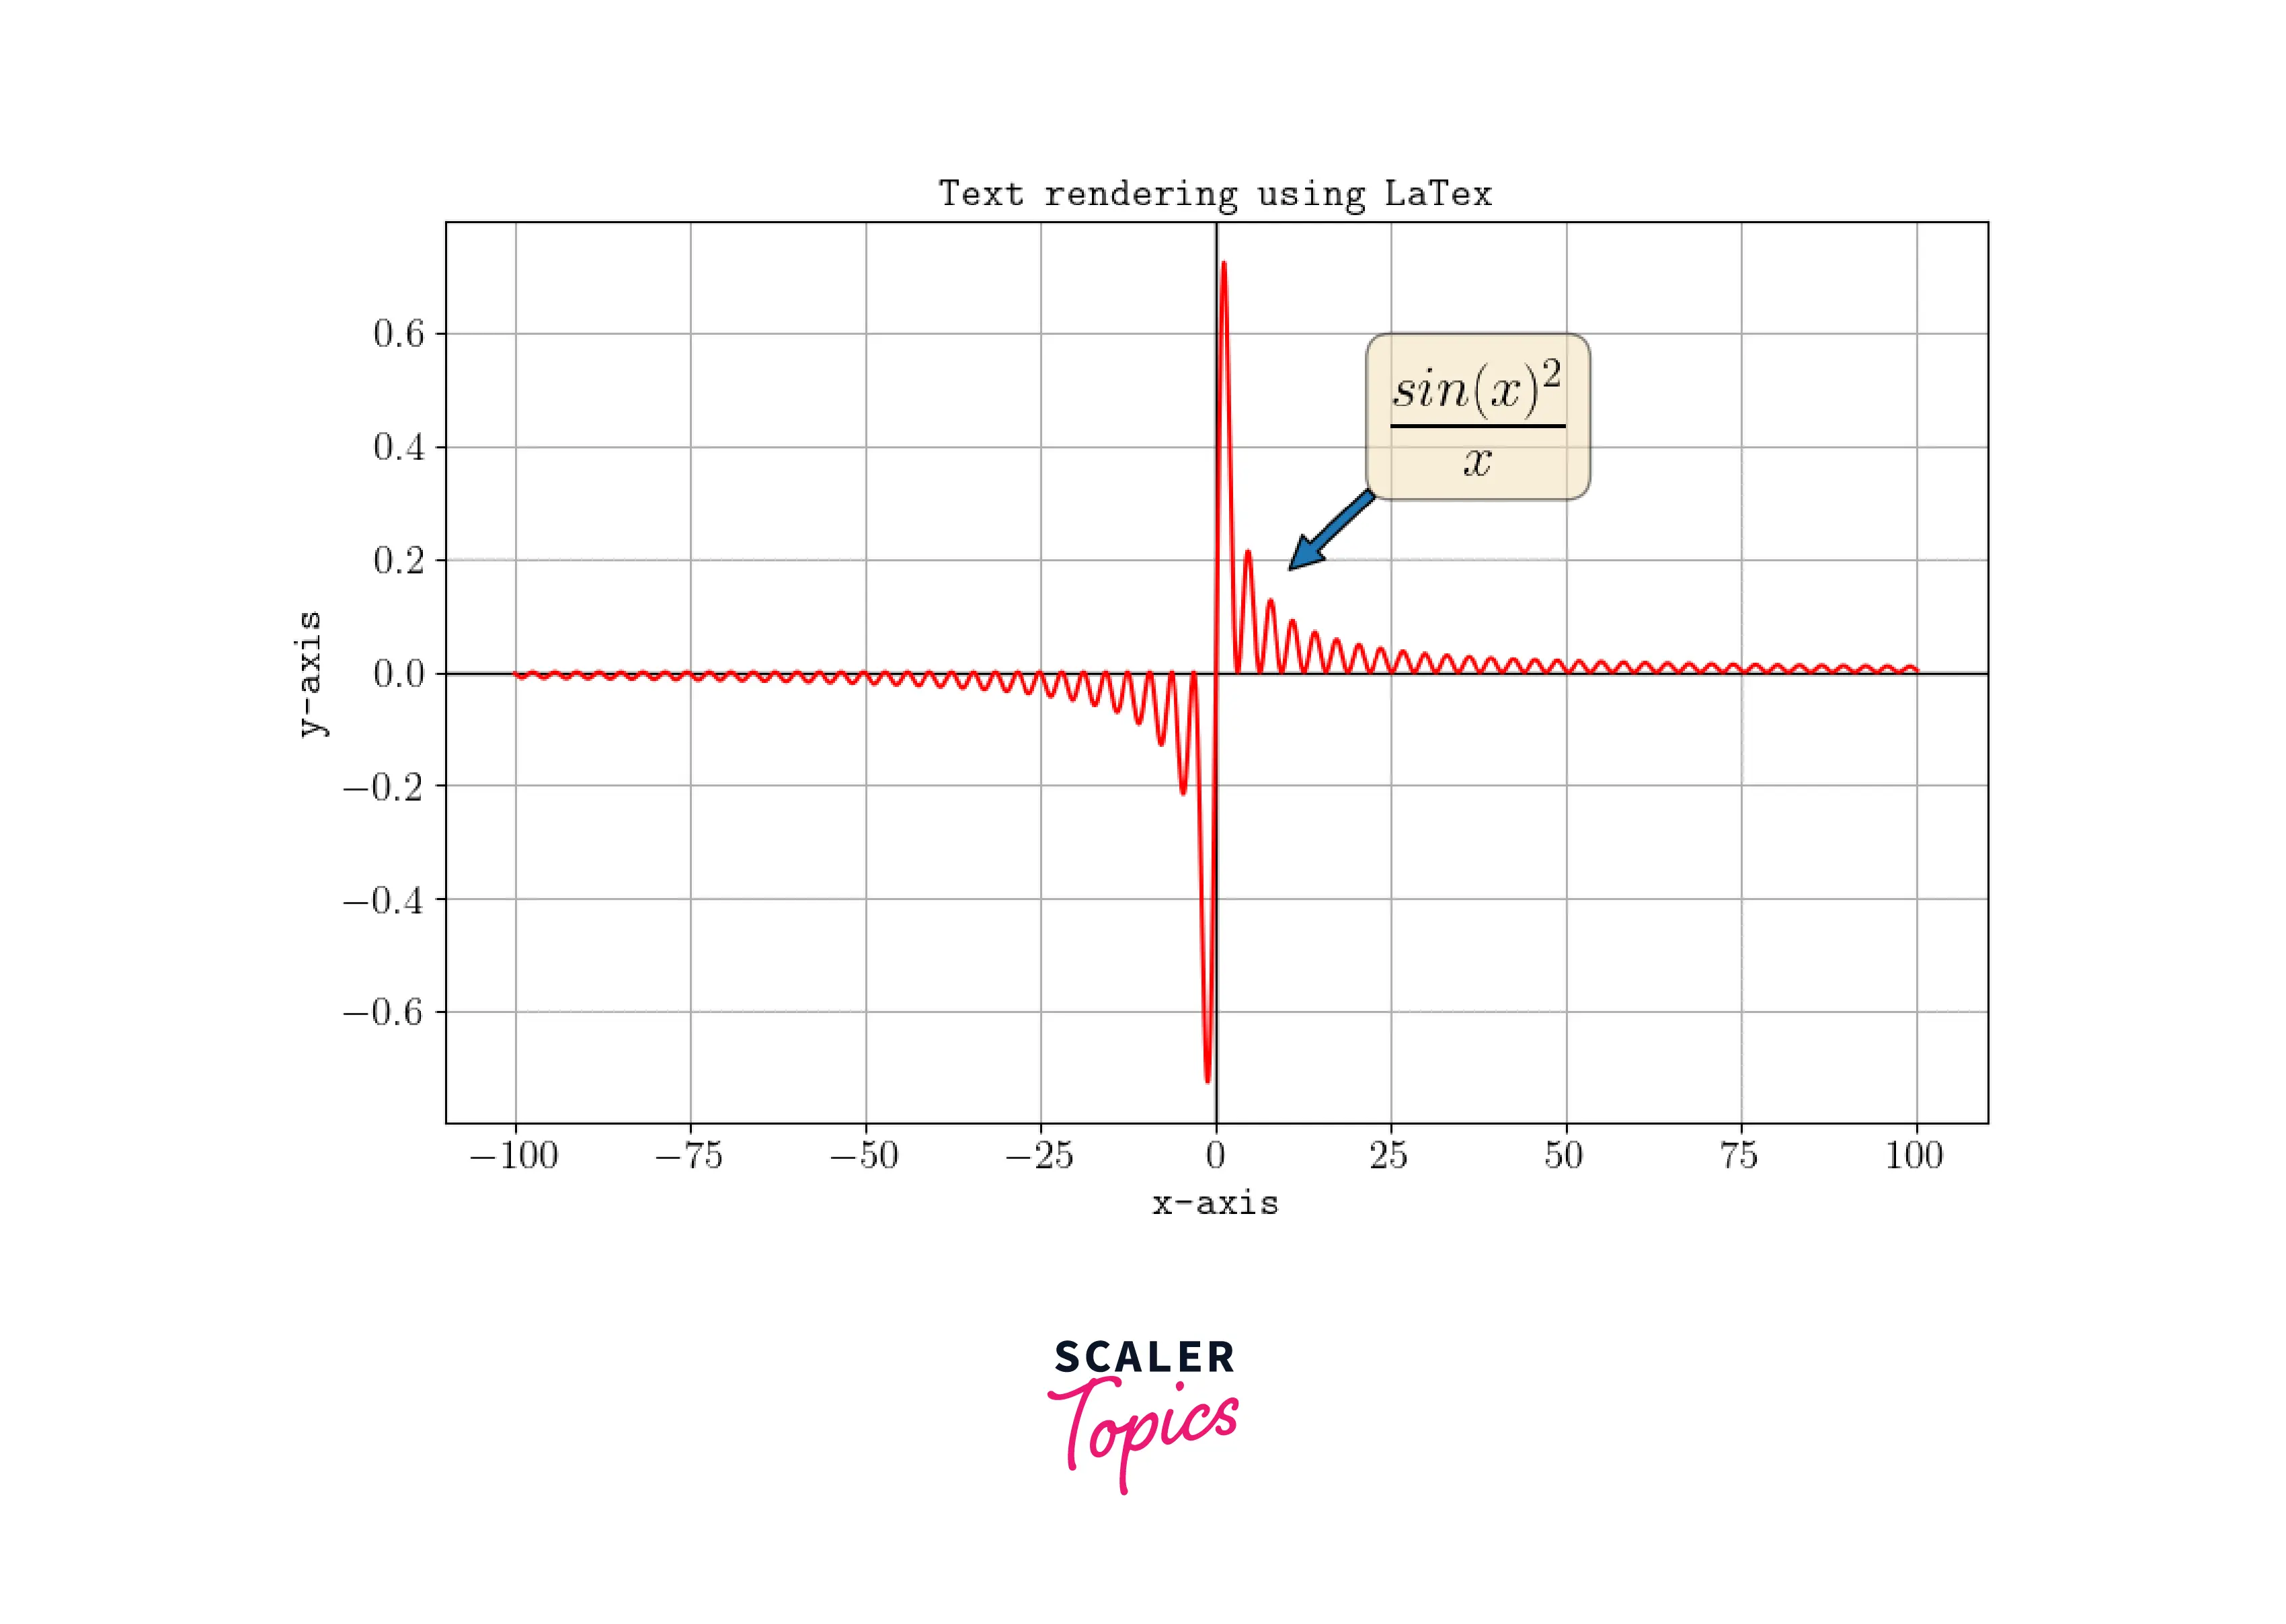
Code Explanation:
- Importing the required module.
- Increasing the plot's resolution using the matplotlib.pyplot.figure() function.
- Activating the text rendering by latex by updating the value of key text.usetex to True and also changing the font from sans-serif to monospace and fonts to Computer Modern Typewriter so that we can see the new effect on the rendered text.
- Generating a list of evenly spaced numbers using the function numpy.arange(low, high, interval) and store it in the list x.
- Generating the y-axis data points from the x-axis data point and storing it in the list a.
- To add a box to a text, we use a dictionary with keys like box style, face color, and alpha to change its visual appearance.
- matplotlib.pyplot.annotate() function adds arrows and text at the specified coordinates to show the rendered text.
- matplotlib.axhline() and matplotlib.axvline() add horizontal and vertical lines to the plot.
- matplotlib.xticks() and matplotlib.yticka() are used to scale the ticks on the x-axis and y-axis, respectively.
- Then to add more details to the plot we use matplotlib.pyplot.title(), matplotlib.xlabel(), and matplotlib.pyplot.ylabel().
Writing Mathematical Expression (Use Cases)
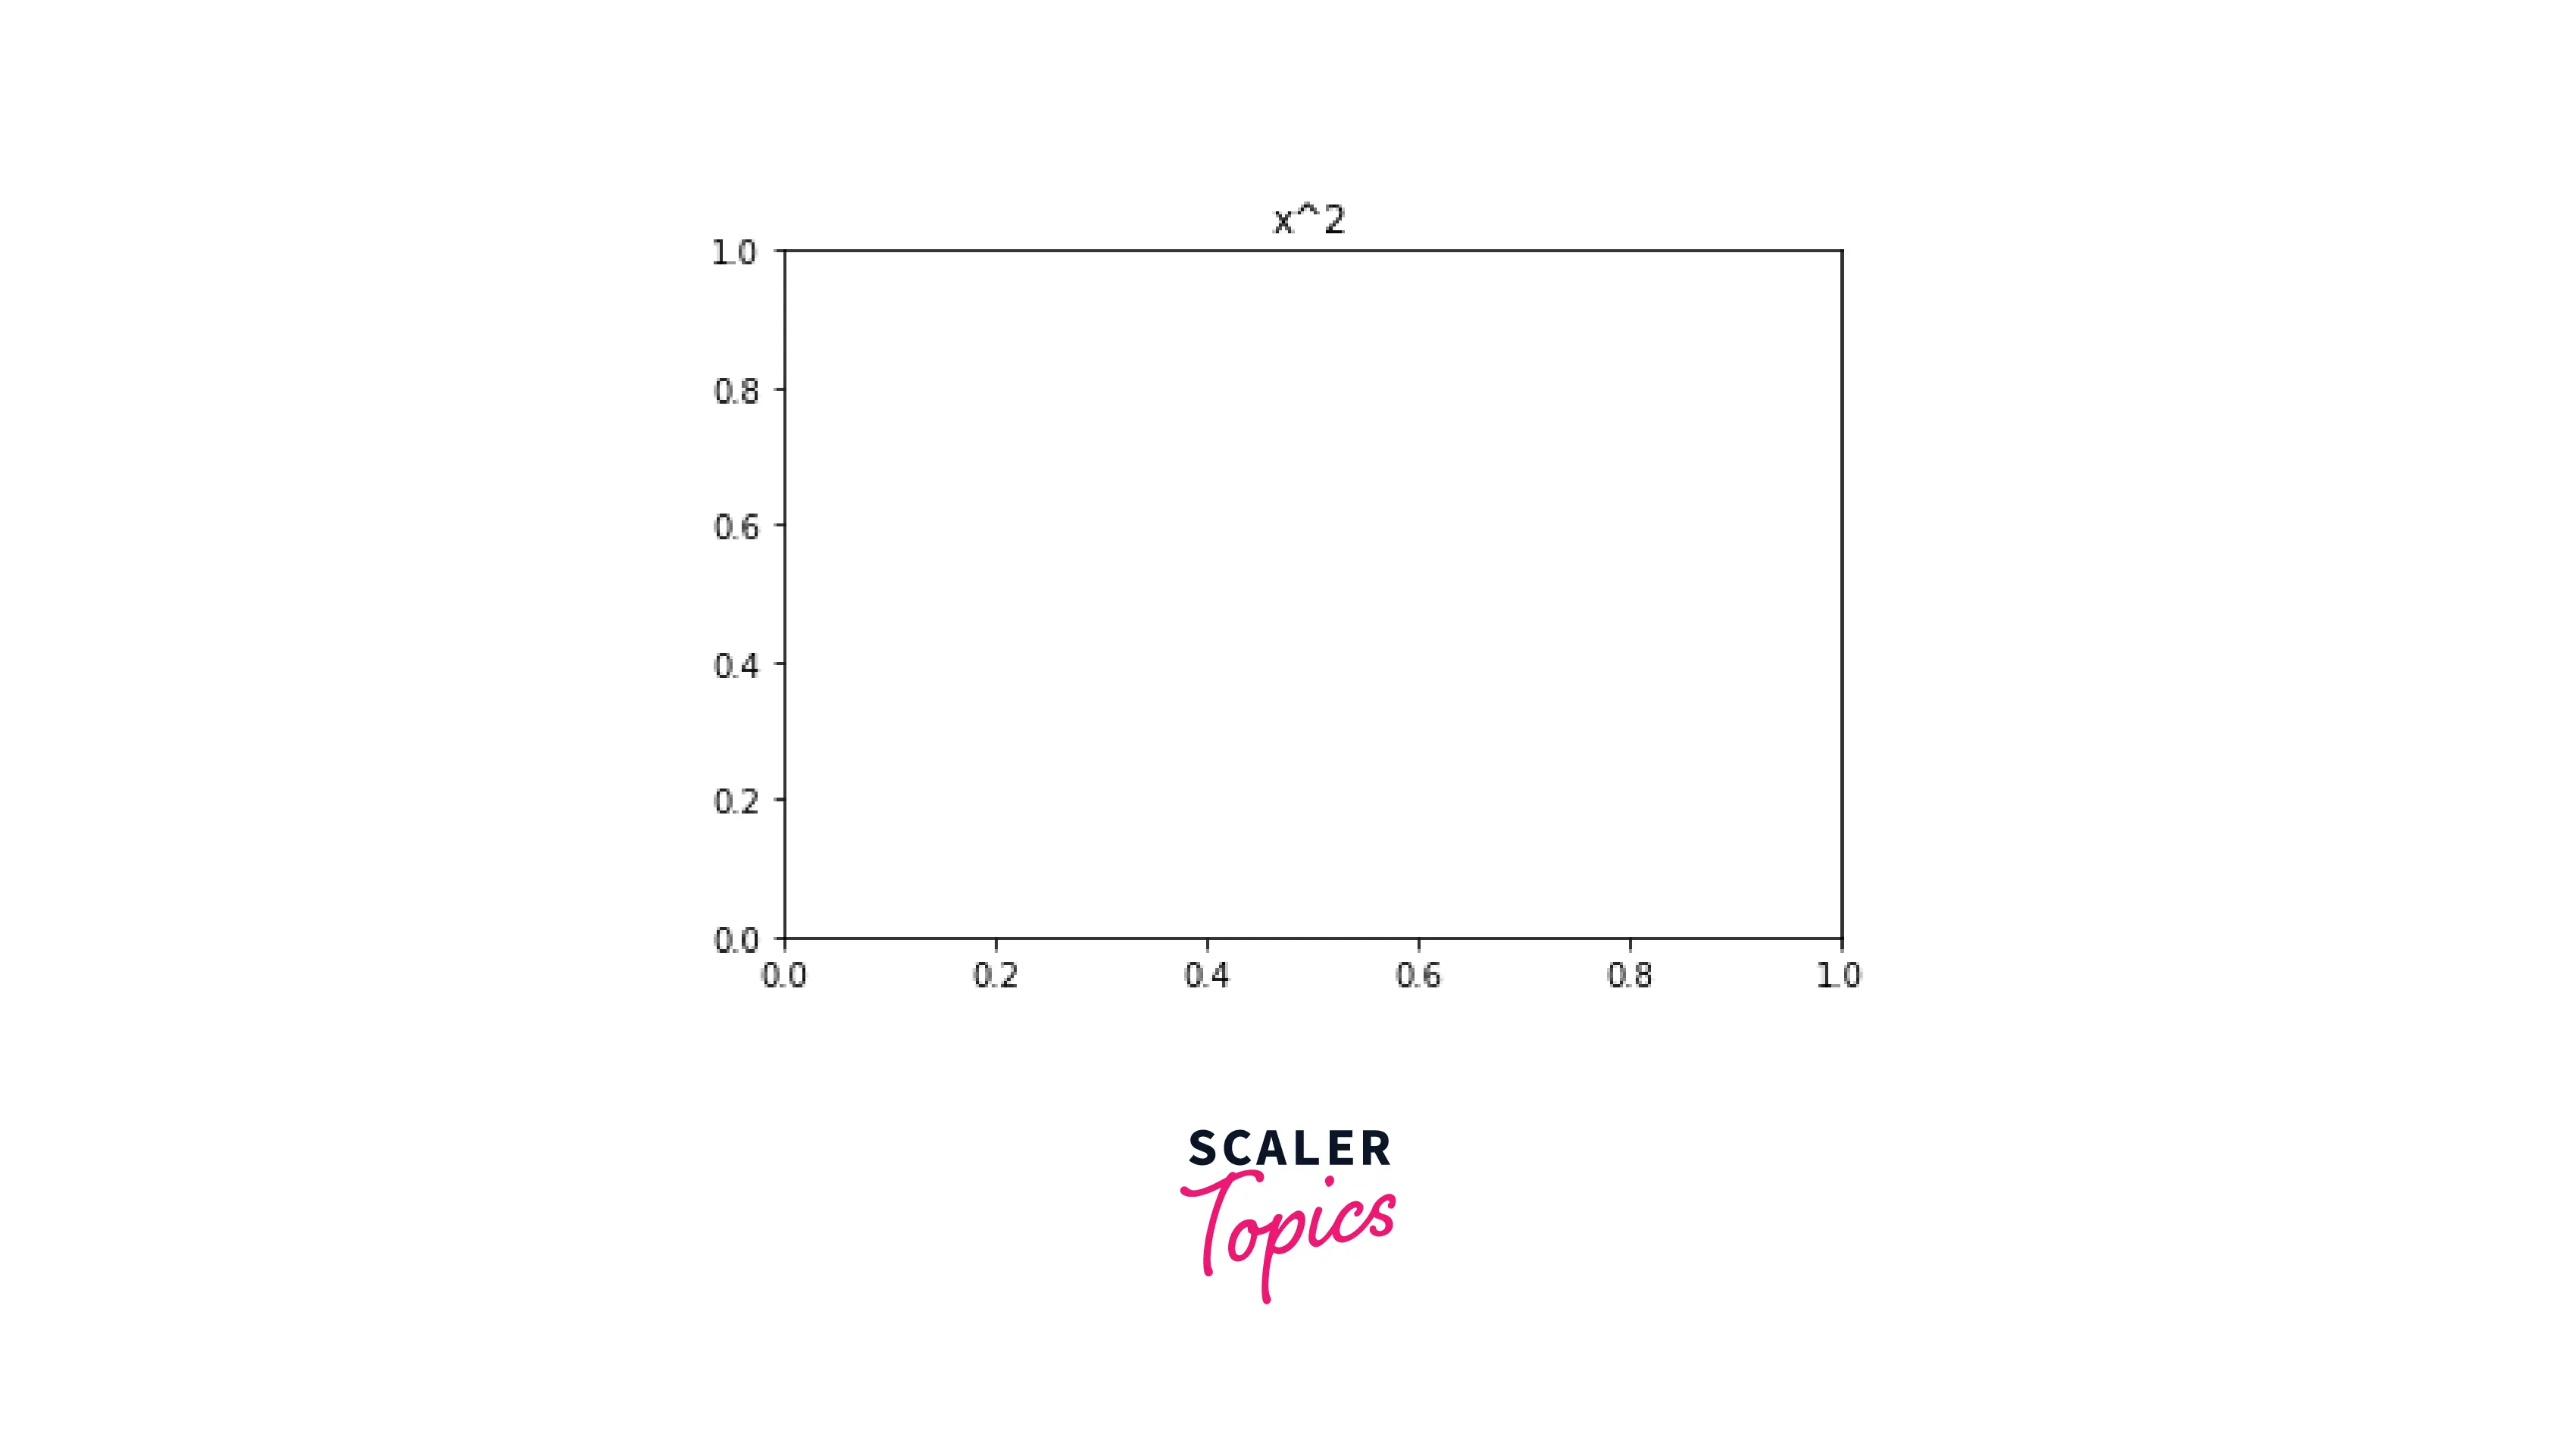
Using Tex, we can also render mathematical expressions in matplotlib by setting rcParams[text.usetex] to True. This requires that you have TeX and other dependencies (LaTex installation as mentioned above in the paragraph: text rendering with LaTex). We can render mathematical expressions stored in a string that precedes the quotes with an 'r' and surround the math text with dollar signs ($). Regular text and mathematical expressions can be written in the exact string. Math text can use DejaVu Sans (default), DejaVu Serif, the Computer Modern fonts (from (La)TeX), STIX fonts (which are designed to blend well with Times), or a Unicode font that you provide. If we do not put a dollar sign at the starting and end of the string, it will be visible as an ordinary string, For example.
Output:
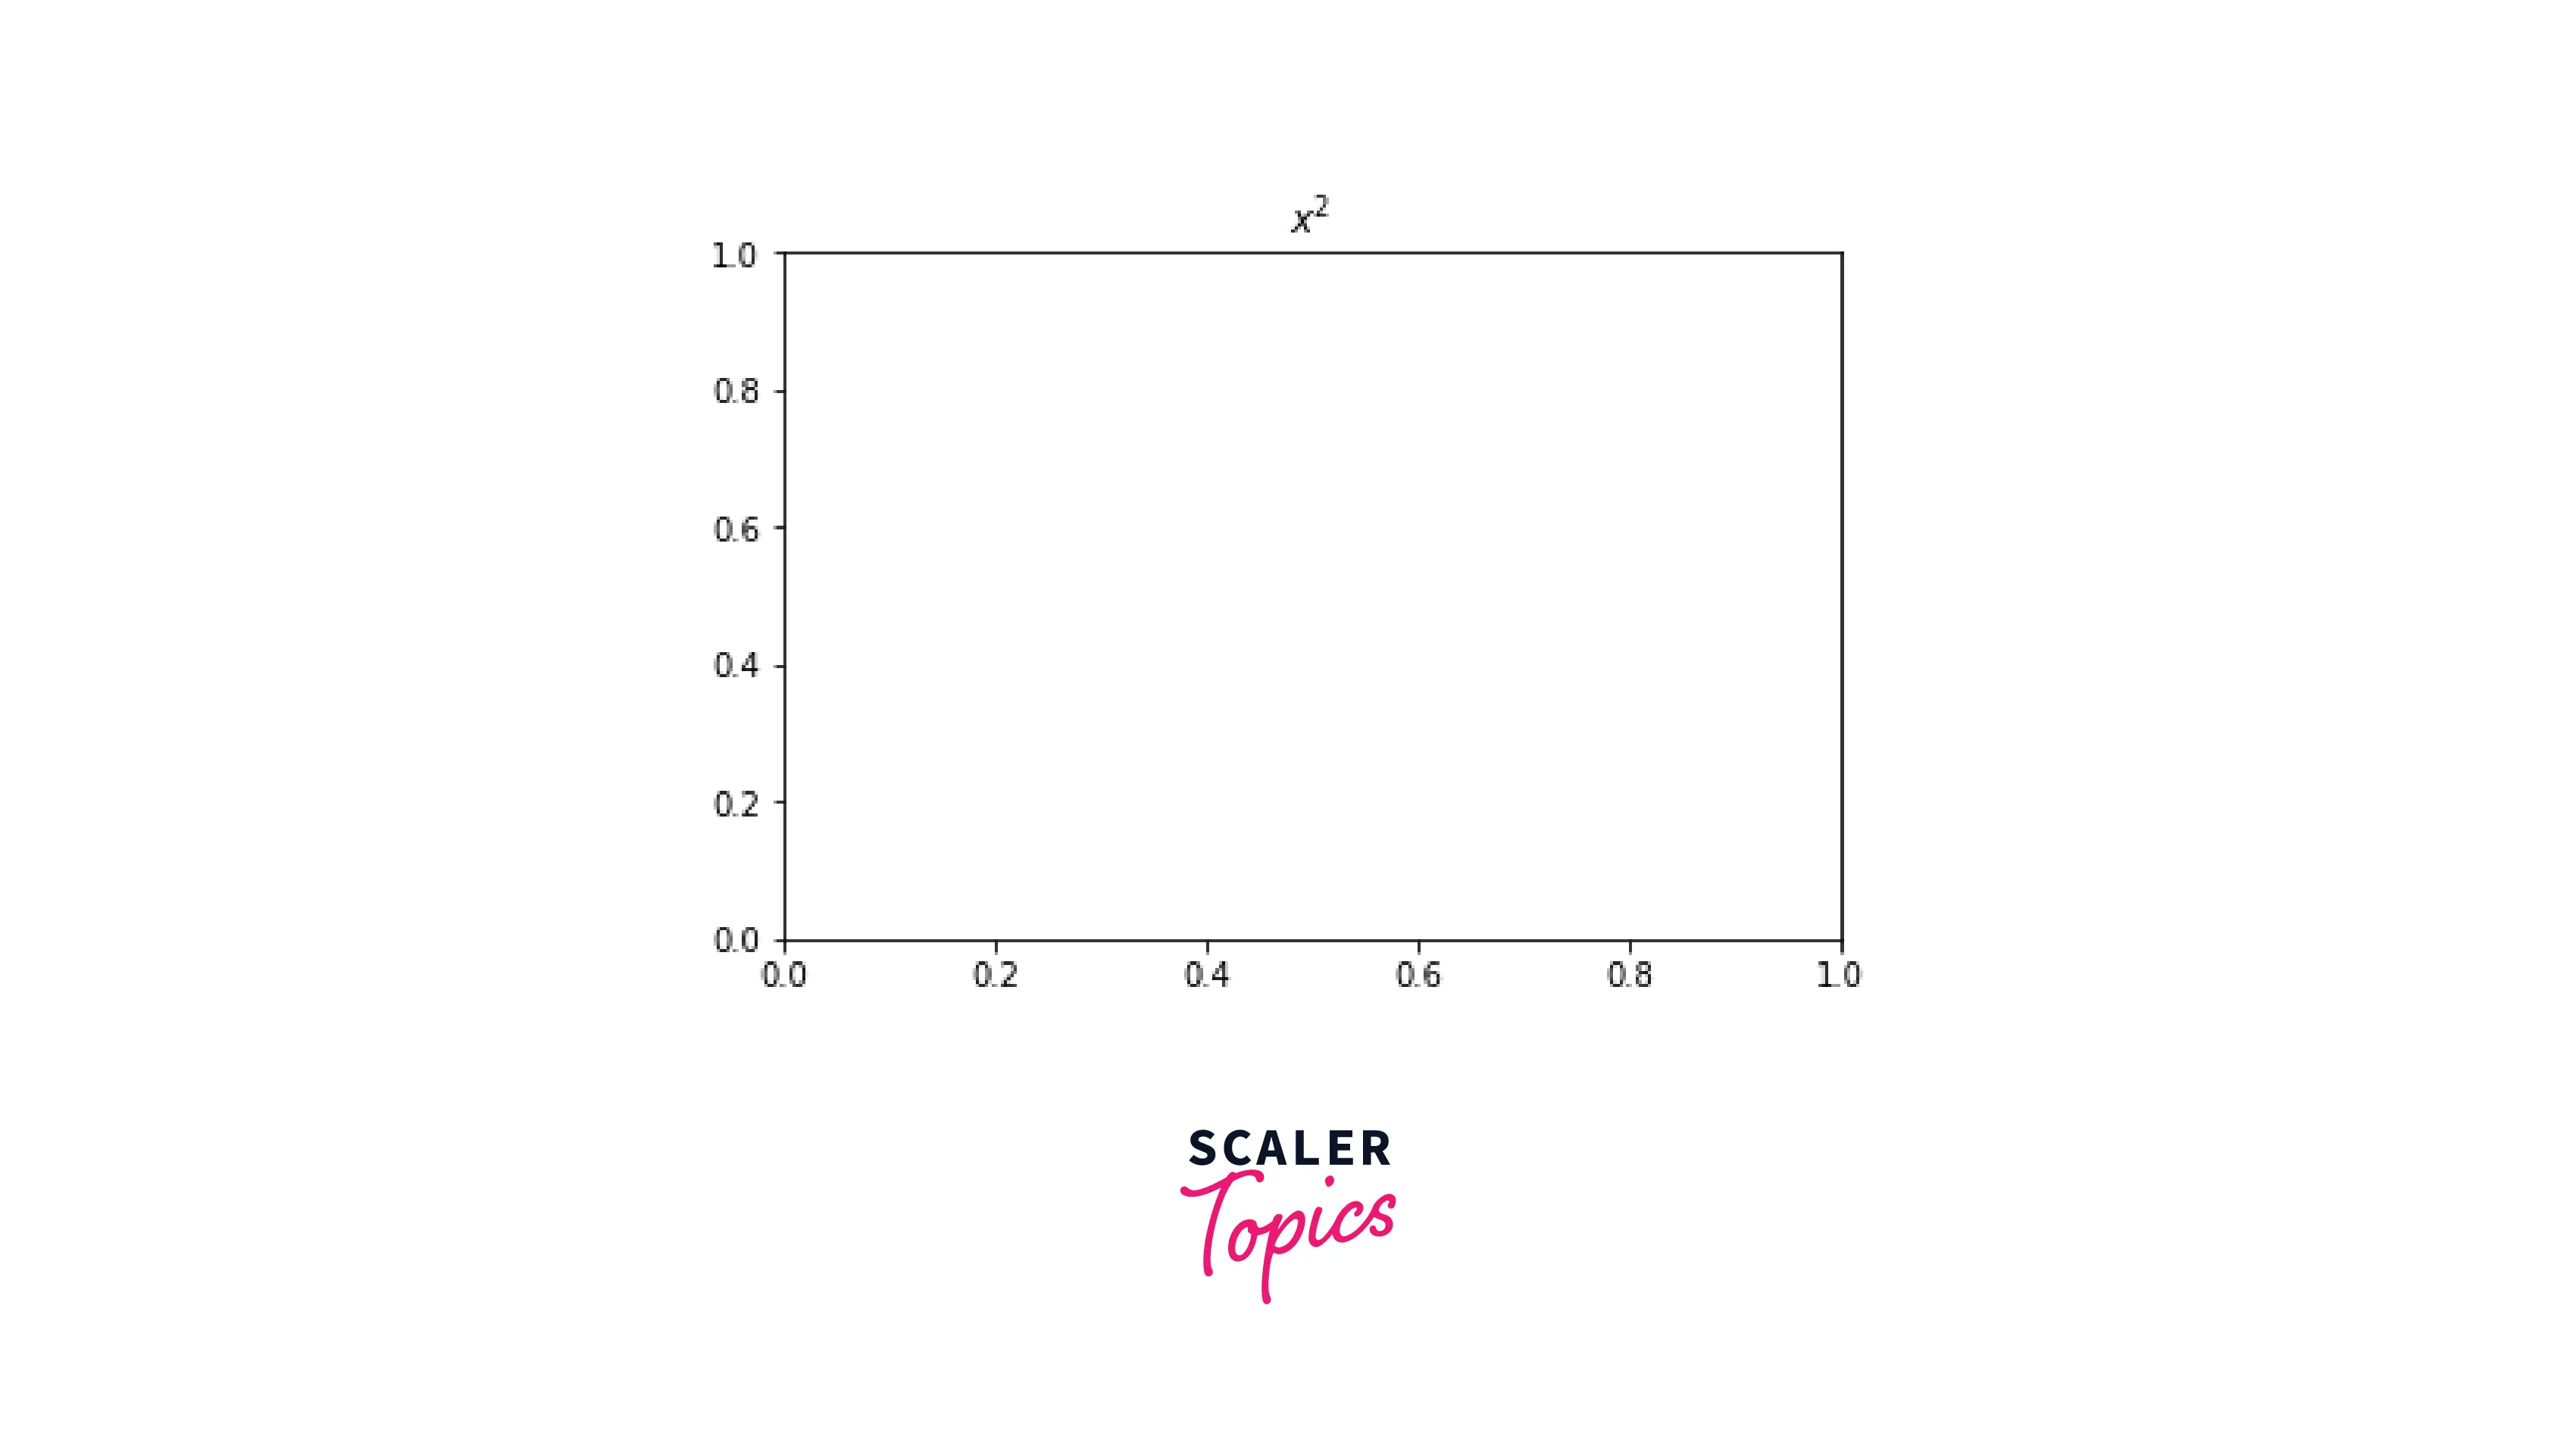
Whereas putting a dollar sign will render the text as Math text.
Output:
Scaler Placement Report and Statistics
Scaler learners achieved 2.5x salary growth with average post-Scaler CTC reaching ₹23L.
Subscripts and superscripts
To make subscripts and superscripts in matplotlib, we use - and ^ symbols, respectively:
Example: Subscripts
Output:

Example: Superscripts
Output:

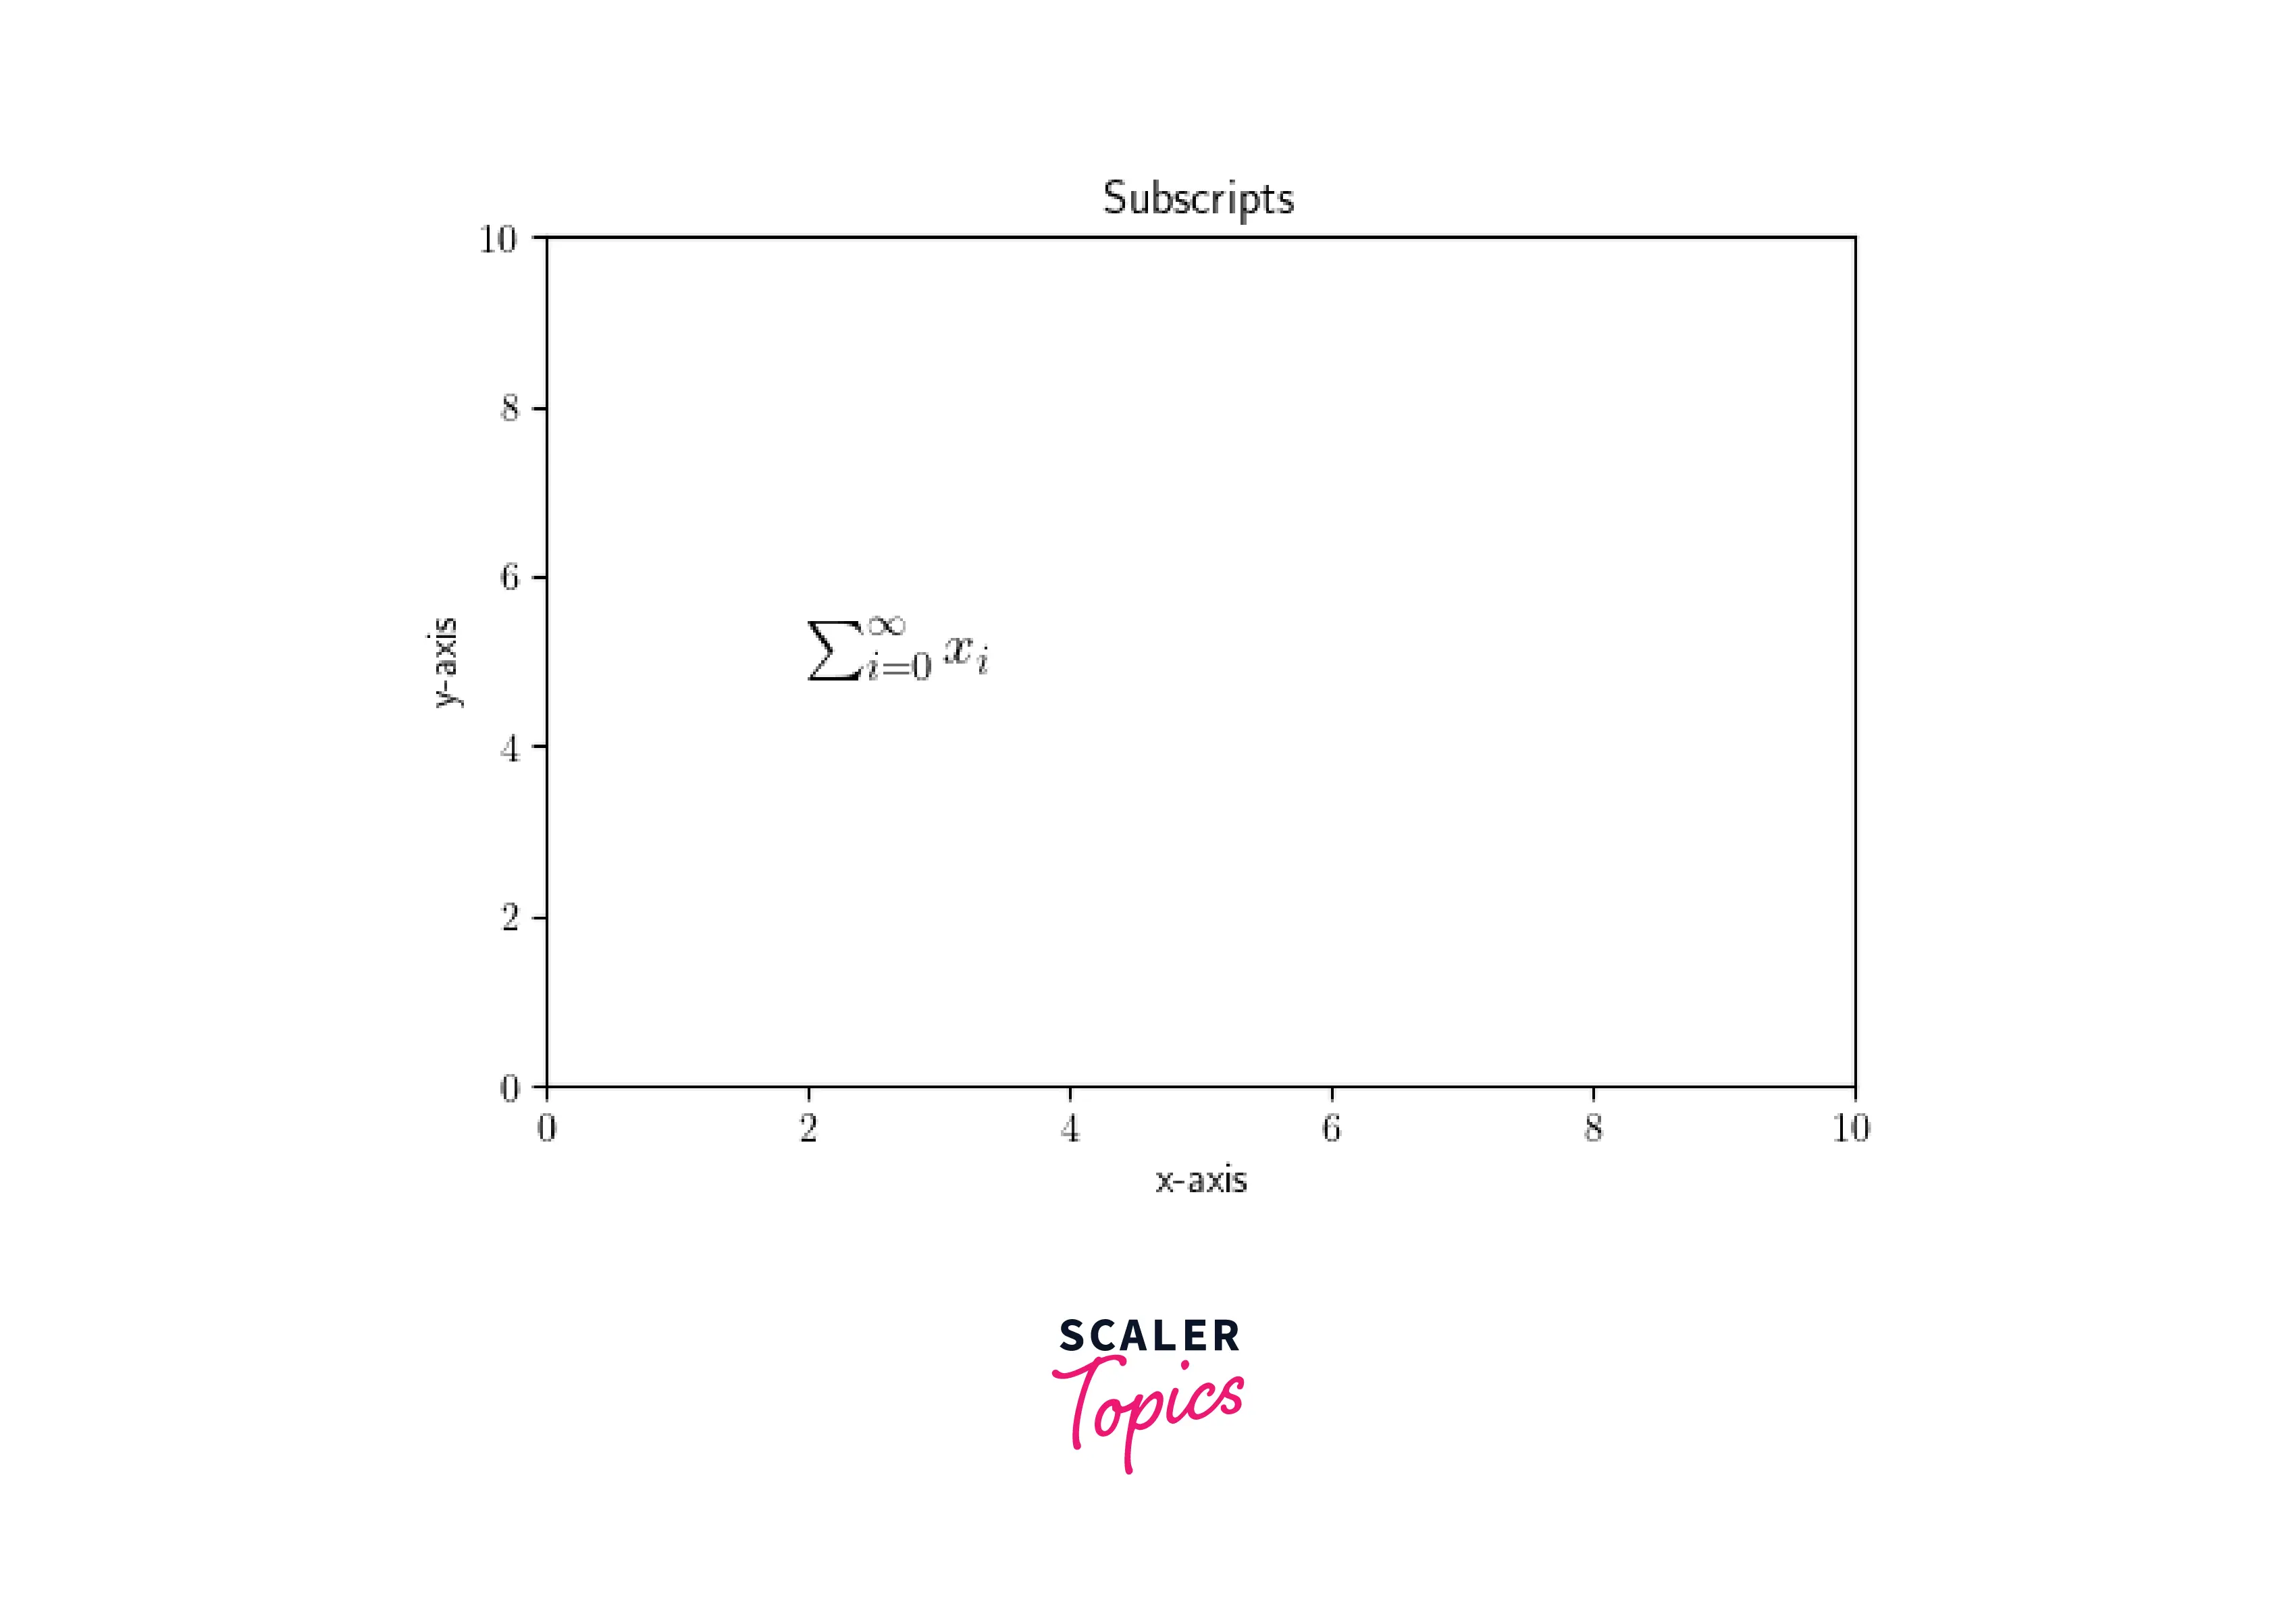
Example: Summation notation
Output:
Fractions and Radicals
Fractions and radicals can also be rendered using Latex. Here is the syntax. Fractions \frac{}{} Radicals \sqrt[]{}
Example: Showing Fractions and Radicals on a plot
Output:

Conclusion
- LaTex renders the text, mathematical expression, and special character in matplotlib.
- This can be activated by setting text.usetex to true in rcParams.
- Before starting working with Matplotlib LaTex, we need to install it because it is not pre-installed with matplotlib.
- We can render text with LaTex, and also, we can change its font.
- Math text with Matplotlib Latex should be stored in the string and enclosed in the dollar sign to render the special characters.