How to Add a Matplotlib Legend on a Figure?
Overview
In our life, all of us have either seen or read a map. A map helps us find directions from point A to point B. Suppose you want to find out if a hospital is nearby. Your first approach would be to check the map. But how will you check if there's a hospital near you? That's where legends come into play. The symbols, forms, and colors used on a map are explained in a side table or box called a map legend. In this article, we will go over what legends are in matplotlib and how they help us to understand our plot in a better way.
Legend in Matplotlib
In matplotlib, a legend is a section describing the graph’s components. It helps us understand the various curves and plots in our figures. To work with legends in matplotlib, we have the legend() function. Legends in matplotlib are very beneficial when working with huge plots. If we have a complicated plot, putting up legends is a great idea as it reduces the search time for different attributes of the plot. Further in this article, we will go over the various operations we can perform when it comes to legends.
Transform Your Career
Choose from our industry-leading programs designed for career success
Modern Software and AI Engineering Program
Master full-stack development with AI integration

Modern Data Science and ML with specialisation in AI
Advanced data science techniques with AI specialization
Advanced AIML with Specialisation in Agentic AI
Deep dive into AIML with focus on Agentic systems
DevOps, Cloud & AI Platform Engineering
Build and manage AI-powered cloud infrastructure
AI Engineering Advanced Certification by IIT-Roorkee
Premier AI engineering certification from IIT-Roorkee
How to add Legend to a Figure in Matplotlib?
- Before learning how to add a legend to a figure, let's first understand the different parameters that go in a legend:
| Terms | Definition |
|---|---|
| Legend Entry | One or more legend entries compose a legend. One key and one label make up one entry exactly. |
| Legend Key | The Key is referred to the colored marker on the left of a legend label. |
| Legend Label | The text that explains the key's handle is meant to represent. |
| Legend Handle | The initial item from which a suitable entry in the tale is created. |
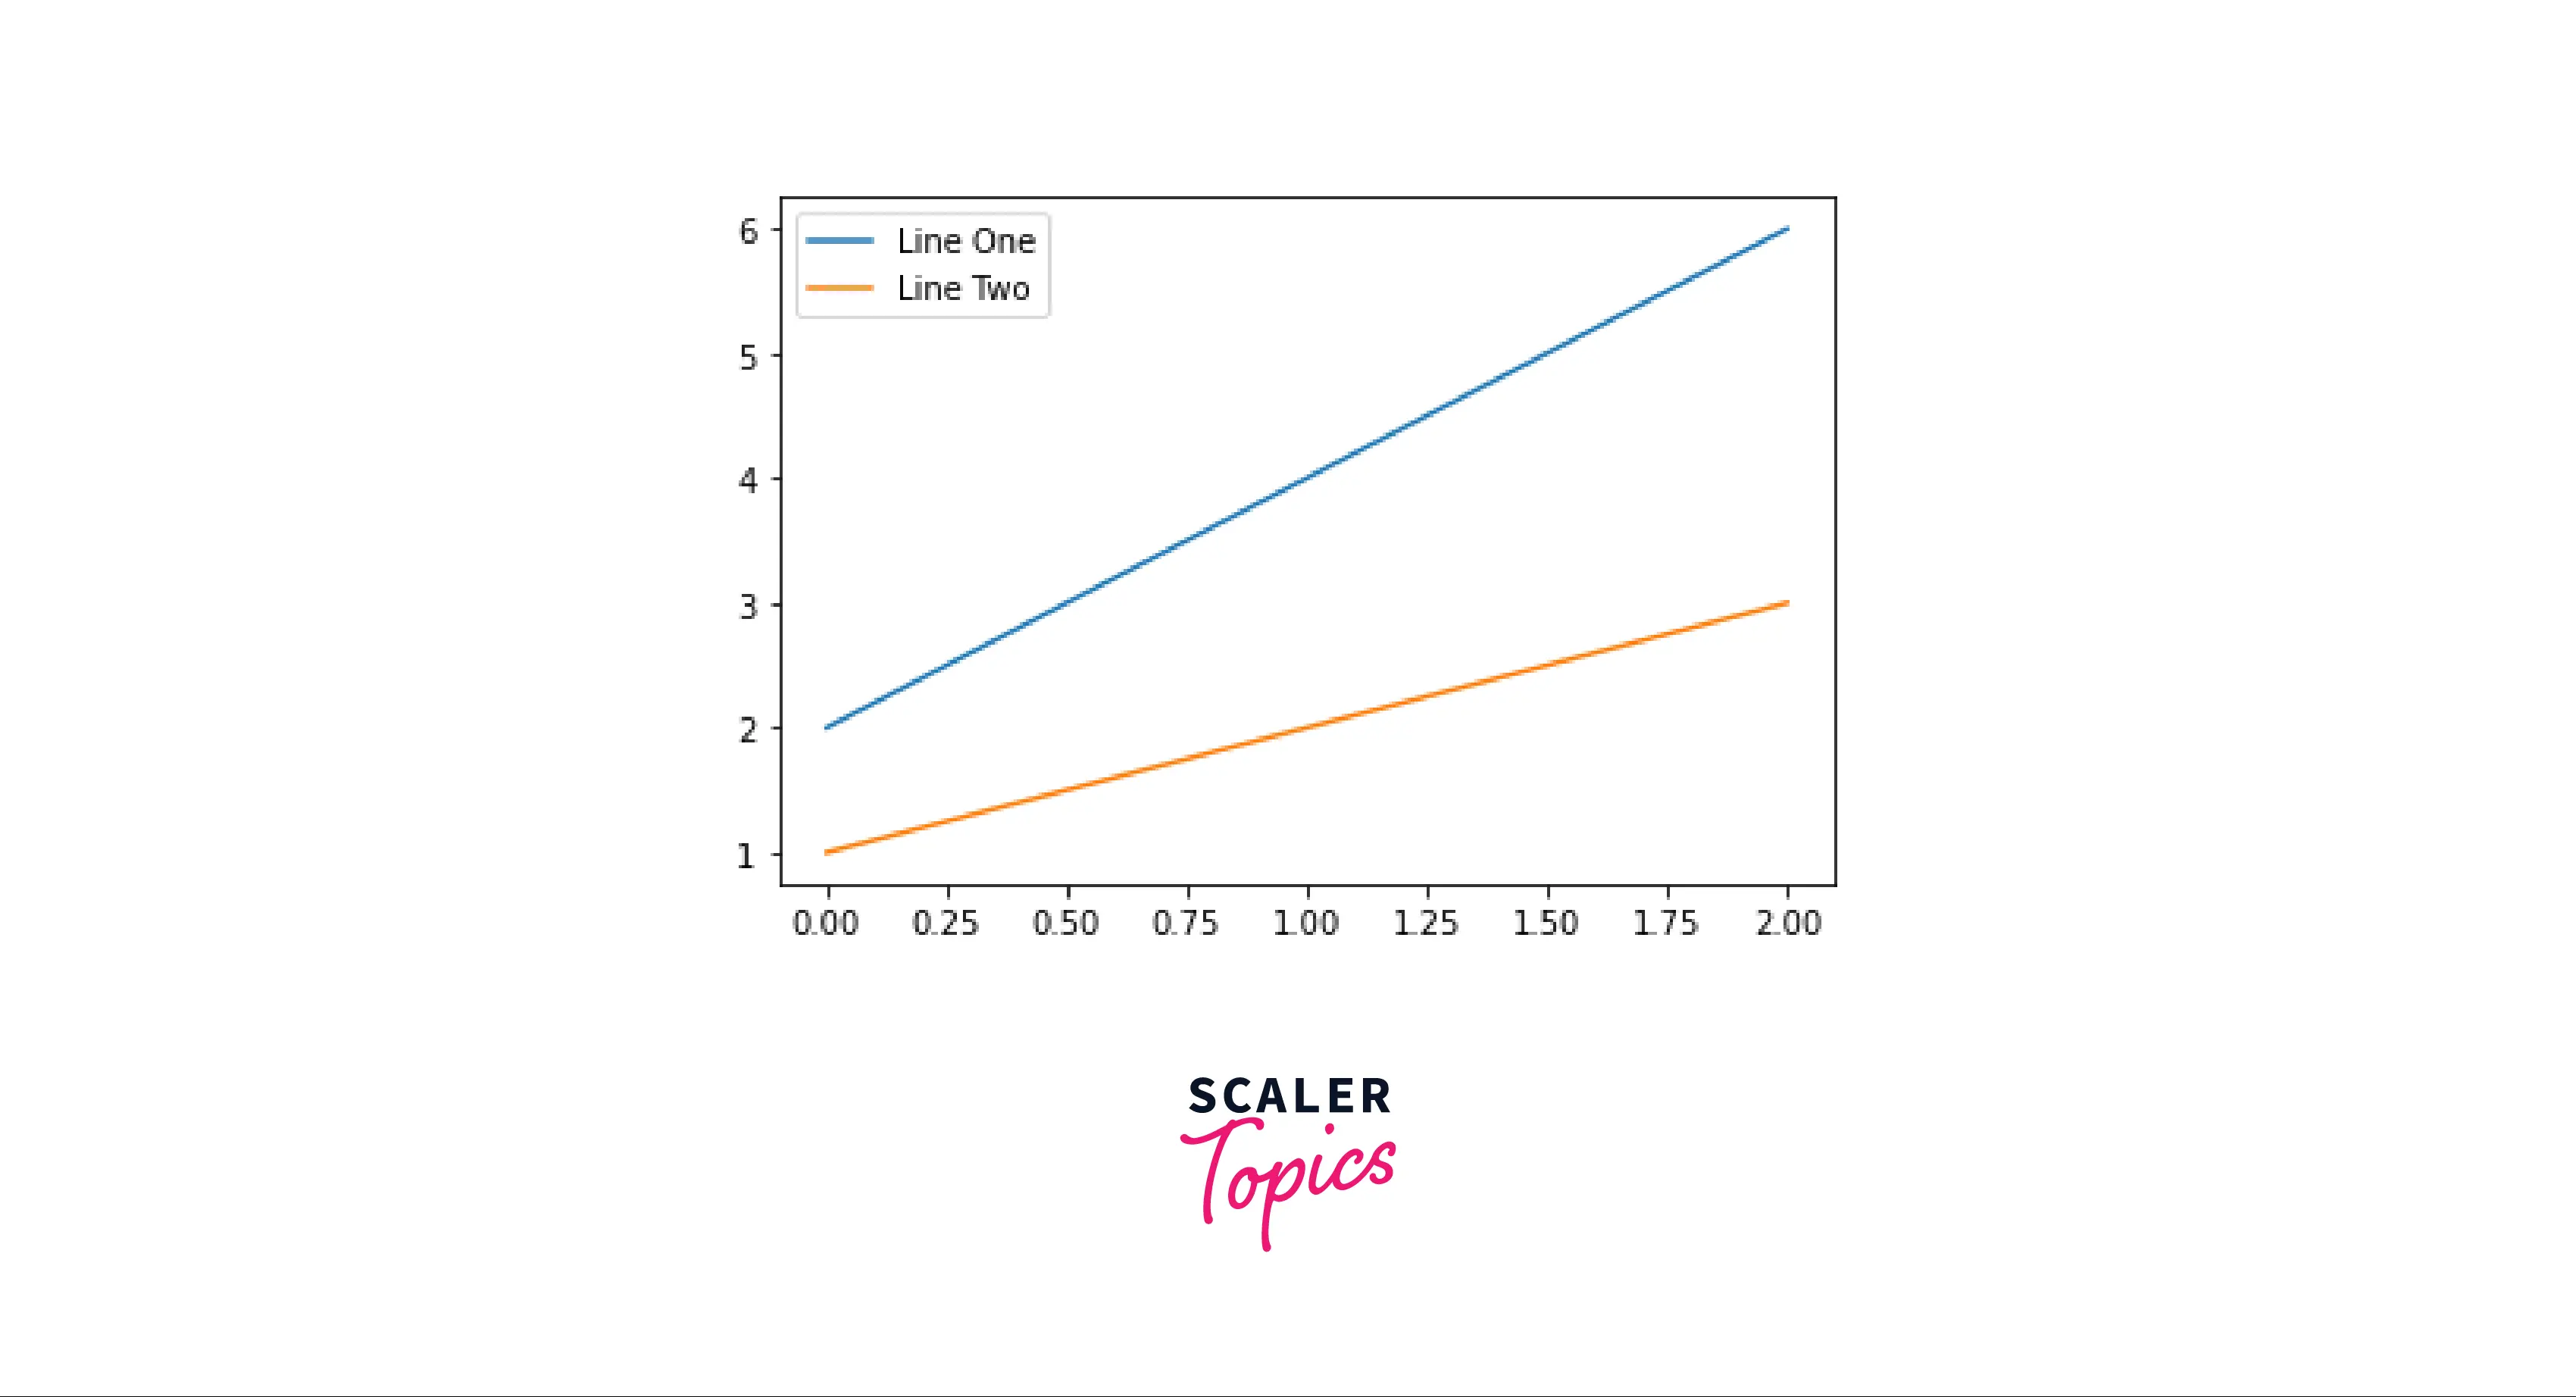
We can add a legend to our figure in matplotlib using the legend() function. In the legend() function, we can pass the lines we want to see.
Output:
Scaler Placement Report and Statistics
Scaler learners achieved 2.5x salary growth with average post-Scaler CTC reaching ₹23L.
How to Customize Legend in Matplotlib?
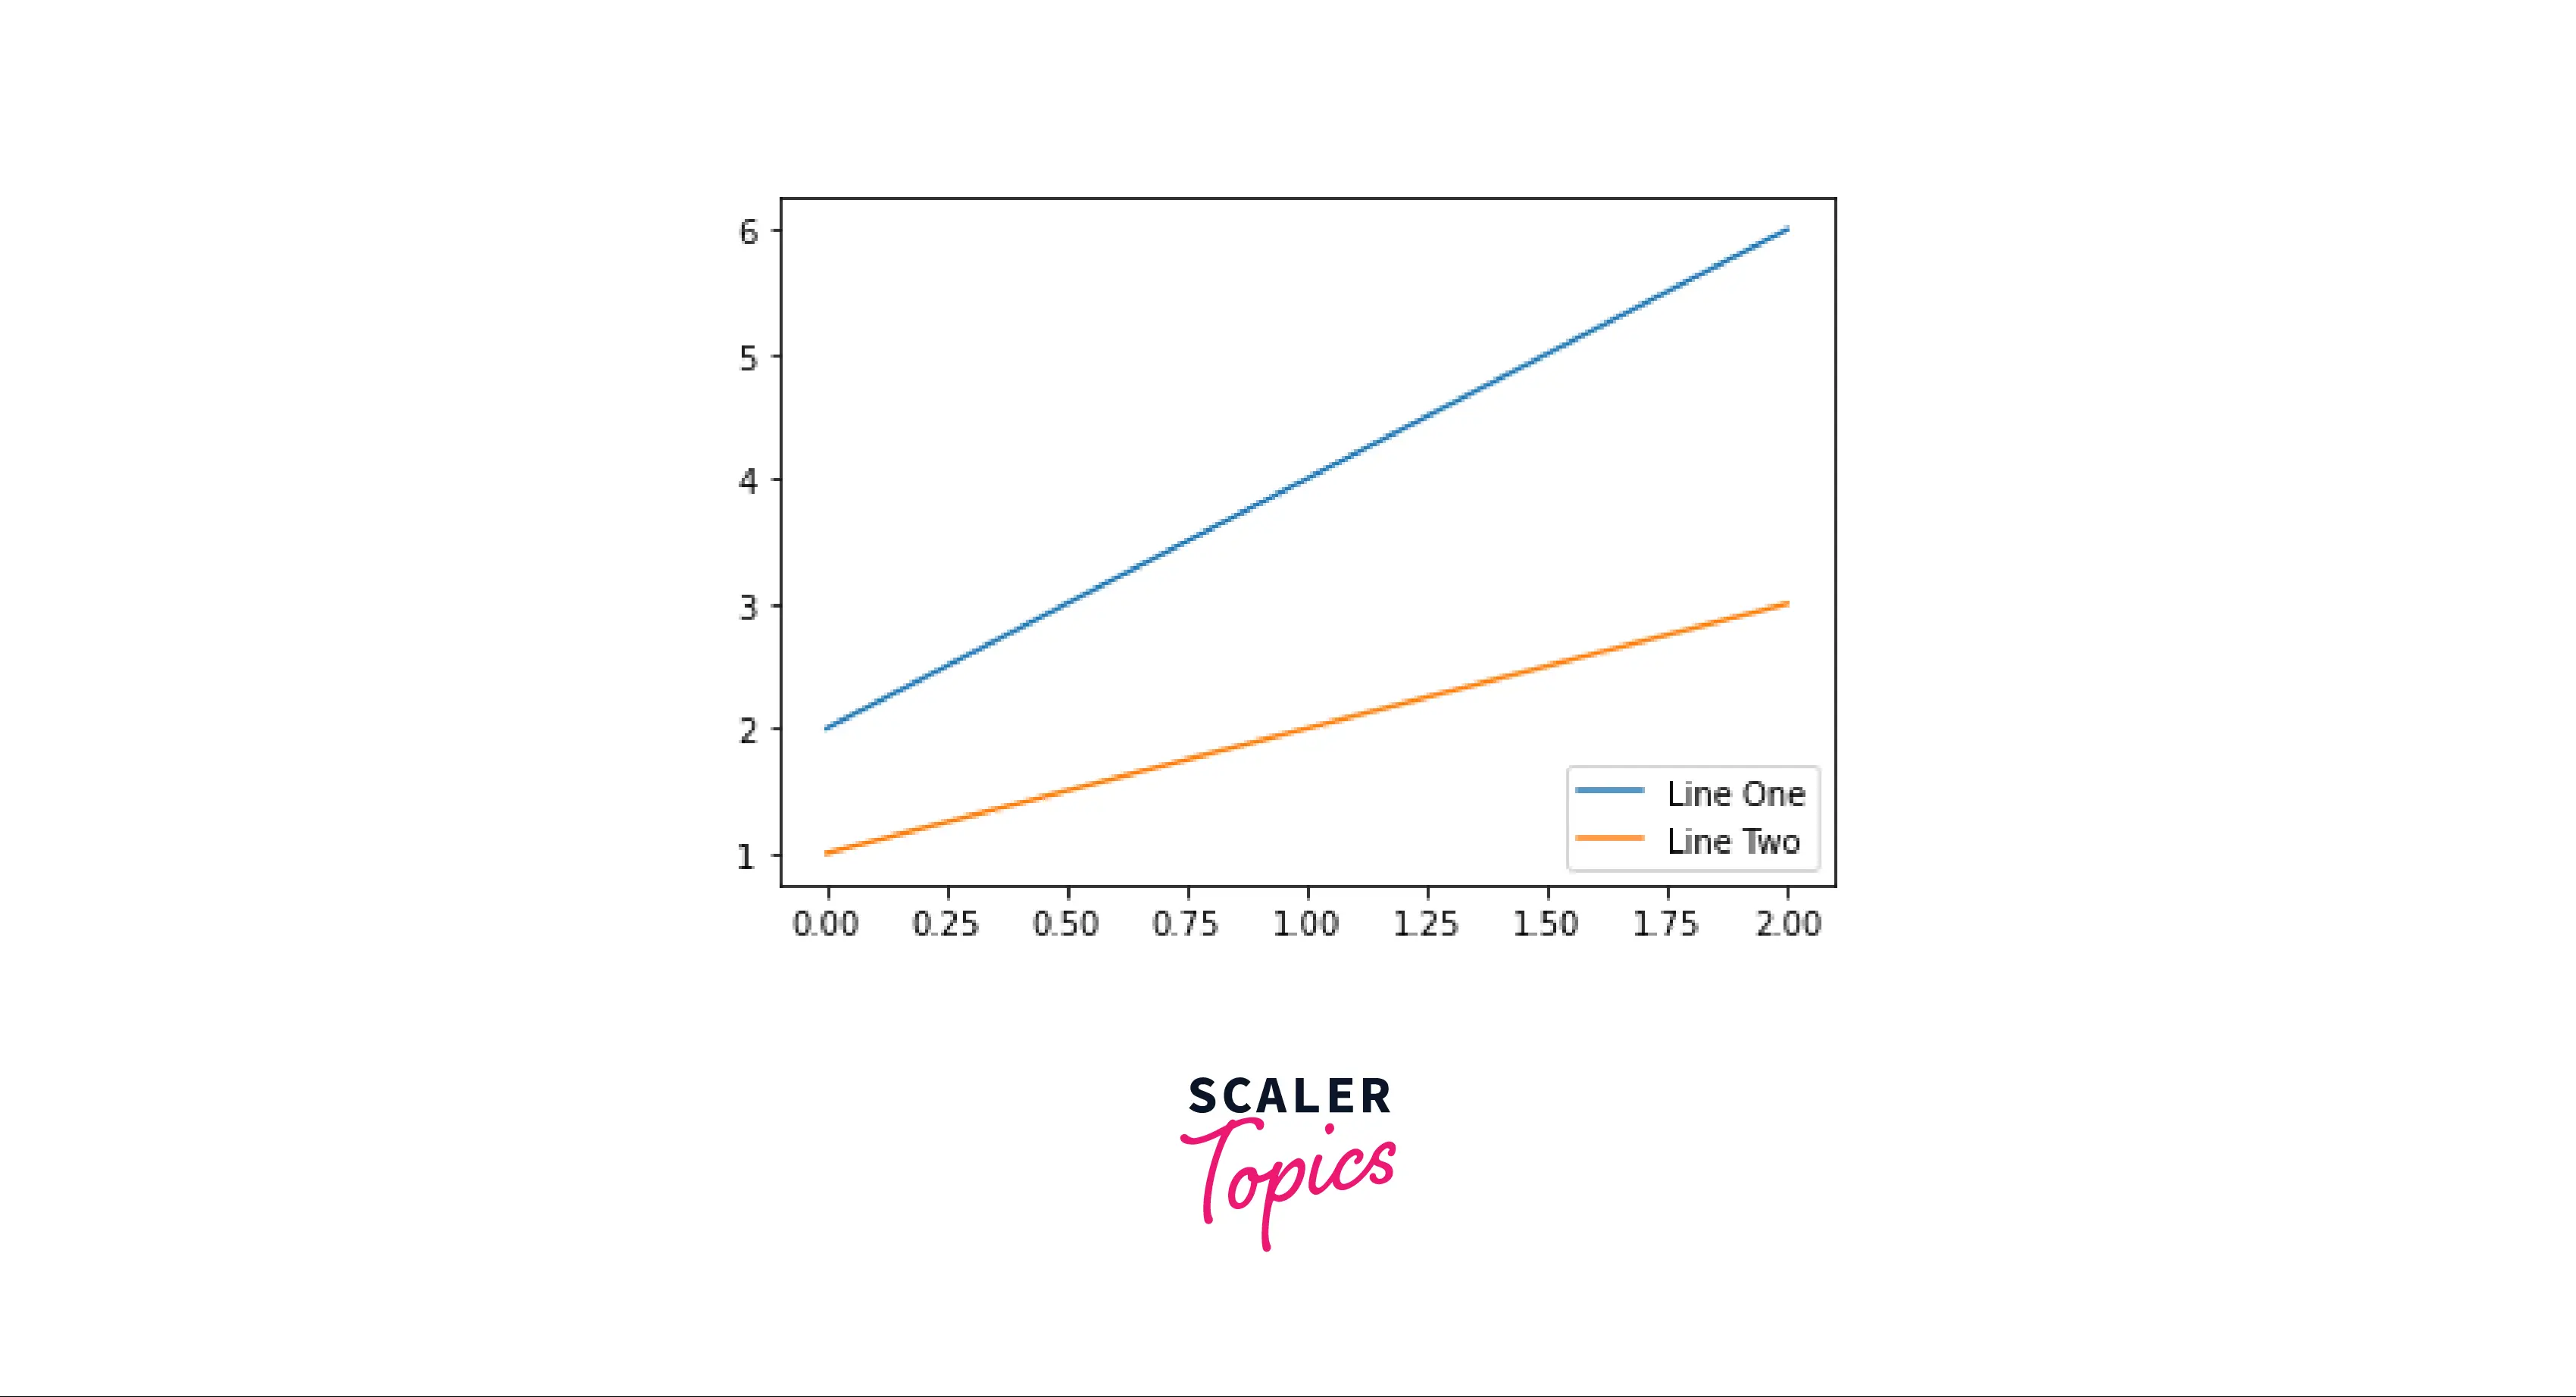
For customizing a legend, we can do a lot of operations in Python. If we want to re-position our legend, we can use the loc parameter. The loc parameter takes a string as input, which will help us set the legend in that position.
We can customize a legend in many ways; we can shift its position from upper left to lower right, from upper right to lower left etc. Apart from this, we can also change the font and text size of the text in our legend.
Output:
 Adding shadows will make our legend stand out. Here's how you add shadows to your legend:
Output:

Adding a Legend Outside of Axes
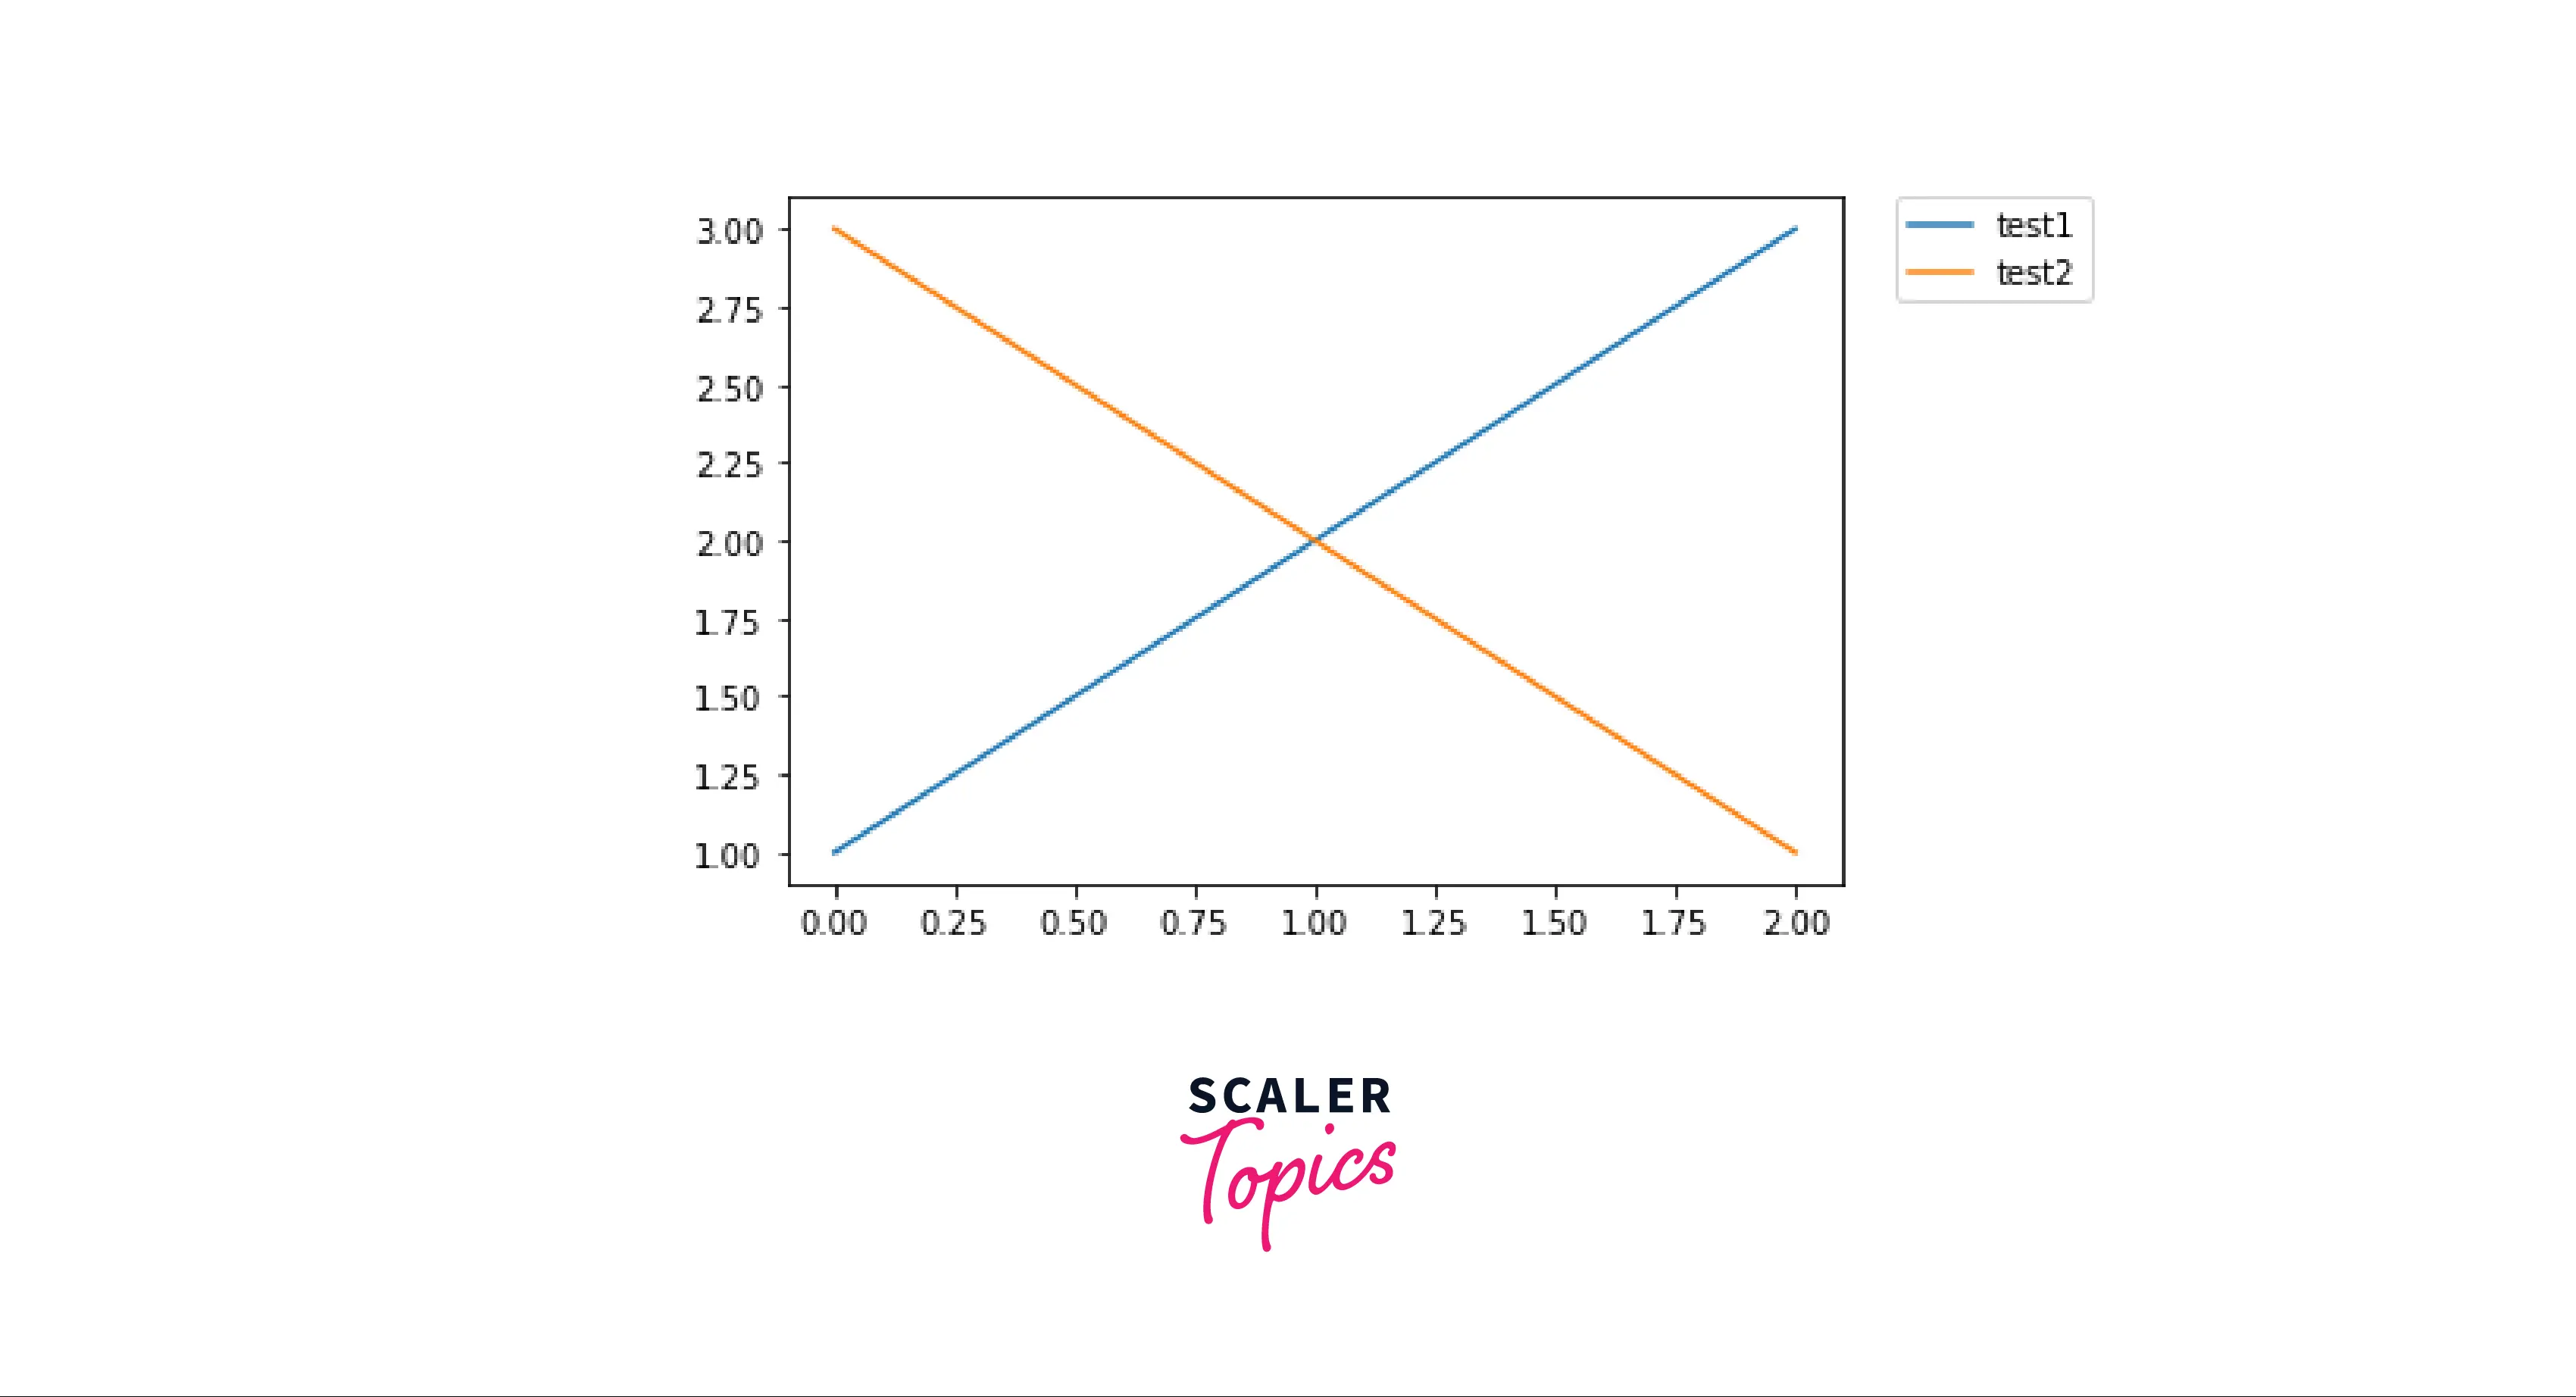
To add a legend outside our axes, we use the bbox_to_anchor() parameter in legend() function. For manual legend placement, the bbox to anchor keyword provides great customization.
Adding a legend outside axes is a great option when we have an extremely complicated plot, with various lines and curves. The viability and legibility of our plot increases tremendously.
Indicate the corner's location and coordinate system if you want your axes' legend to appear outside the axes of the figure.
Output:
Multiple Legends on the Same Axes
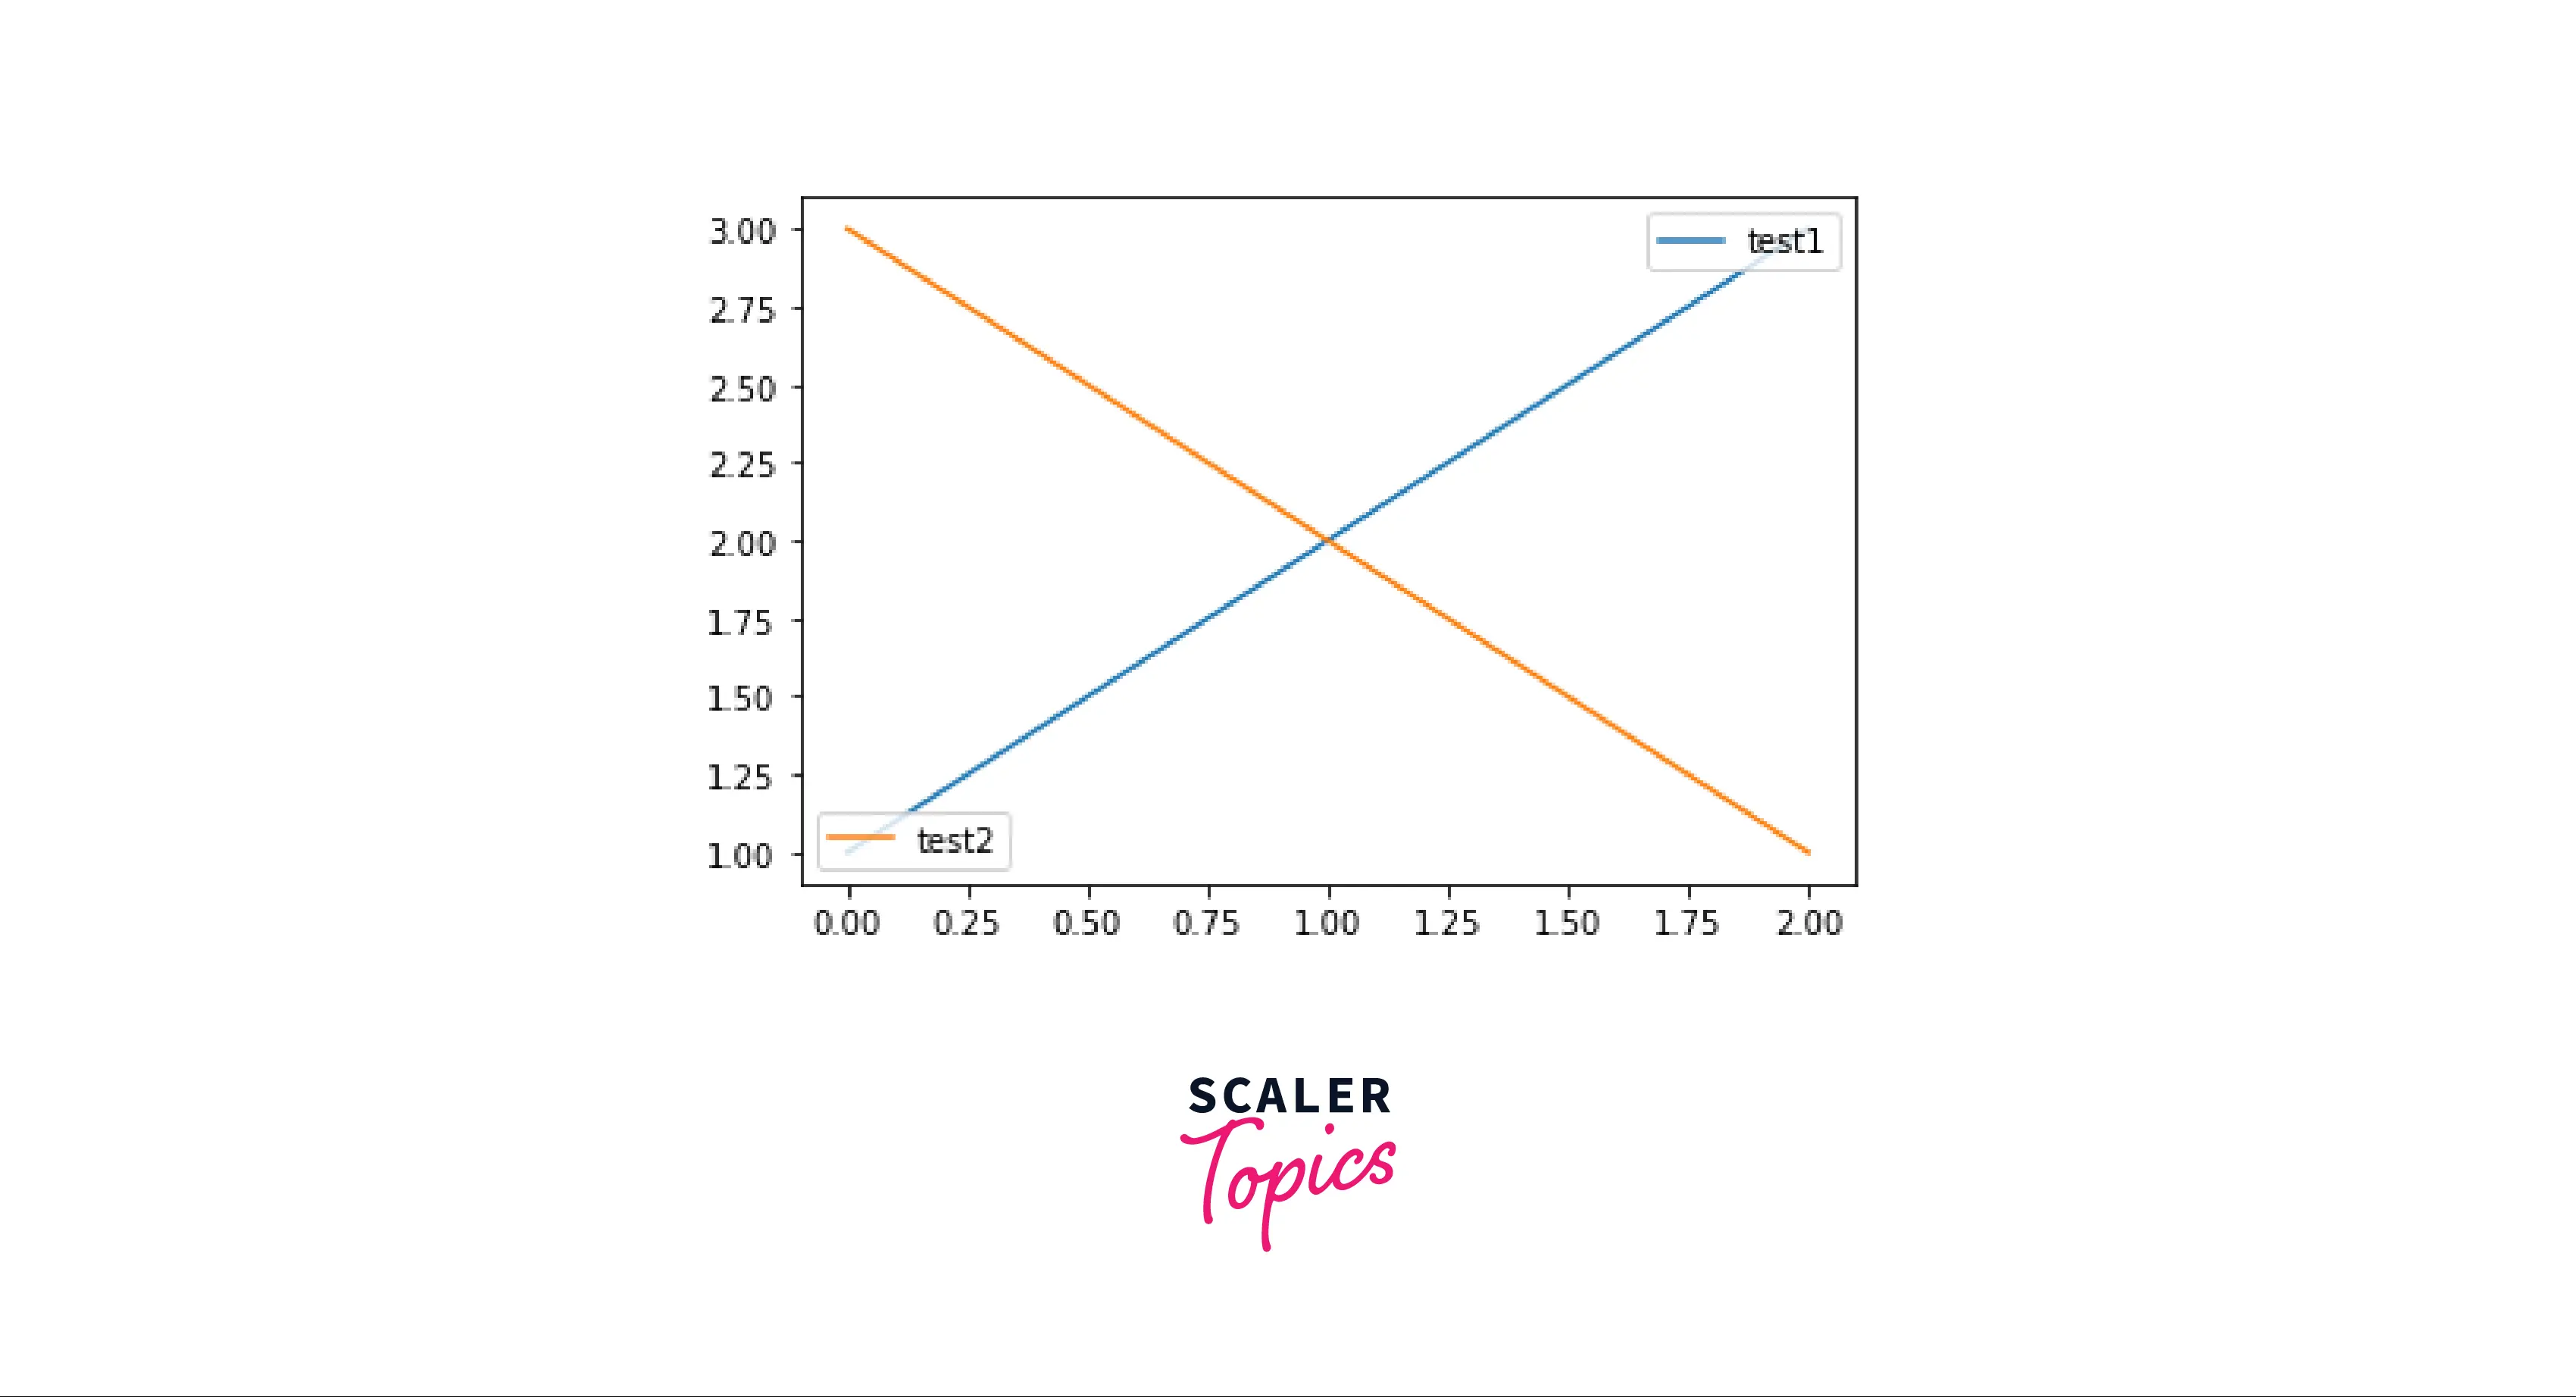
In matplotlib, we can add multiple legends in a single plot. This is done manually using axes.
Adding multiple legends on the same axes is appropriate for plots having a lot of functionality in them. If we have to display graphs that contain a lot of data, we can differentiate between them using multiple legends on the same axes.
To add the first legend, we will use the legend() function, and then we will save it as a variable. After saving the variable, we will manually add the second legend using legend() function.
Output:
Legend Handlers
Legend Handlers in matplotlib are used to create legend entries. By creating legend entries, we are keeping a log of the legends that we use in matplotlib.
When we work on extensive projects, a lot of plots are generated; hence keeping tabs on legends becomes quite a task. Here, legend handlers help us a lot. There are Four rules that we have to consider to select a handler subclass: 1. Update the function get_legend_handler_map() 2. Check if the handle is in handlermap 3. In handler_map, check if the handle exists or not? 4. Check if the different handles are present in the handlermap.
Output:
 <matplotlib.legend.Legend at 0x2a8d1380ee0>
As you can see, an instance of our legend has been created. Line 1 has 2 + points, and Line 2 has o(default).
Implementing a Custom Legend Handler
Any handle can be converted into a legend key by using a custom handler. We will use this logic to create custom legend handlers. The purpose of creating custom legends is that it allows us to achieve more control over our legends. By creating custom legends, we can put any shape/image as a symbol. Custom Legends in matplotlib are implemented using classes. The most critical function for custom legend handlers is the legend_artist(). In the example given below, we will try to create a custom legend and use an ellipse as our symbol.
Output:
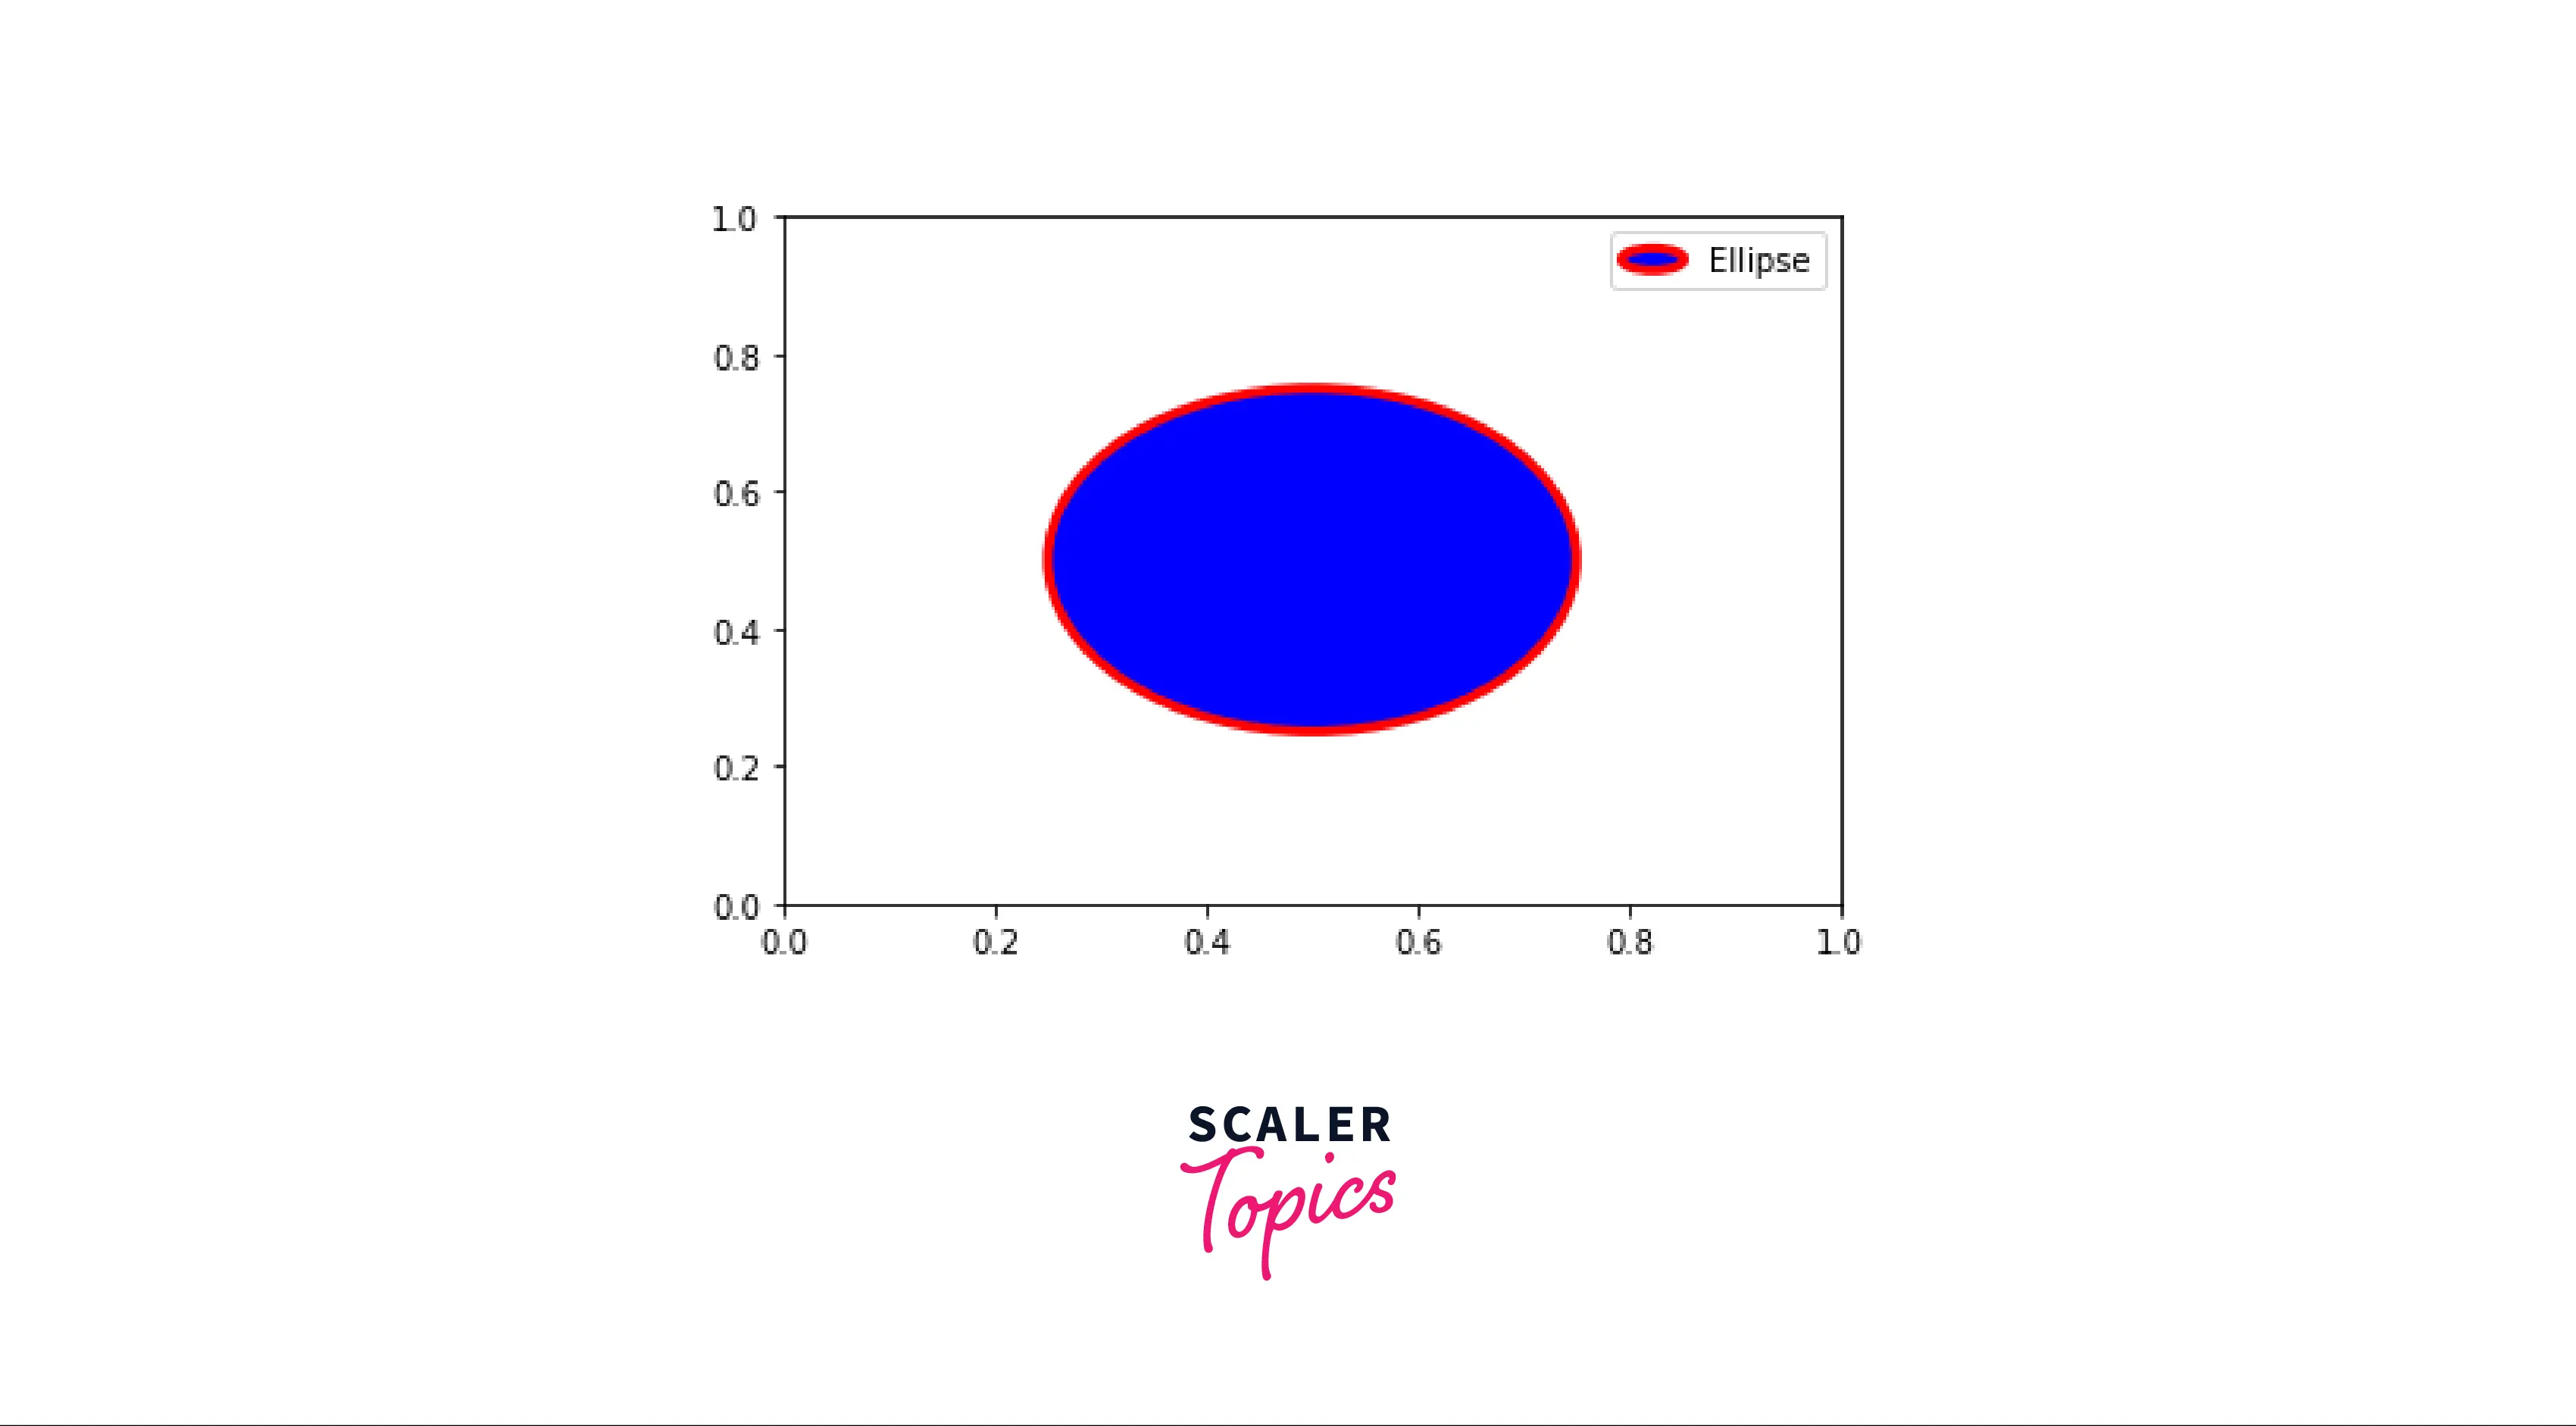
<matplotlib.legend.Legend at 0x2a8d0635e80>
In our HandlerEllipse class, we will define our artist function. Later, we call this function to execute our custom handler.
Transform Data into Actionable Insights! Enroll Now in Our Leading Data Science Program and Get Certified.
Conclusion
In this article, we learned:
- Basics of legends, ways to implement legends in matplotlib, and methods of adding legends to a figure in matplotlib.
- Ways for customizing legends in matplotlib and different methods of adding legends outside our axes.
- Having multiple legends on the same axes.
- Detailed explanation on Legend Handlers and how to implement a custom Legend Handler.