Matplotlib | Insert Subfigures
Overview
Matplotlib provides the libraries and function to add subfigures on a figure where we can place the subplots. There are two methods to add subfigures to the figure or gridspec in matplotlib Figure.add_subfigure() and Figure.subfigures(). GridSpec divides the area on the figure in terms of grids where we can place subfigures or subplots according to our needs. We can also implement nested GridSpec or nested subfigures in matplotlib. Figures, Subfigures, and GridSpec only allot space on the canvas for the plots and subplots. Subplots and plot is the place where we can plot the data in matplotlib.
Introduction
Figures or subfigures are the canvas for the plots and subplots, and we can't plot without figures. In matplotlib, a default figure is automatically generated in the backend, where we can place our plots. We can also create a figure using the function matplotlib.pyplot.figure() and change its visual properties by adding some parameters. If we can plot the figures, why do we need subfigures?
Need of Subfigures in Matplotlib
Subfigures are an important component in the matplotlib where we can place the subplots in a different layout. The figure is the top-level container of all the axes and properties of a plot, or we can say that it is a canvas that holds the drawings (graphs or plots) on it. All the plots and properties are shown in the figure in matplotlib. We can place the subplot on a figure, but if we change some properties of the figure, it will affect the whole plot. We don't have any individual control over each subplot. Here comes the concept of subfigures, where we can place subfigures inside the figures and subplots inside the subfigures where we can change the properties of the certain group of the subplot of any subfigures. We can place the subfigures in the grid using the gridspec() method. Also, we can make nested gridspec or nested subfigures to place the subplots in groups.
Subfigures in Matplotlib
Figure inside the figure (subfigures) can be instantiated using Figure.add_subfigure() or SubFigure.add_subfigure(), or SubFigure.subfigures(). We can also instantiate a subfigure inside a subfigure.
Transform Your Career
Choose from our industry-leading programs designed for career success
Modern Software and AI Engineering Program
Master full-stack development with AI integration

Modern Data Science and ML with specialisation in AI
Advanced data science techniques with AI specialization
Advanced AIML with Specialisation in Agentic AI
Deep dive into AIML with focus on Agentic systems
DevOps, Cloud & AI Platform Engineering
Build and manage AI-powered cloud infrastructure
AI Engineering Advanced Certification by IIT-Roorkee
Premier AI engineering certification from IIT-Roorkee
How to Insert Subfigures in Matplotlib
First, we have to create a figure to add the subfigures. There are two functions add_subfigure() and subfigures in matplotlib to add subfigures in matplotlib. We can define subfigures in matplotlib by specifying the number of rows and columns or by using NumPy slice syntax to specify the location of subfigures in GridSpec.
matplotlib.figure.Figure.add_subfigure
Add a SubFigure to the figure as part of a subplot arrangement.
Syntax:
Parameters:
- subplotspec: It defines a region in a parent gridspec where the subfigure will be placed
- kwargs: Other arguments to change the visual properties of the figure.
Example: Subfigures on the figure using the function add_subfigures
Output:

matplotlib.figure.subfigures
Adding a subfigure to a figure or a subfigure, we can specify the grid size in the function for adding multiple subplots.
Syntax:
Parameters:
| Parameter | Datatype | Description |
|---|---|---|
| nrows, ncols: | int | Size of the grid of subfigure. |
| squeeze: | bool | default: True. if True, it squeezes out the extra dimension. |
| wspace, hspace: | float | It reserves the height and width between the subfigures. |
| width_ratios: | Data Structure: Array | Define the relative width of the columns |
| height_ratios: | Data Structure: Array | Define the relative width of the height. |
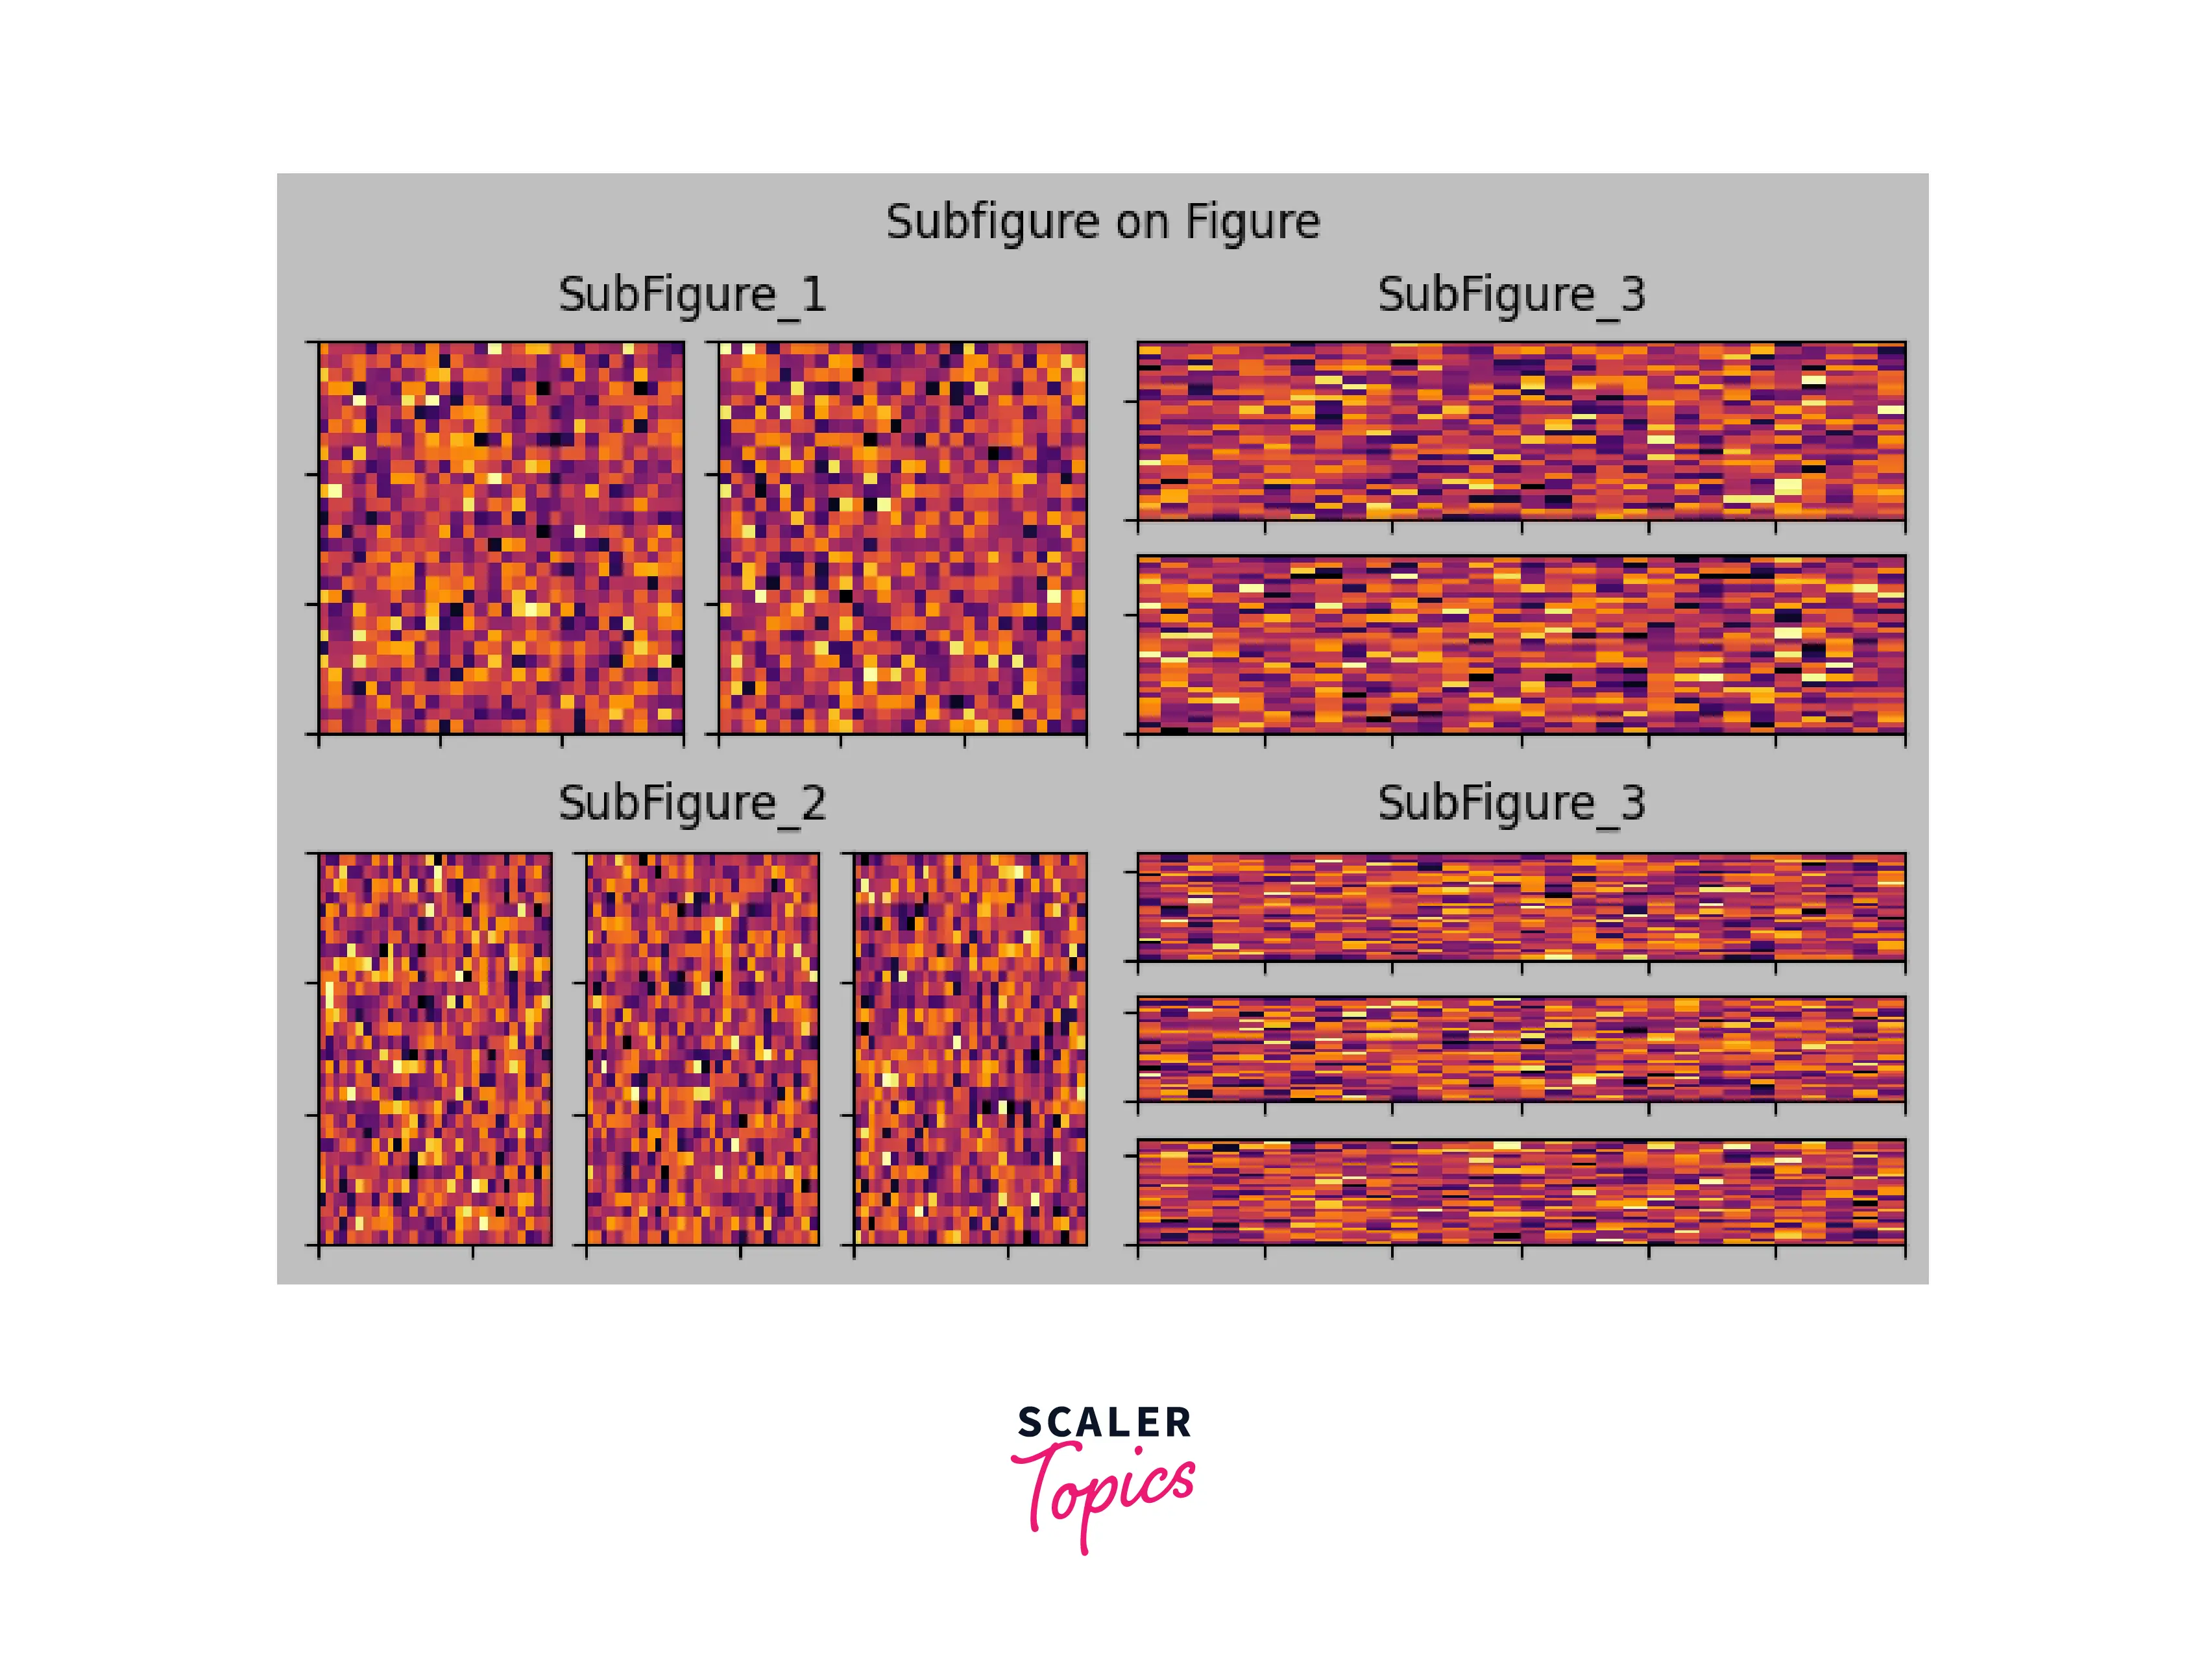
Example1: Subfigure on Figure
Output:
Nested Subfigures
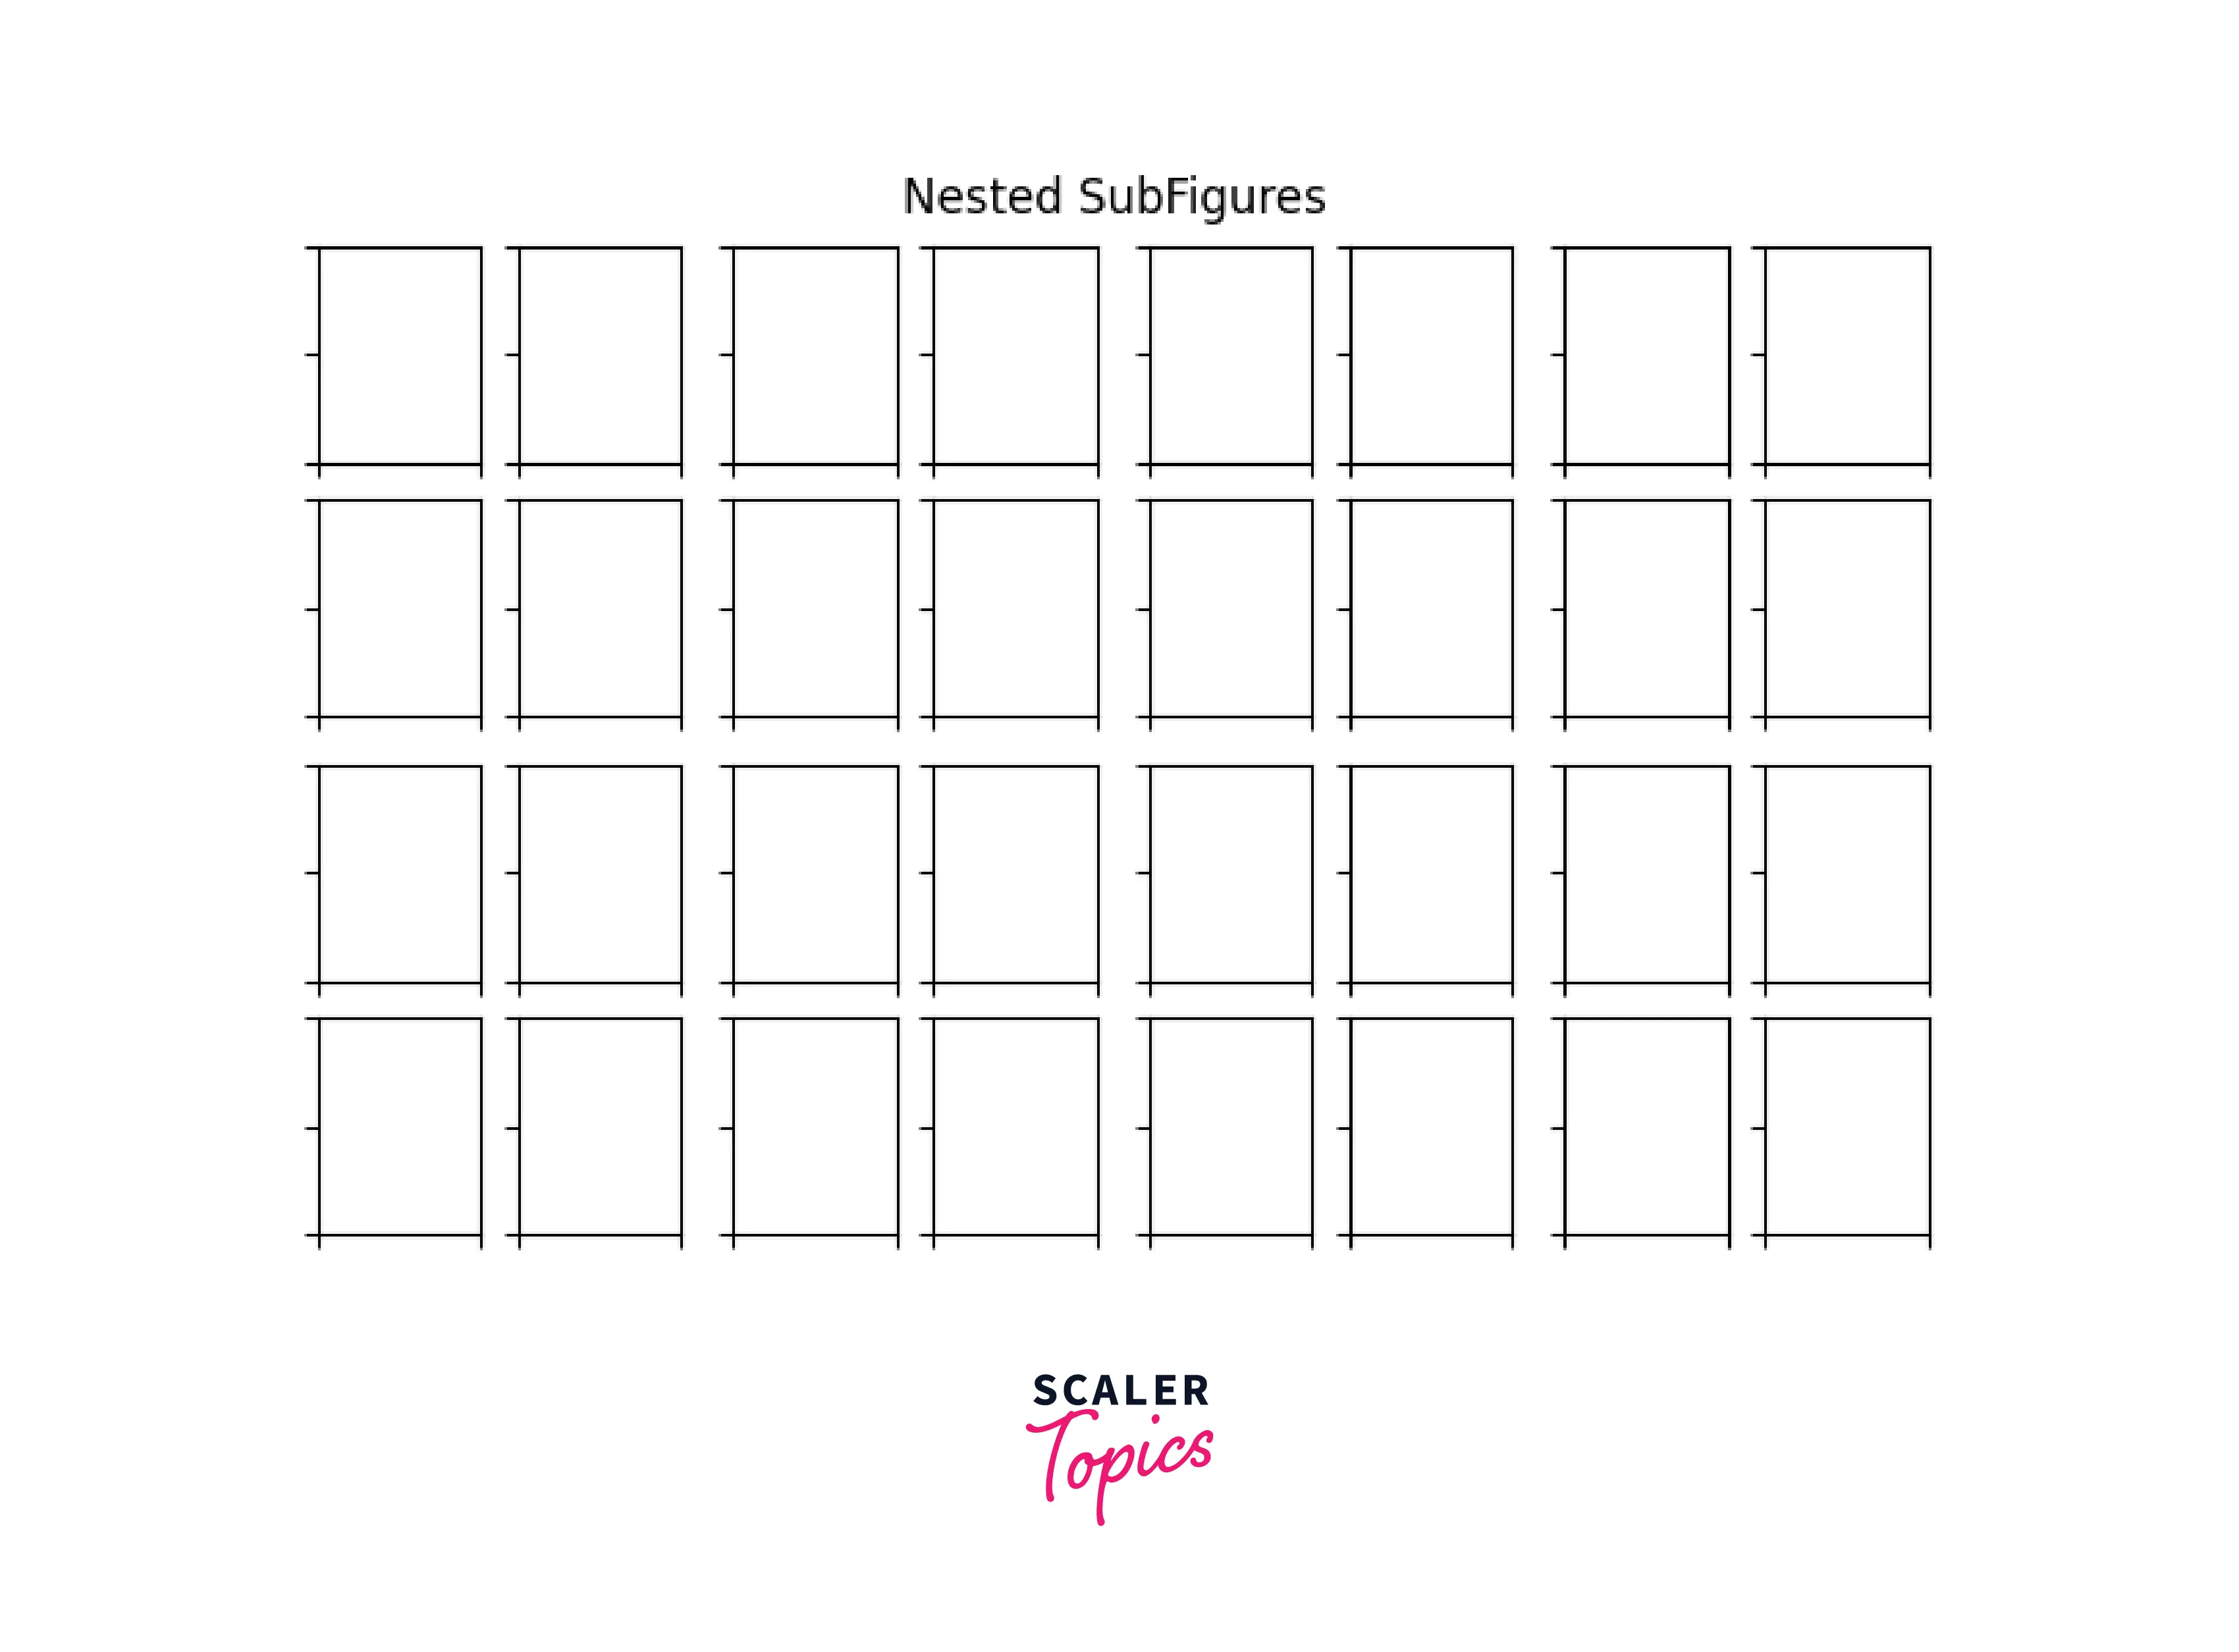
Subfigures can also be nested inside subfigures. First, we have to create a figure to add a subfigure. Then, we can nest a subfigure inside a subfigure by specifying its location in the grid. Here is an example for the nested subfigures.
Example: Nested subfigures
Output:
What is Gridspec in Matplotlib
GridSpecs is the function that specifies the geometry of the grid where a subplot will be placed. For example, the grid's number of rows and columns needs to be set. GridSpec provides a canvas where a subplot can be drawn. We can set the location of each subplot on it either by subplot layout parameters (left, right, etc.), or we can set it manually by NumPy slice syntax, and we can also define a gridSpec inside a gridSpec (Nested grid specs).
Turn Learning into Career Growth
Syntax
Parameters
| Parameters | Datatype | Description |
|---|---|---|
| nrows, ncols | int | The number of rows and columns of the grid. |
| figure | It takes figure as value one which is created using the function matplotlib.pyplot.figure(). It is used for the constrained layout to create a proper layout grid. | |
| left, right, top, bottom | float | Extent of the subplots as a fraction of figure width or height. The left cannot be larger than the right, and the bottom cannot be larger than the top. The values will be inferred from a figure or rcParams at draw time if not given. |
| wspace | float | The width reserved between the subplots. |
| hspace | float | The amount of height reserved between the subplots. |
| width_ratios | Defines the relative width of the columns. | |
| heigth_ratios: | Data Structure: array (size = nrows) | Defines the relative height of the rows. |
How to Add Gridspec in Matplotlib
Example 1: Defining a basic layout of subplots using gridSpec
Output:

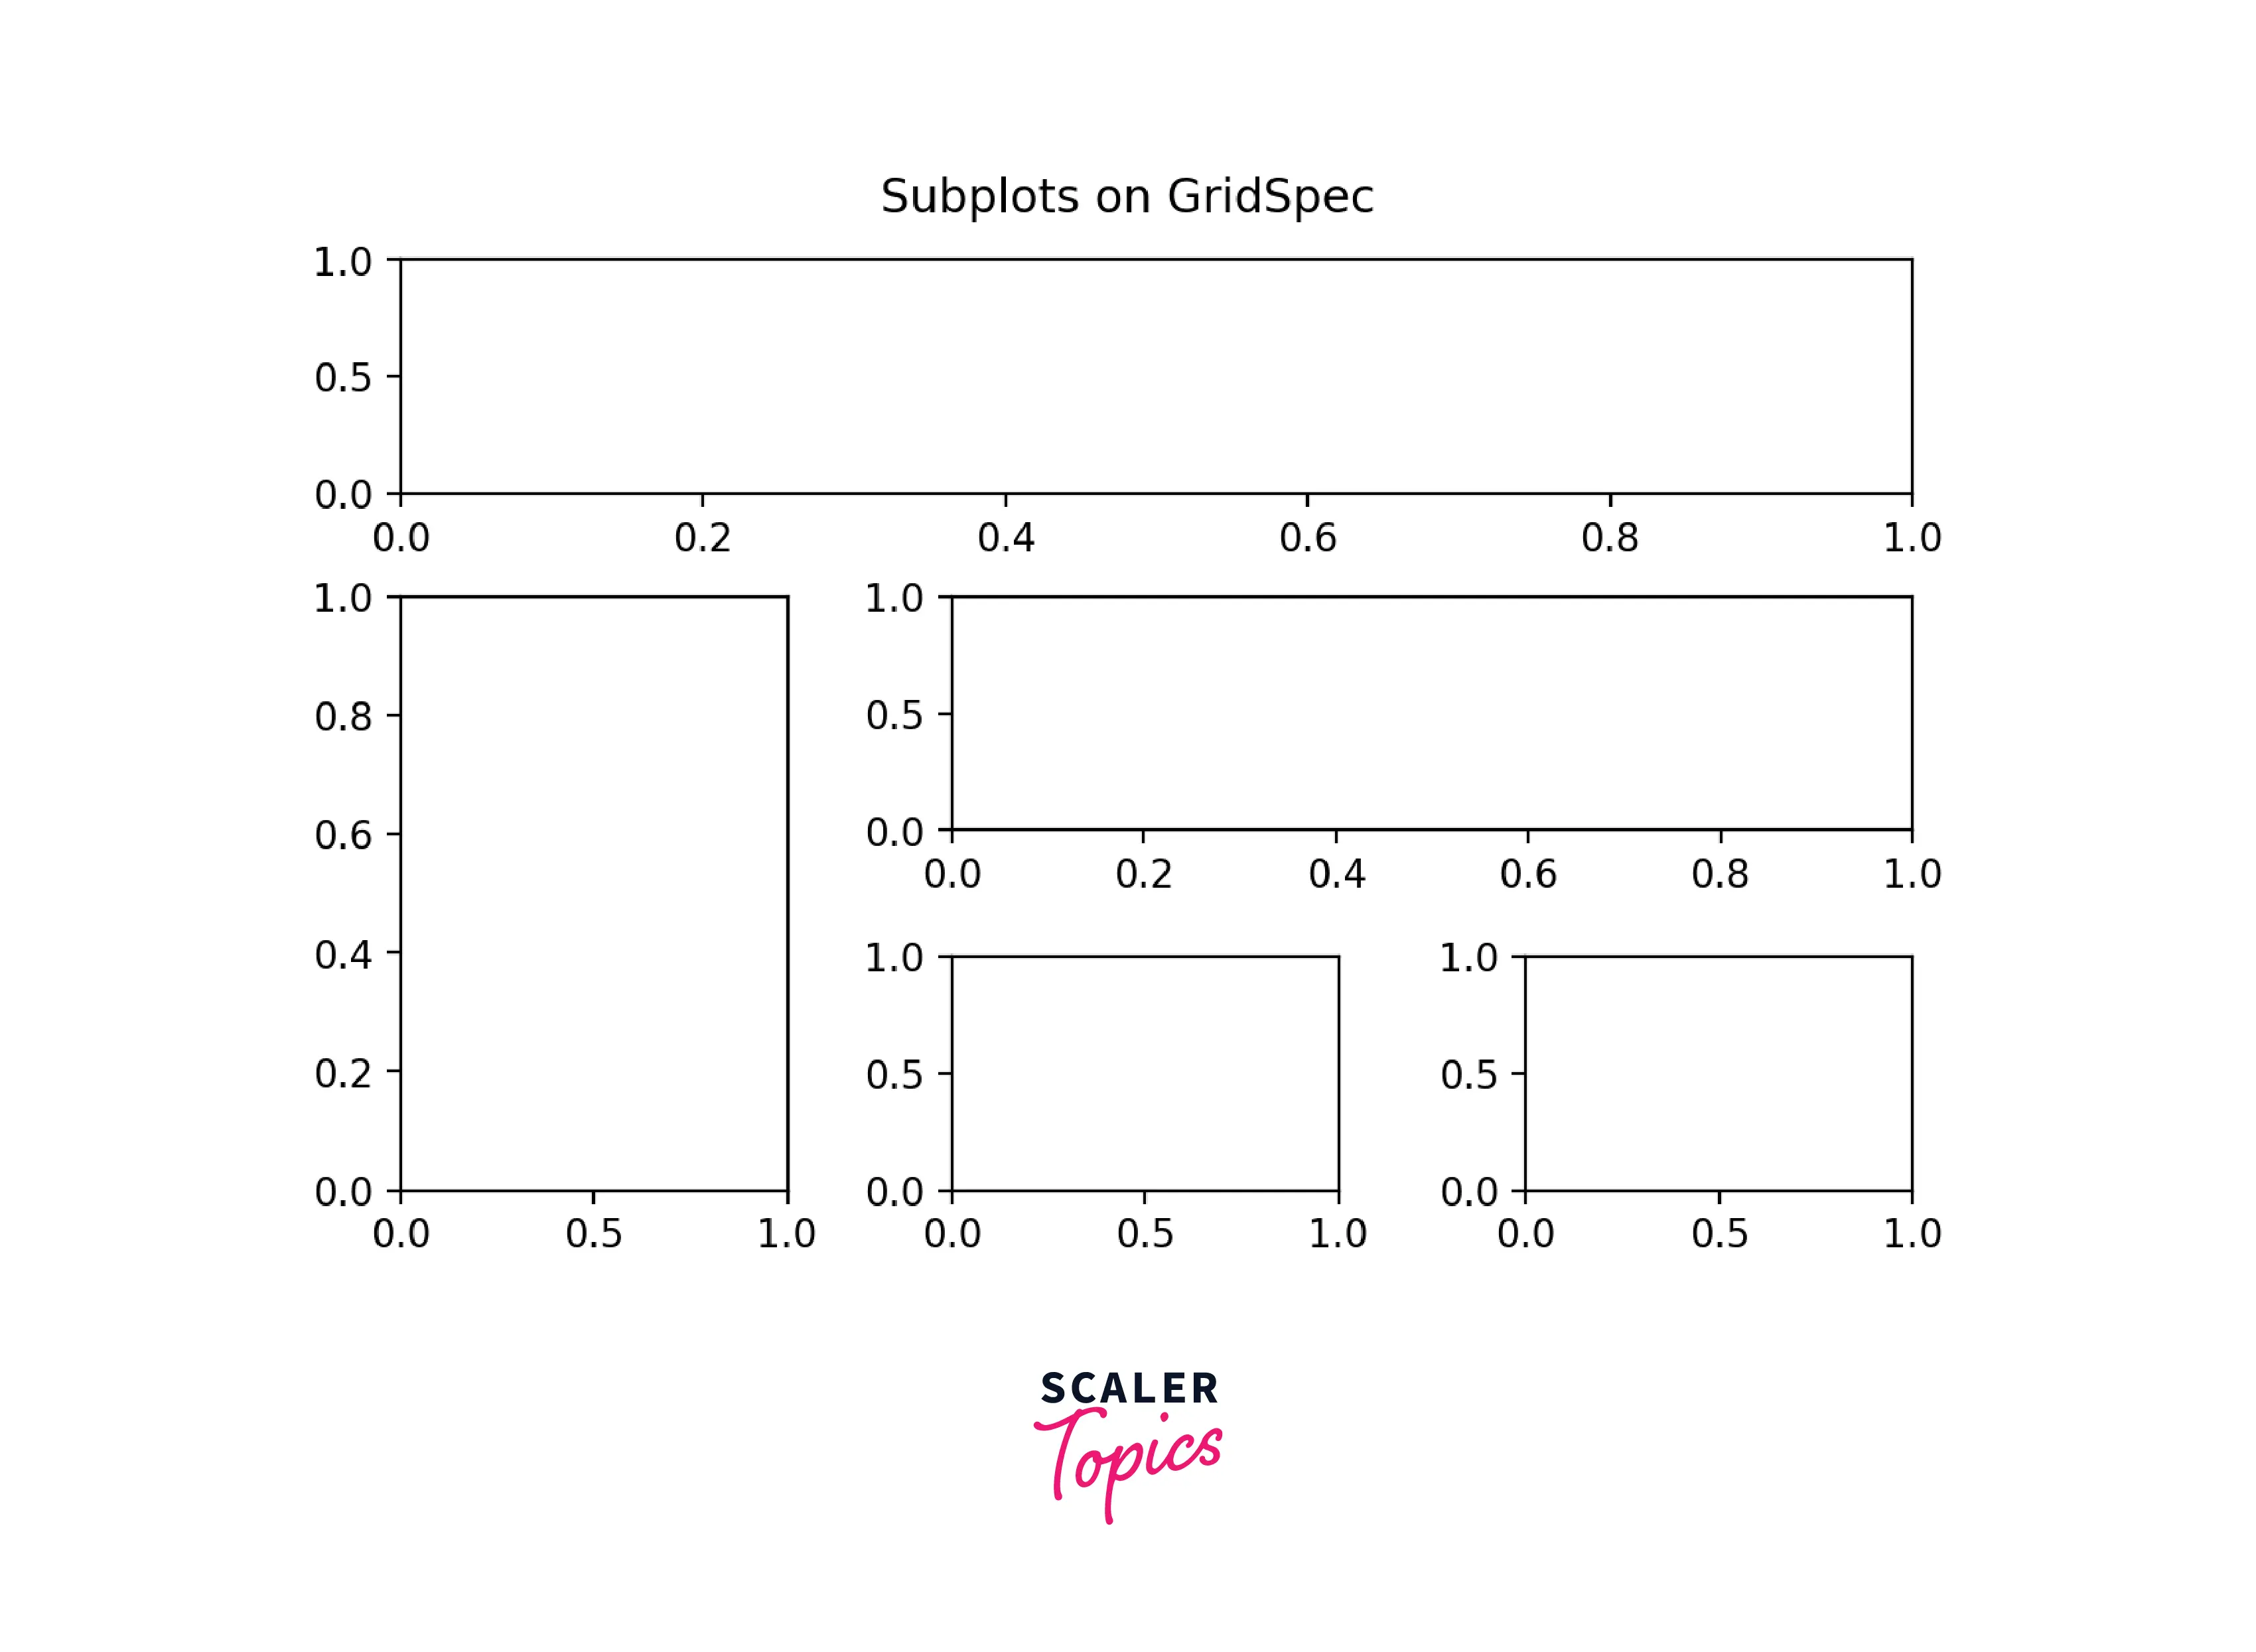
Example 2: Putting subplots on the figure using NumPy slice syntax
Output:
Nested GridSpec
GridSpecs can be nested so that a subplot from a parent GridSpec can set the position for a nested grid of subplots.
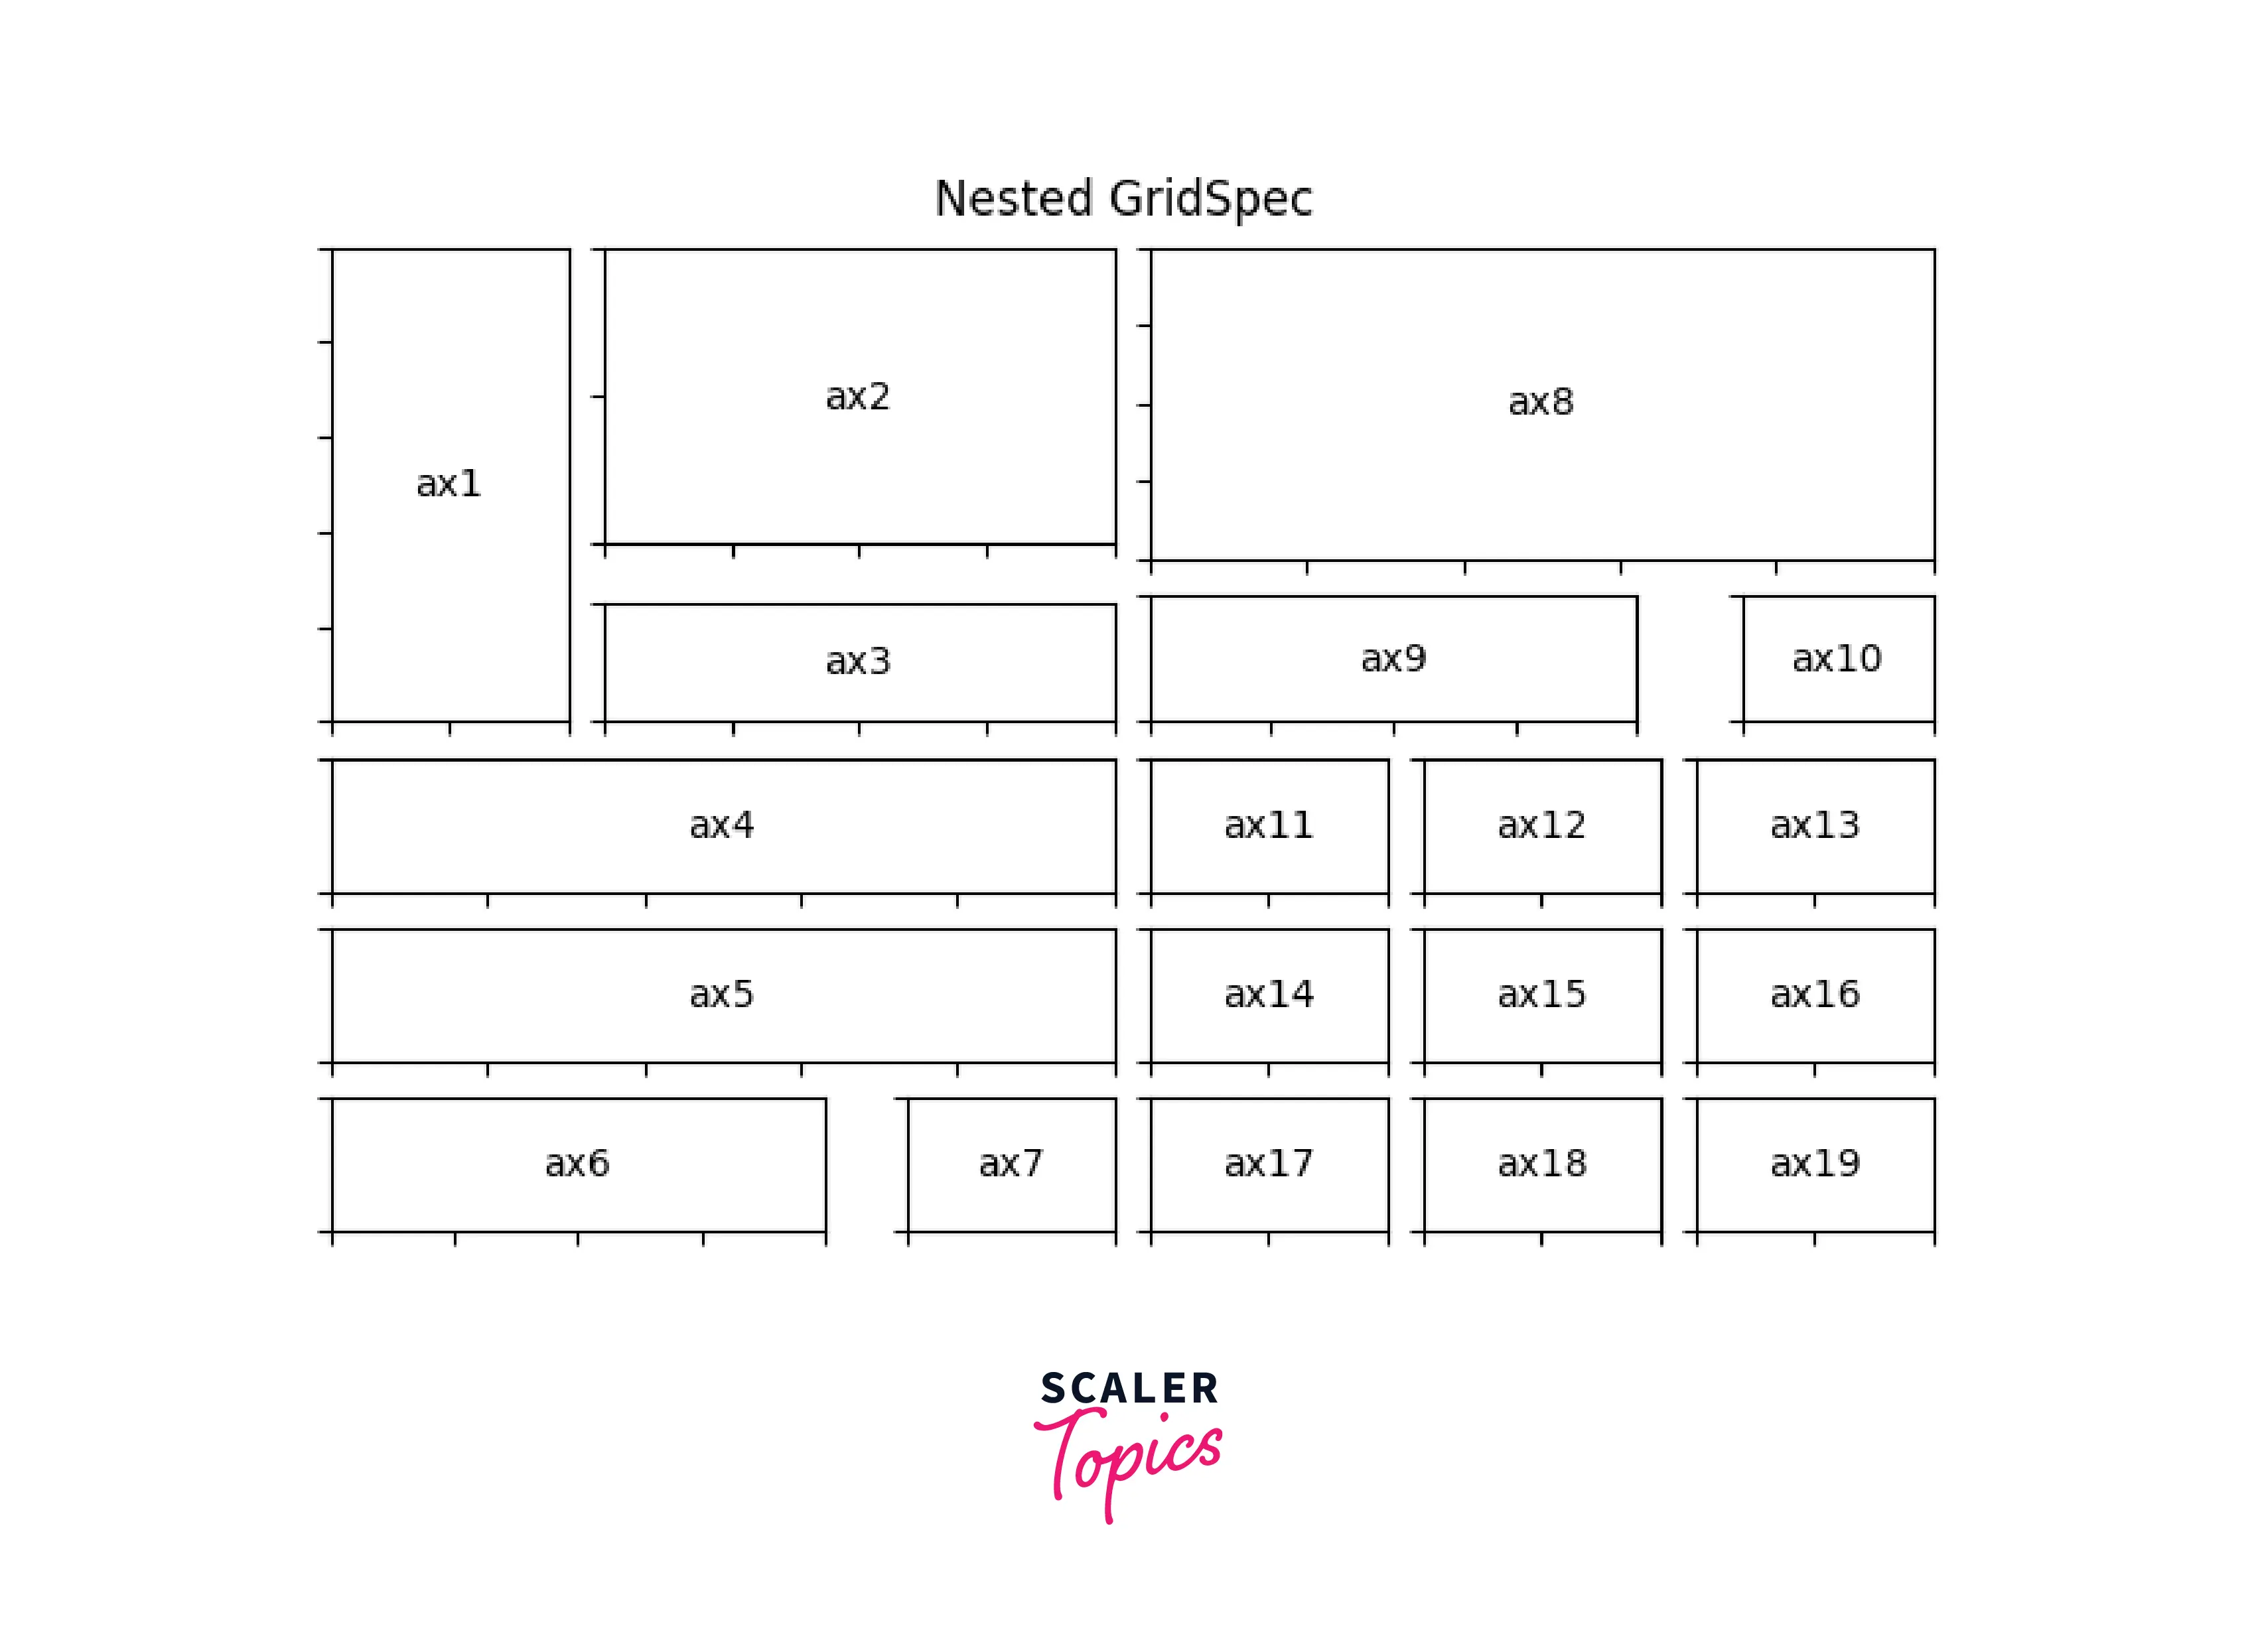
Example: Nested GridSpec
Output:
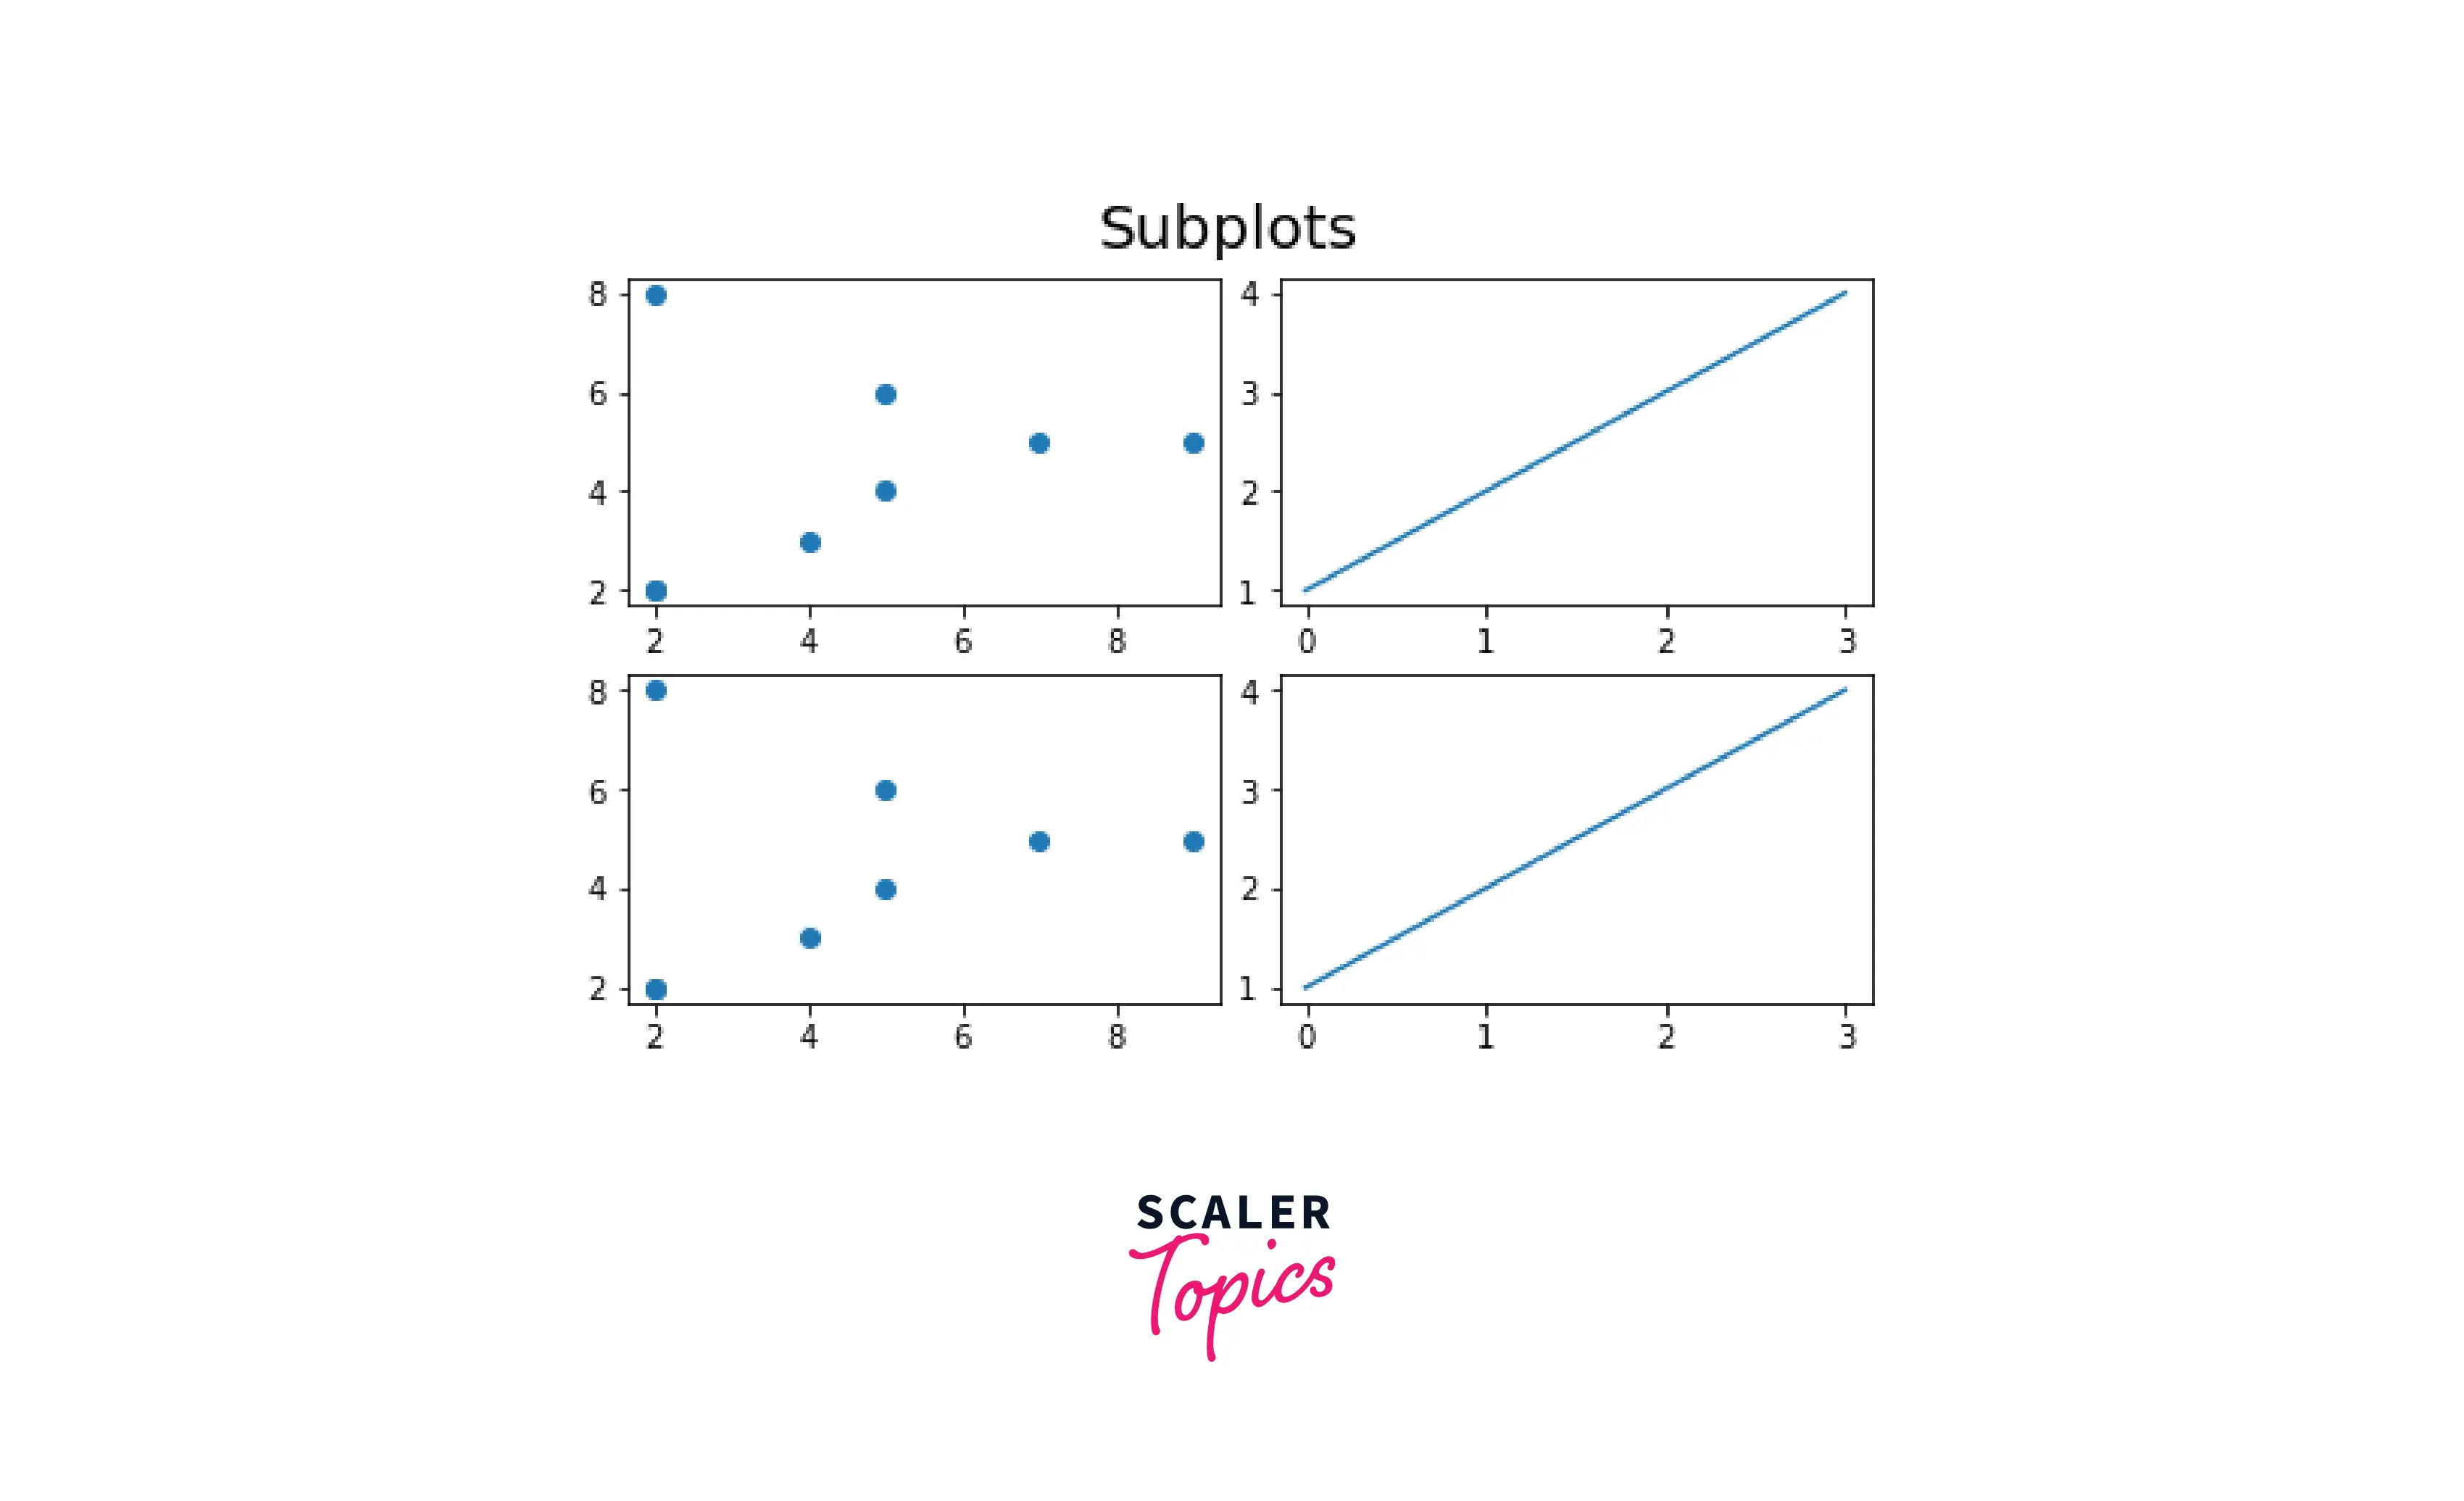
Subplots in Matplotlib
For showing multiple plots on the same figure, we can add subplots. We can define the subplots by specifying the number of rows and columns and then plot the data to visualize it.
Syntax
Parameters
| Parameters | Datatype | Description |
|---|---|---|
| nrows, ncols | int | The number of rows and columns of the subplot grid. |
| sharex, sharey | boolean | Controls sharing of properties among x (sharex) or y (sharey) axes: True or 'all': x- or y-axis will be shared among all subplots. False or 'none': each subplot x- or y-axis will be independent. 'row': each subplot row will share an x- or y-axis. 'col': each subplot column will share an x- or y-axis. |
| squeeze: | boolean | If True, it squeezes out the extra dimension. |
| subplot_kw | Dict with keywords passed to the add_subplot call used to create each subplot | |
| gridspec_kw: | Dict with keywords passed to the GridSpec constructor used to create the grid the subplots are placed on. | |
| **fig_kw: | All additional keyword arguments are passed to the pyplot.figure call. |
Example:
Output:
Scaler Placement Report and Statistics
Scaler learners achieved 2.5x salary growth with average post-Scaler CTC reaching ₹23L.
Conclusion
- All the plotting in matplotlib is done in the figure.
- GridSpec and subfigures are the two components where we can place subplots.
- GridSpec can be nested inside the GridSpec. We can also nest subfigures inside the gridSpec.
- For different subplot layouts, we can use both GridSpec and subfigures.
- Plotting the data is done on subplots and plots in matplotlib.