Triangulations Using Matplotlib
Overview
Matplotlib provides the libraries and functions to plot triangulations. Triangulation is the division of a surface or plane polygon into a set of triangles. Usually, two adjacent triangles entirely share each triangle vertex.
The concept of triangulation makes the plotting of a continuous surface possible in python. Either triangle coordinates can be defined by the user or by using Delaunay triangulation which covers the set of points in a triangle that makes the surface plot persistent.
What is Triangulation in Matplotlib?
In this article, we will learn about triangulation in matplotlib. The function required to plot triangulation is matplotlib.pyplot.triplot(), which at least takes two arguments, x and y data points.
An unstructured triangular grid comprises npoints points and ntri triangles. The triangles can be specified by the user or automatically generated using a Delaunay triangulation (generate a mesh of triangles that covers an object).
Transform Your Career
Choose from our industry-leading programs designed for career success
Modern Software and AI Engineering Program
Master full-stack development with AI integration

Modern Data Science and ML with specialisation in AI
Advanced data science techniques with AI specialization
Advanced AIML with Specialisation in Agentic AI
Deep dive into AIML with focus on Agentic systems
DevOps, Cloud & AI Platform Engineering
Build and manage AI-powered cloud infrastructure
AI Engineering Advanced Certification by IIT-Roorkee
Premier AI engineering certification from IIT-Roorkee
Parameters of matplotlib.pyplot.triplot()
- x, y: n the number of points scored in an array or list.
- triangles (optional parameter) : (ntri, 3) array-like of int.
- mask (optional parameter) : (ntri,) array-like of bool, Which triangles are masked out.
A Sample Figure of Triangulation in Matplotlib

How to Do Matplotlib Triangulation?
- First, we must import the required libraries like matplotlib, numpy, and matplotlib.tri.
- We ensure that triangulation is valid for generating the data for plotting triangulation in matplotlib. It must not have identical points, triangles formed from collinear points, or overlapping triangles.
- Using the function matplotlib.tri.Triangulation() which takes at least two parameters x and y data points to generate triangles
- Using the function matplotlib.pyplot.triplot() we can plot the triangulation on a figure.
Examples of Matplotlib Triangulation
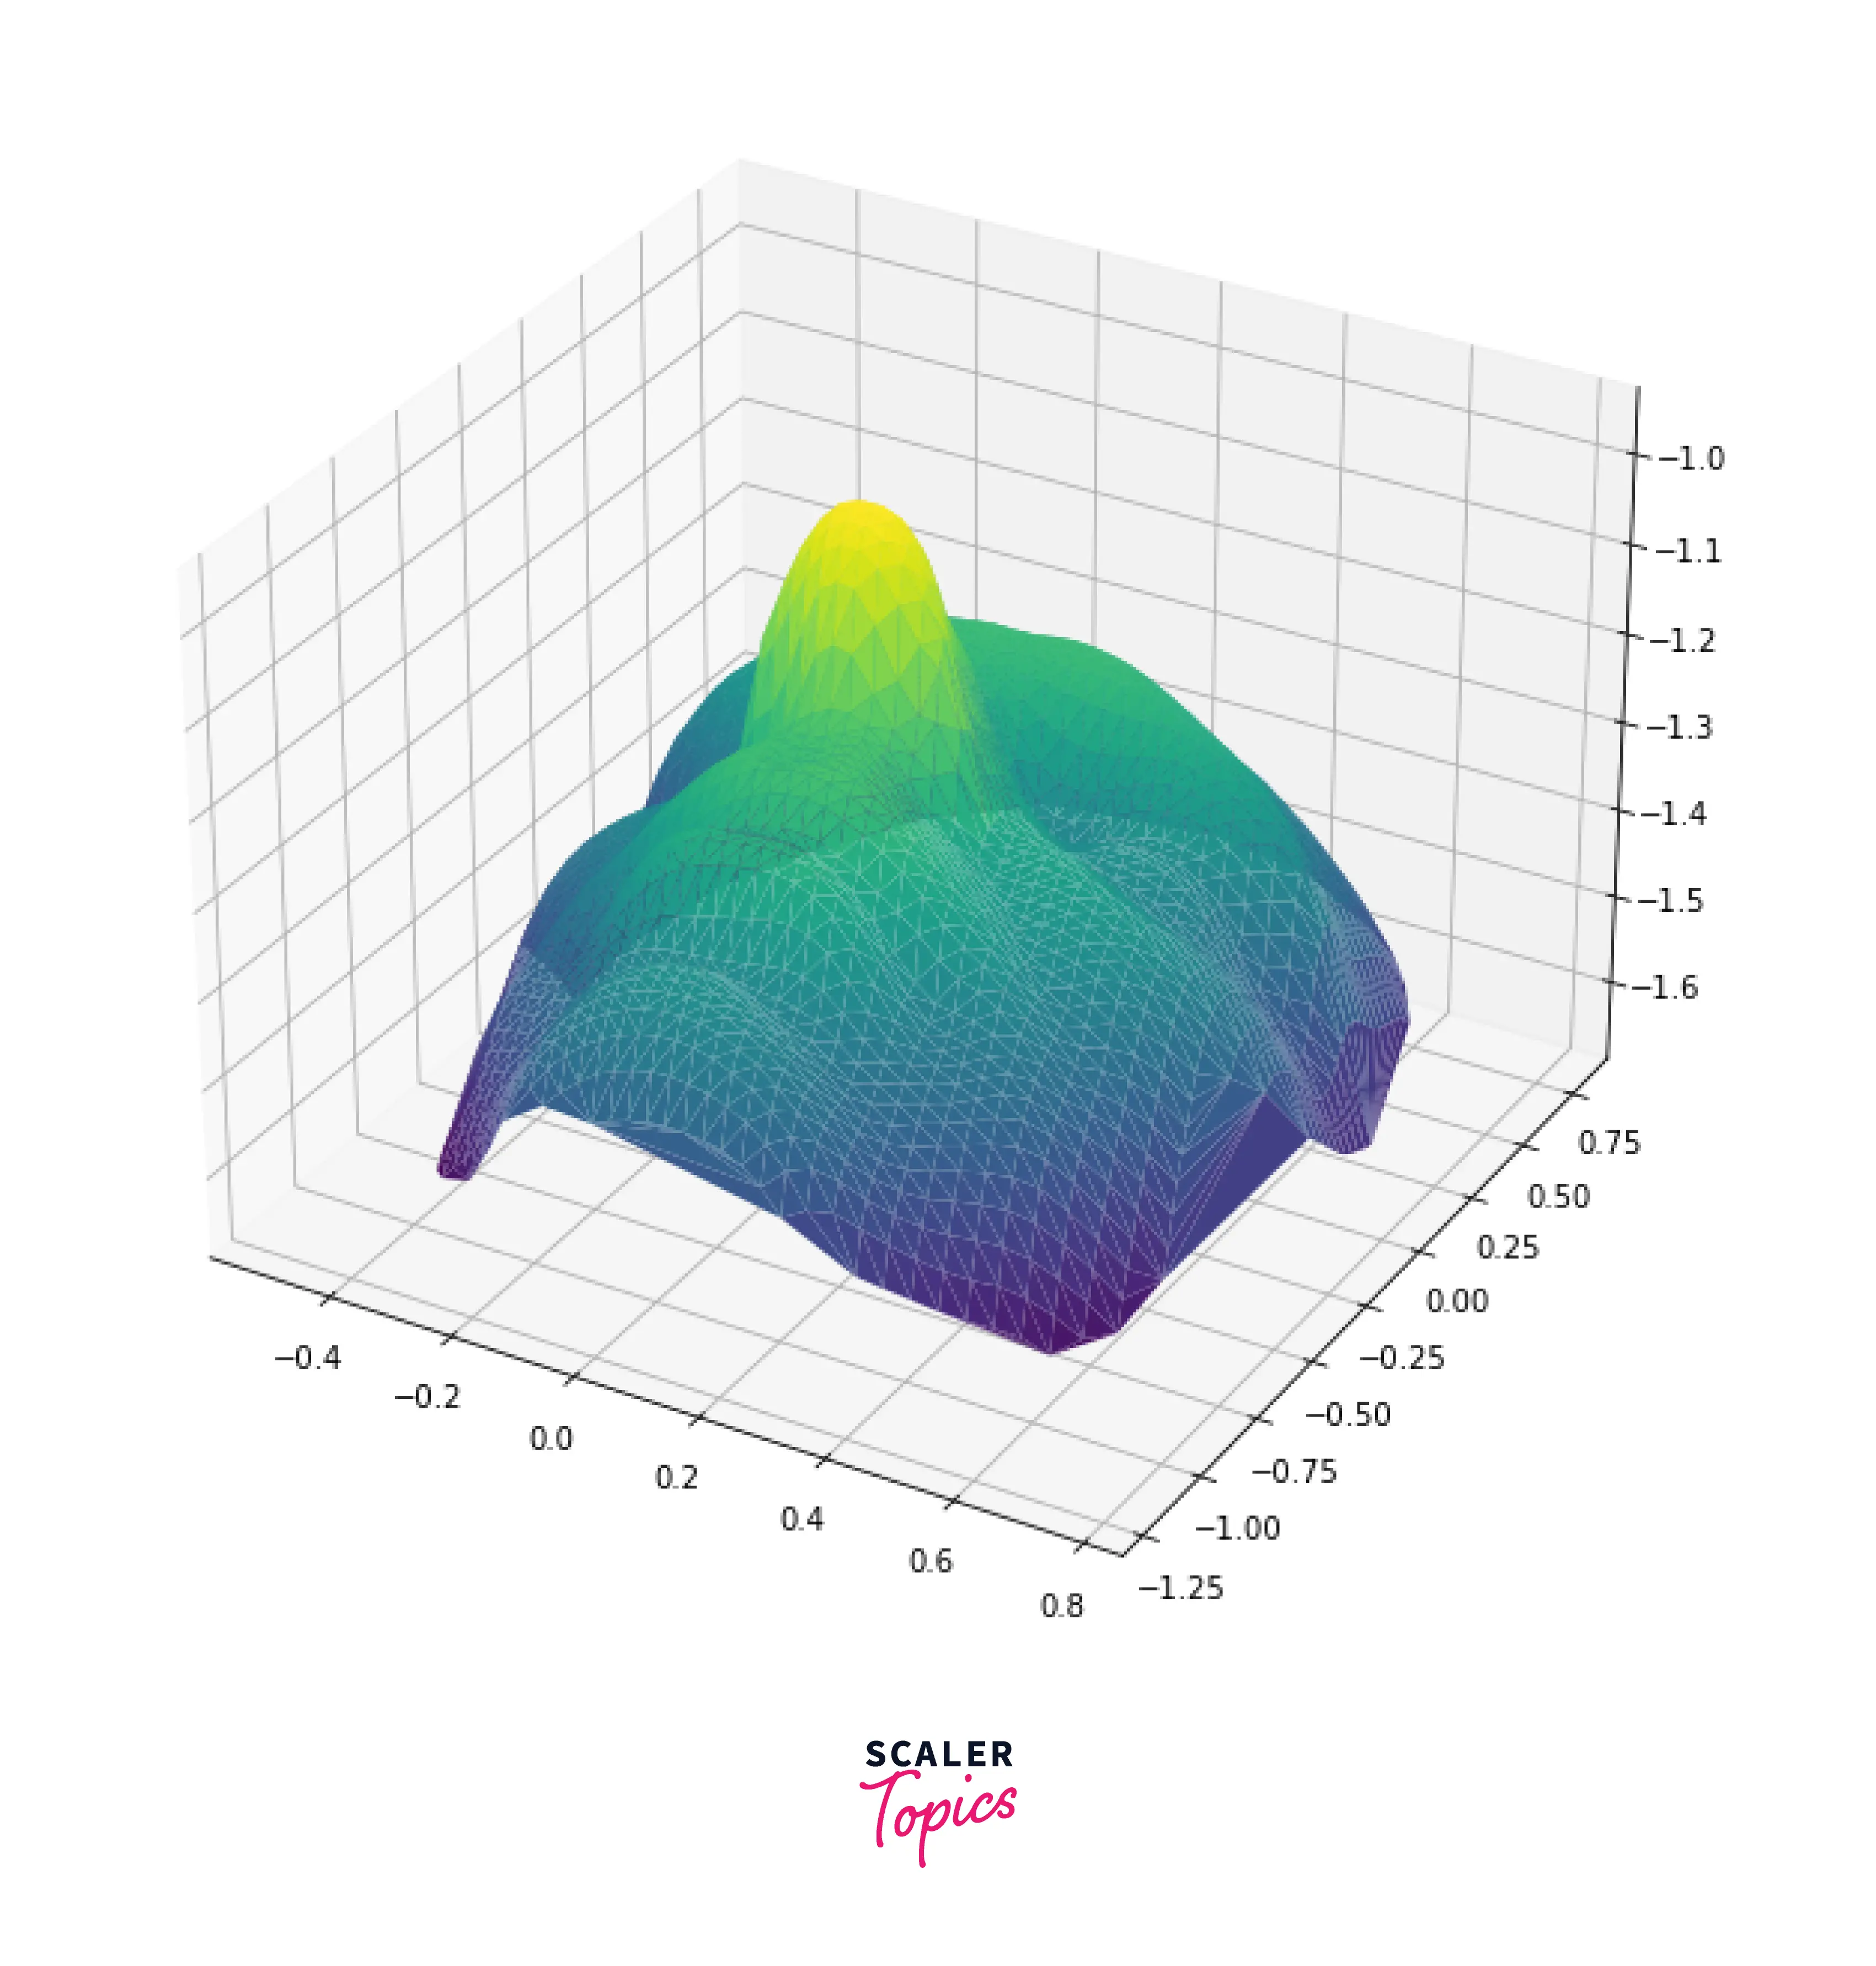
Triangulating a Face in Matplotlib
For Triangulating a face, we need data (3d coordinate) that describe a face. Here is the link for the data used.
Output:
Explanation:
- We import the required modules.
- We set up the size of the figure using matplotlib.rcParams["figure.figsize"].
- plt.figure().gca(projection='3d') changes the figure from 2D to 3D.
- face.vert is a vertex shader file that contains the x, y, and z coordinates of the triangulated face at each row. It is a file that contains the data about-face.
- We need to read the face.vert file, convert the coordinates from string to float, and store it in the array faceData.
- ax.plot_trisurf() is a type of surface plot created by triangulation so that every point on the surface is covered in the triangle.
- We use the faceData array, which contains the data points of x, y, and z axes to plot the triangulated face in which color mapping is Viridis.
- matplotlib.pyplot.show() is used to show the plot of the triangulated face.
How to Create an Elliposoide Using Triangulation
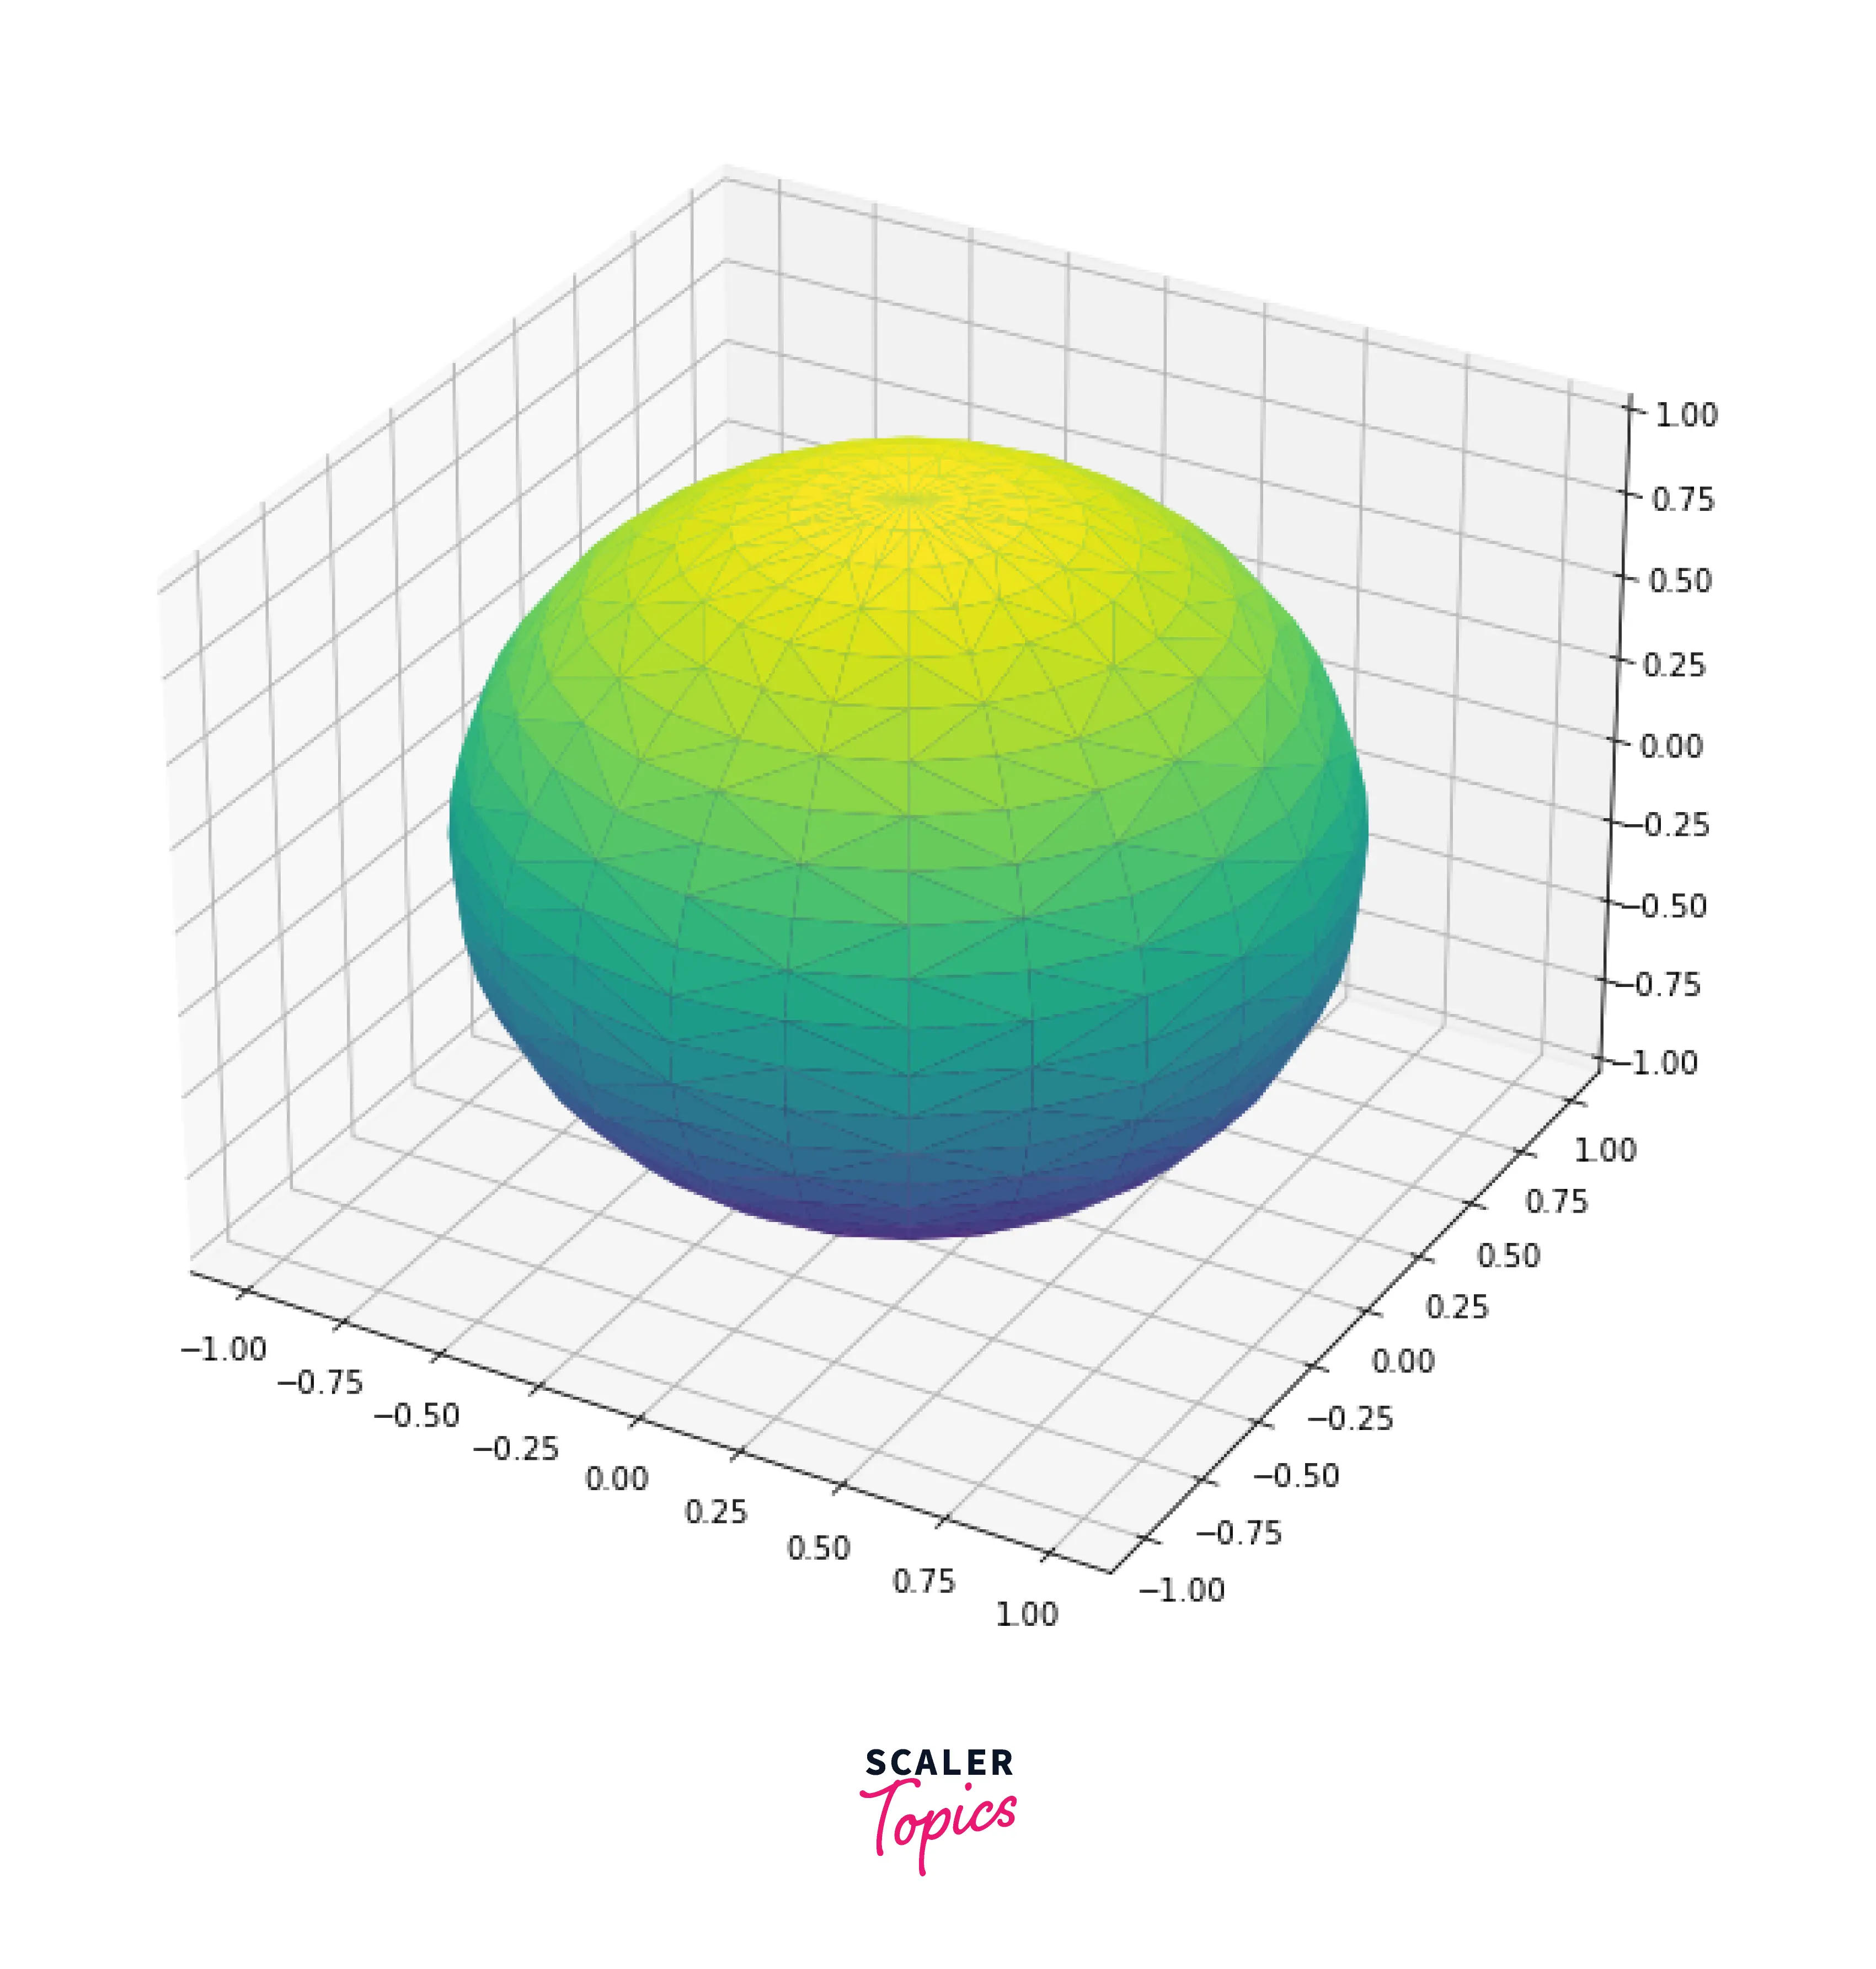
1. Sphere
To plot a sphere in matplotlib using triangulation, we need to parameterize the sphere. On x-axis we take the outer product of two vectors cos(a) and sin(b), on the y-axis we have to take the outer product of sin(a) and sin(b) then on z-axis we take cos(b).
Where a is a list of evenly spaced numbers from 0 to 2π and b is a list of evenly spaced numbers from 0 to π evenly spaced numbers.
Here is the code for plotting a sphere using matplotlib triangulation:
Output:
Explanation:
- We import the required modules.
- We set up the size of the figure using matplotlib.rcParams[“figure.figsize”] to get a better view of the plot.
- plt.figure().gca(projection=‘3d’) changes the figure from 2D to 3D.
- List a and b contains 25 evenly spaced numbers generated using the function numpy.linspace().
- numpy.mesh grid() returns the coordinate matrices from the coordinate vector and takes a 1D array representing the coordinate of a grid as a parameter.
- List x,y and z are the outer product of the vectors (cos(a) and sin(b)) , (sin(a) and sin(b)) and (array of ones and cos(b)) respectively generated using the function numpy.outer() and array of ones is generates using numpy.ones().
- matplotlib.pyplot.show() is used to show the plot of the triangulated sphere.
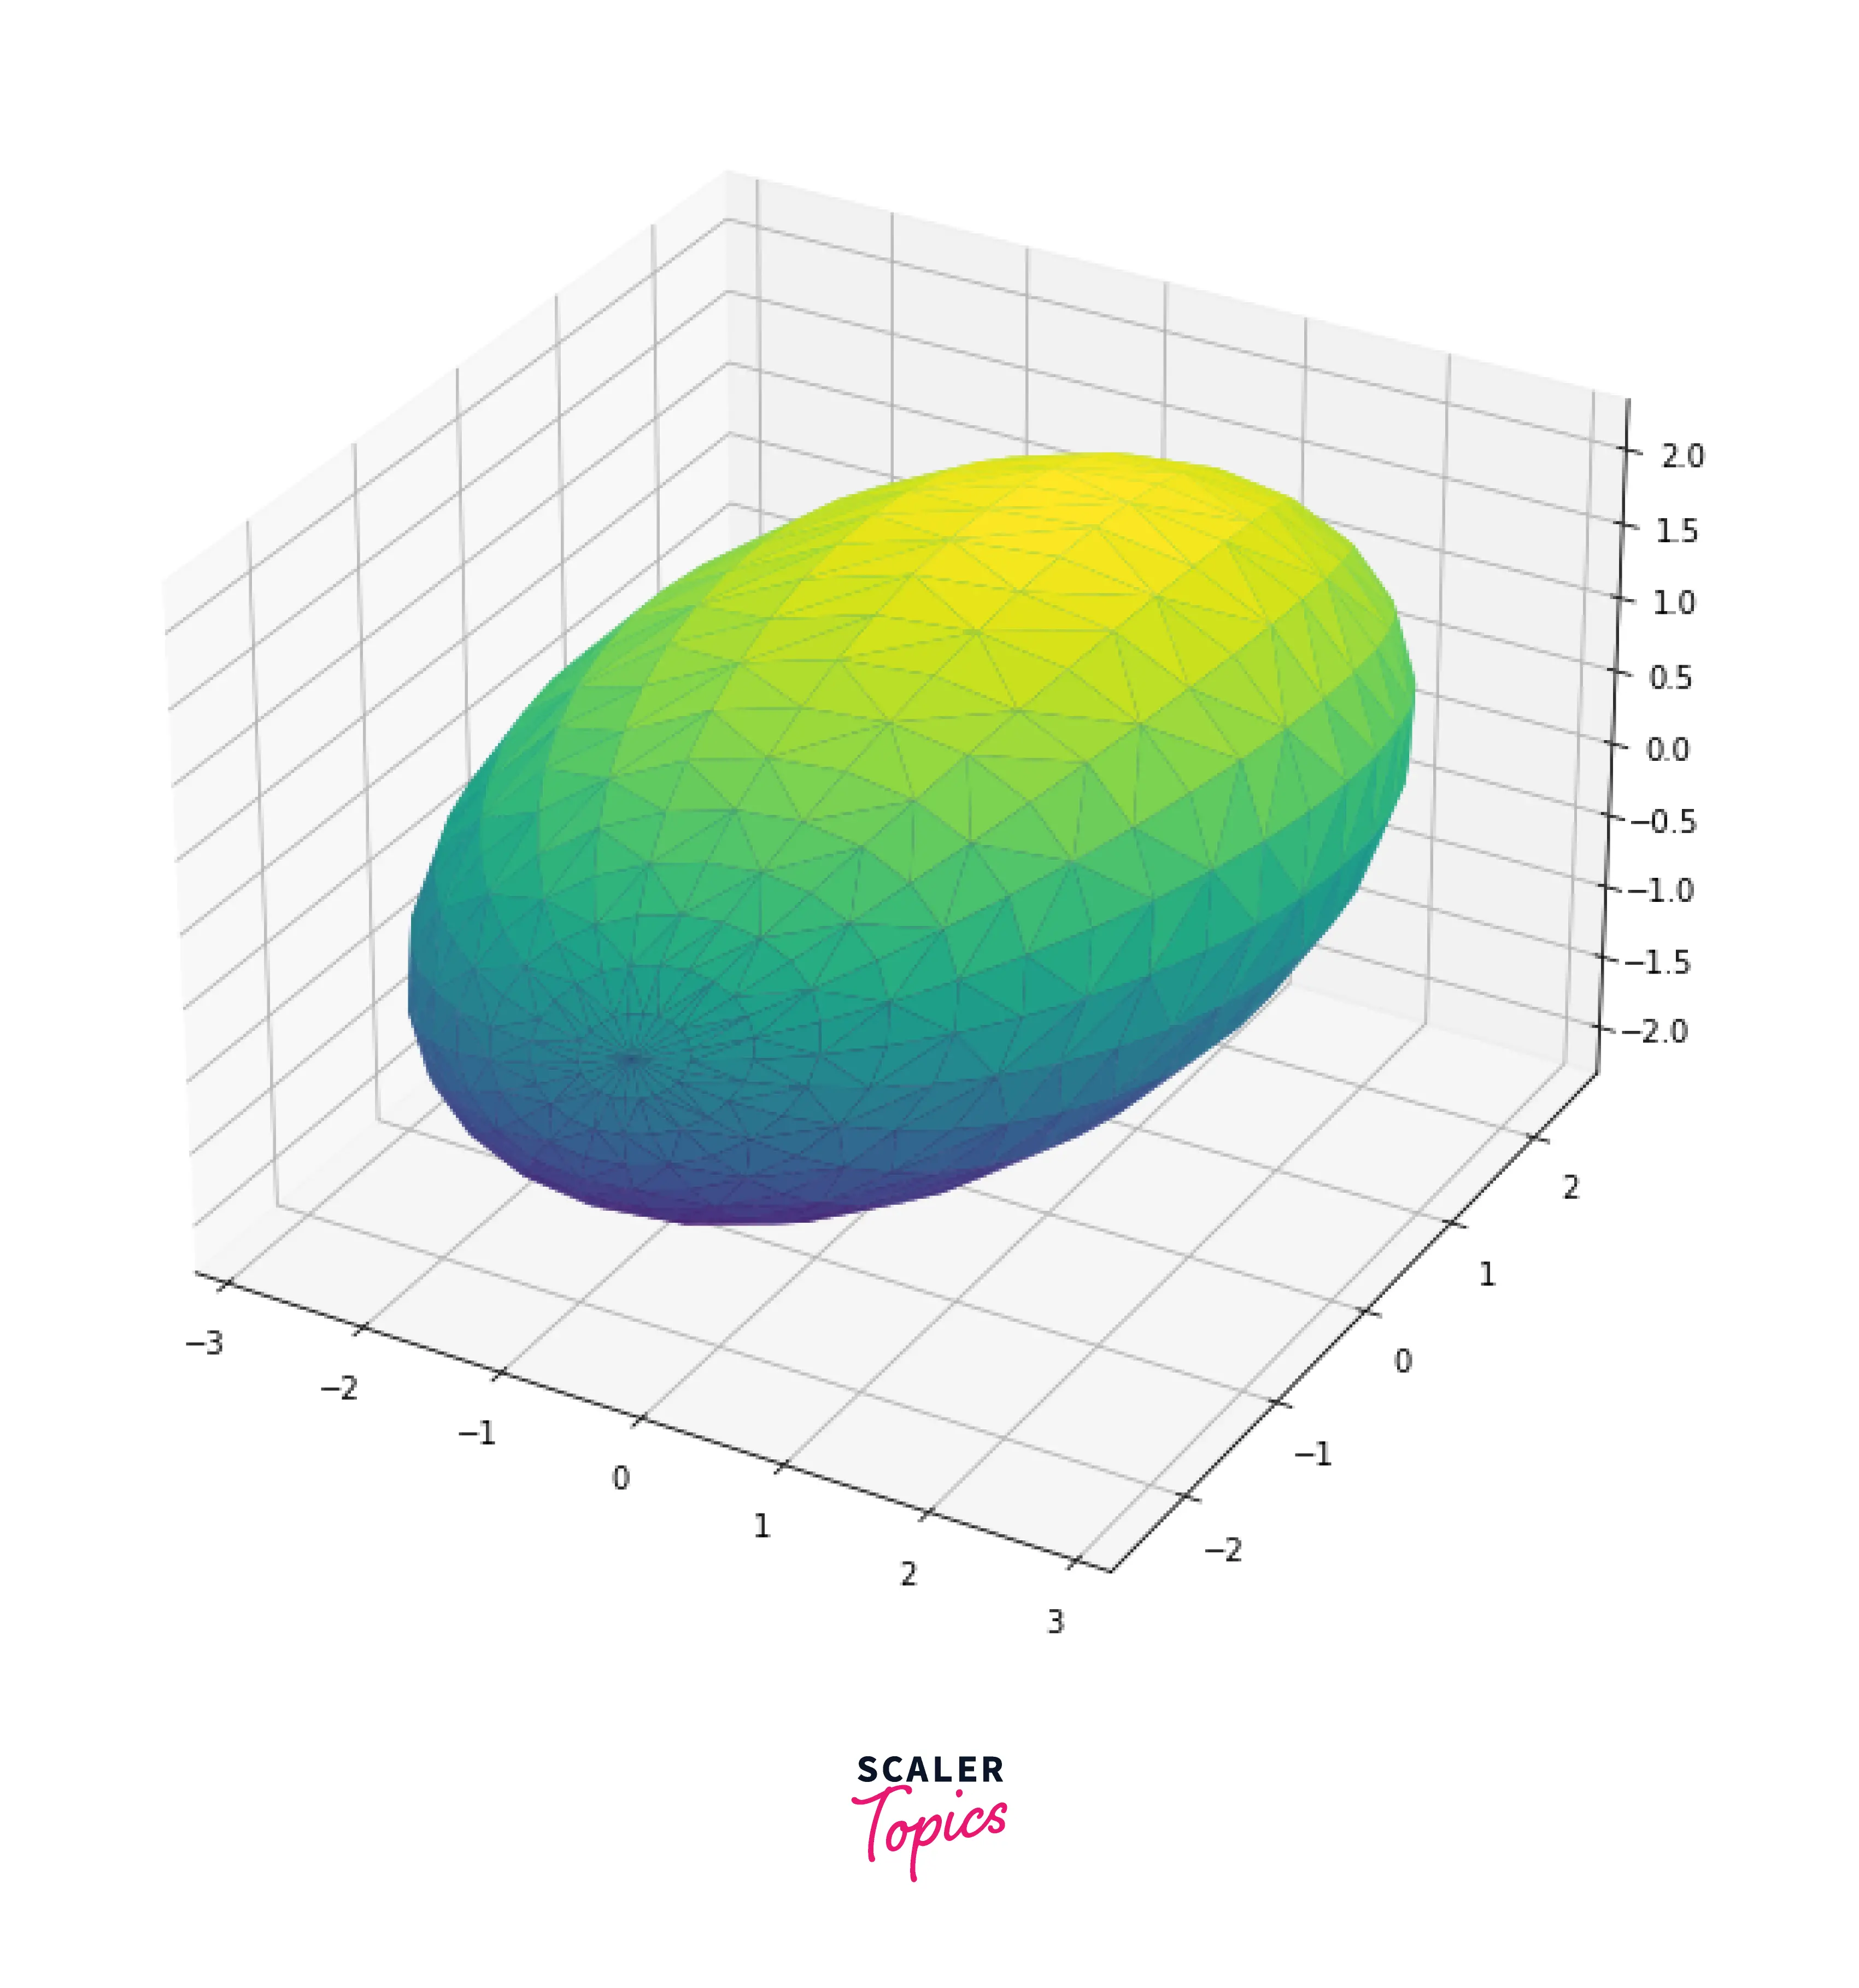
2. Ellipsoid
First, we have to define a matrix. It represents the axes of an ellipsoid and the stretching along those axes.
Here is the code for plotting an ellipsoid using matplotlib triangulation:
Output:
Explanation:
- We import the required modules.
- We set up the size of the figure using matplotlib.rcParams[“figure.figsize”] to get a better view of the plot.
- plt.figure().gca(projection=‘3d’) changes the figure from 2D to 3D.
- A is the covariance matrix.
- Array a and b contains 25 evenly spaced numbers ranging from 0 to 2*pi and 0 to pi respectively generated using numpy.linspace().
- Array x,y and z contains the outer product of the vector (cos(a) and sin(b)), (sin(a) and sin(b)) and (array of ones and cos(b)) respectively as these array are multiplied by covariance matrix A to get the coordinate for plotting ellipsoid.
- numpy.zeros() returns an array of zeros.
- matplotlib.pyplot.show() is used to show the plot of the triangulated ellipsoid.
Scaler Placement Report and Statistics
Scaler learners achieved 2.5x salary growth with average post-Scaler CTC reaching ₹23L.
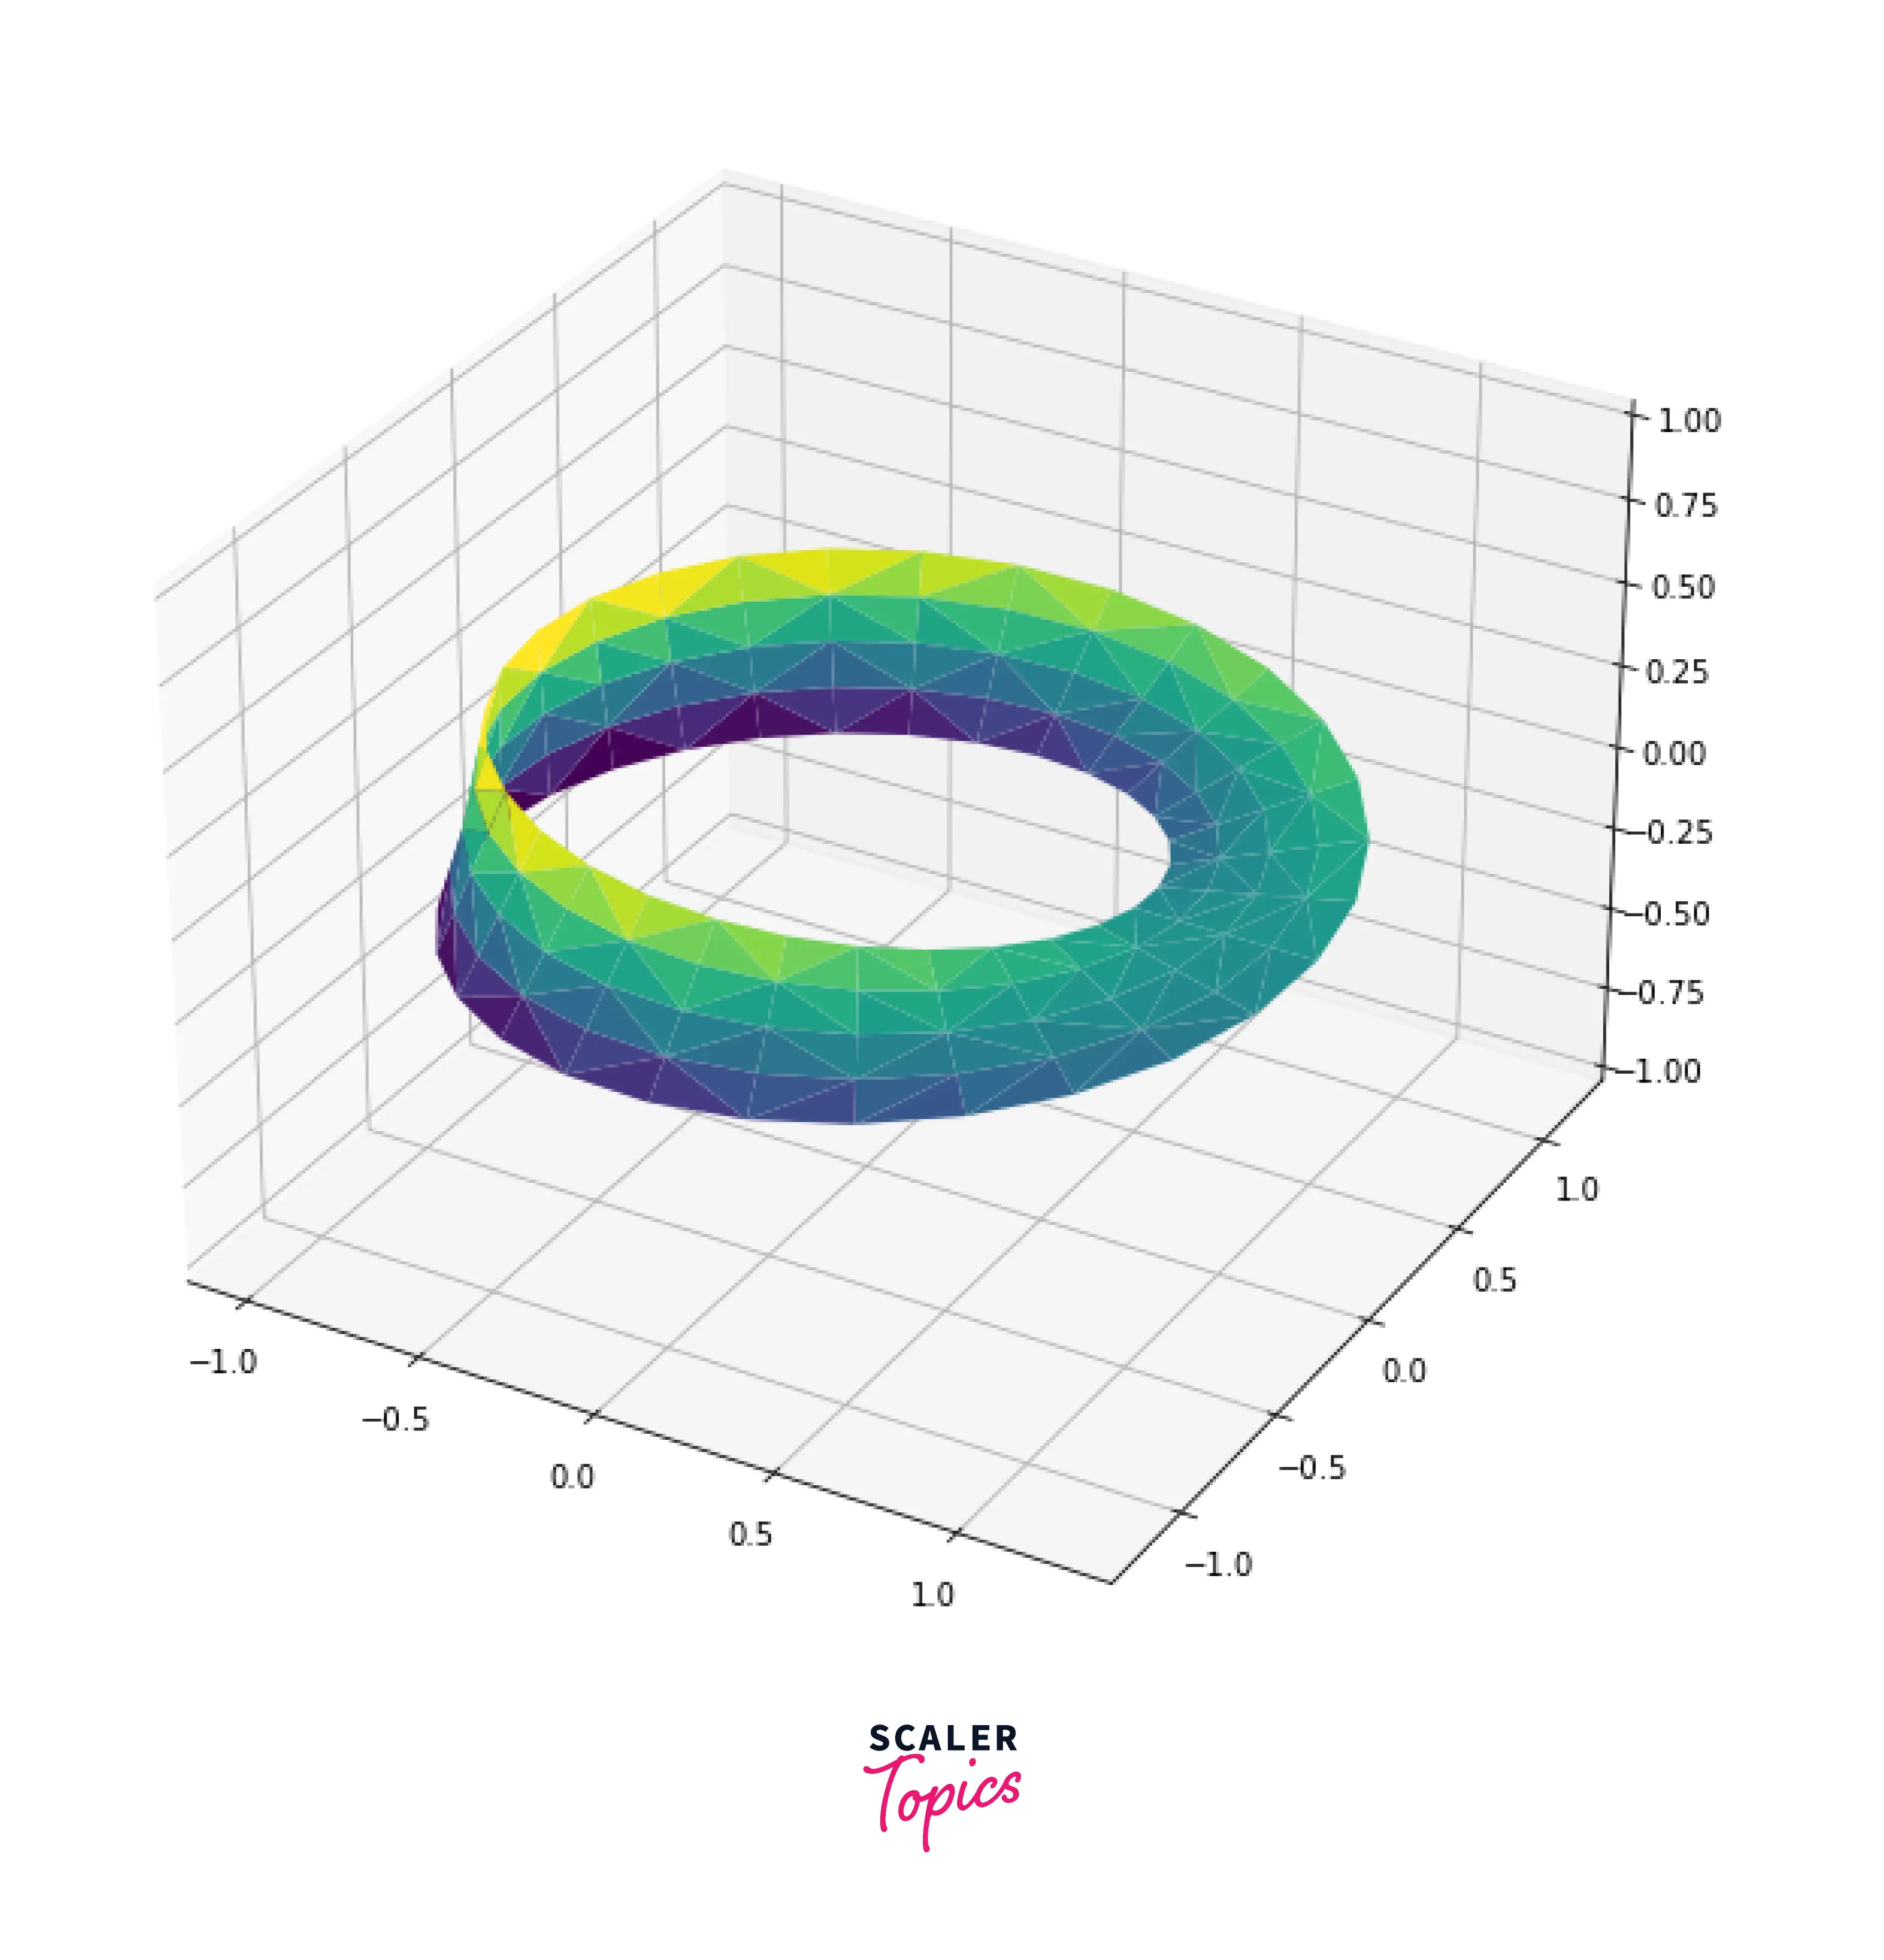
Using Delaunay triangulation
Mobius Strip
Output:
Conclusion
- Plotting points in 3D space to make a continuous surface can be possible only by triangulation.
- Delaunay triangulation is an algorithm that covers every point on the triangle's surface.
- Plotting triangulation in 2D plane can be done by using the function matplotlib.tri.Triangulation() to generate triangles and matplotlib.pyplot.triplot() to plot the triangulated figure.
- Plotting triangulation in 3D space can be using the ax.plot_trisuf(), which takes the x, y, and z list of data points.
- Triangulating a face can be done using the Delaunay algorithm, but we need the vertex shader file for the vertex of the triangles covering the face.
- Using the Delaunay algorithm, we can also triangulate sphere and ellipsoid.