Integrating a Plot to a wxWidgets User Interface
Overview
Python is well-deservedly one of the most sought-after programming languages of this century and is home to many high-performance and utility-efficient libraries that make our lives as developers easy.
It is also one of the languages that seem to have libraries and modules that work well with hardware and software. From Web Development to Machine and Deep Learning, practically anything is possible with Python. In this article, we will talk about wxWidgets, a library that allows us to create platform-specific user interfaces with features such as being interactive and accessible.
Transform Your Career
Choose from our industry-leading programs designed for career success
Modern Software and AI Engineering Program
Master full-stack development with AI integration

Modern Data Science and ML with specialisation in AI
Advanced data science techniques with AI specialization
Advanced AIML with Specialisation in Agentic AI
Deep dive into AIML with focus on Agentic systems
DevOps, Cloud & AI Platform Engineering
Build and manage AI-powered cloud infrastructure
AI Engineering Advanced Certification by IIT-Roorkee
Premier AI engineering certification from IIT-Roorkee
Introduction
As discussed earlier in this article, Python is adaptable and dynamic because it is easily interoperable with various applications and hardware. Python allows us to build everything, from scanners to sophisticated machine-learning algorithms. GUI is one of the most known applications in the never-ending list of Python applications.
We can build functional prototypes for anything from a web application to an Android app using GUIs. Developers use GUI applications and Python modules when they have to release a quick demo of their new features/systems. Some well-known GUI modules in Python are PyGlet, GTK, TKinter, and wxWidgets.
In this article, we’ll talk about the wxWidgets interface and show how to use Matplotlib with it.
What are wxWidgets?
A user-interface framework called wxWidgets is a subset of wxPython; a collection of various Python modules and wxWidget libraries to create a perfect GUI-building atmosphere. Amongst other things, wxWidgets are very versatile. They can be used to create standalone GUI applications or when we have to work with multiple programming languages (like Python with Java/C++).
Using various GUI libraries like TKinter and GTK, we can easily integrate Matplotlib with GUI to integrate a plot. The only disadvantage of such libraries is that the User Interfaces created by Tkinter and GTK have a look and feel and don't adapt to the look and feel of the platform it runs on. This is what wxWidget overcomes. Since it is bound to Python by the wxPython module, its graphical user interfaces will have the look and feel of the platform it is running on.
This means an application made using wxWidgets created in a Windows machine will look and feel different from the one created in a Linux Environment.
Turn Learning into Career Growth
Integrating a Plot to a wxWidgets User Interface
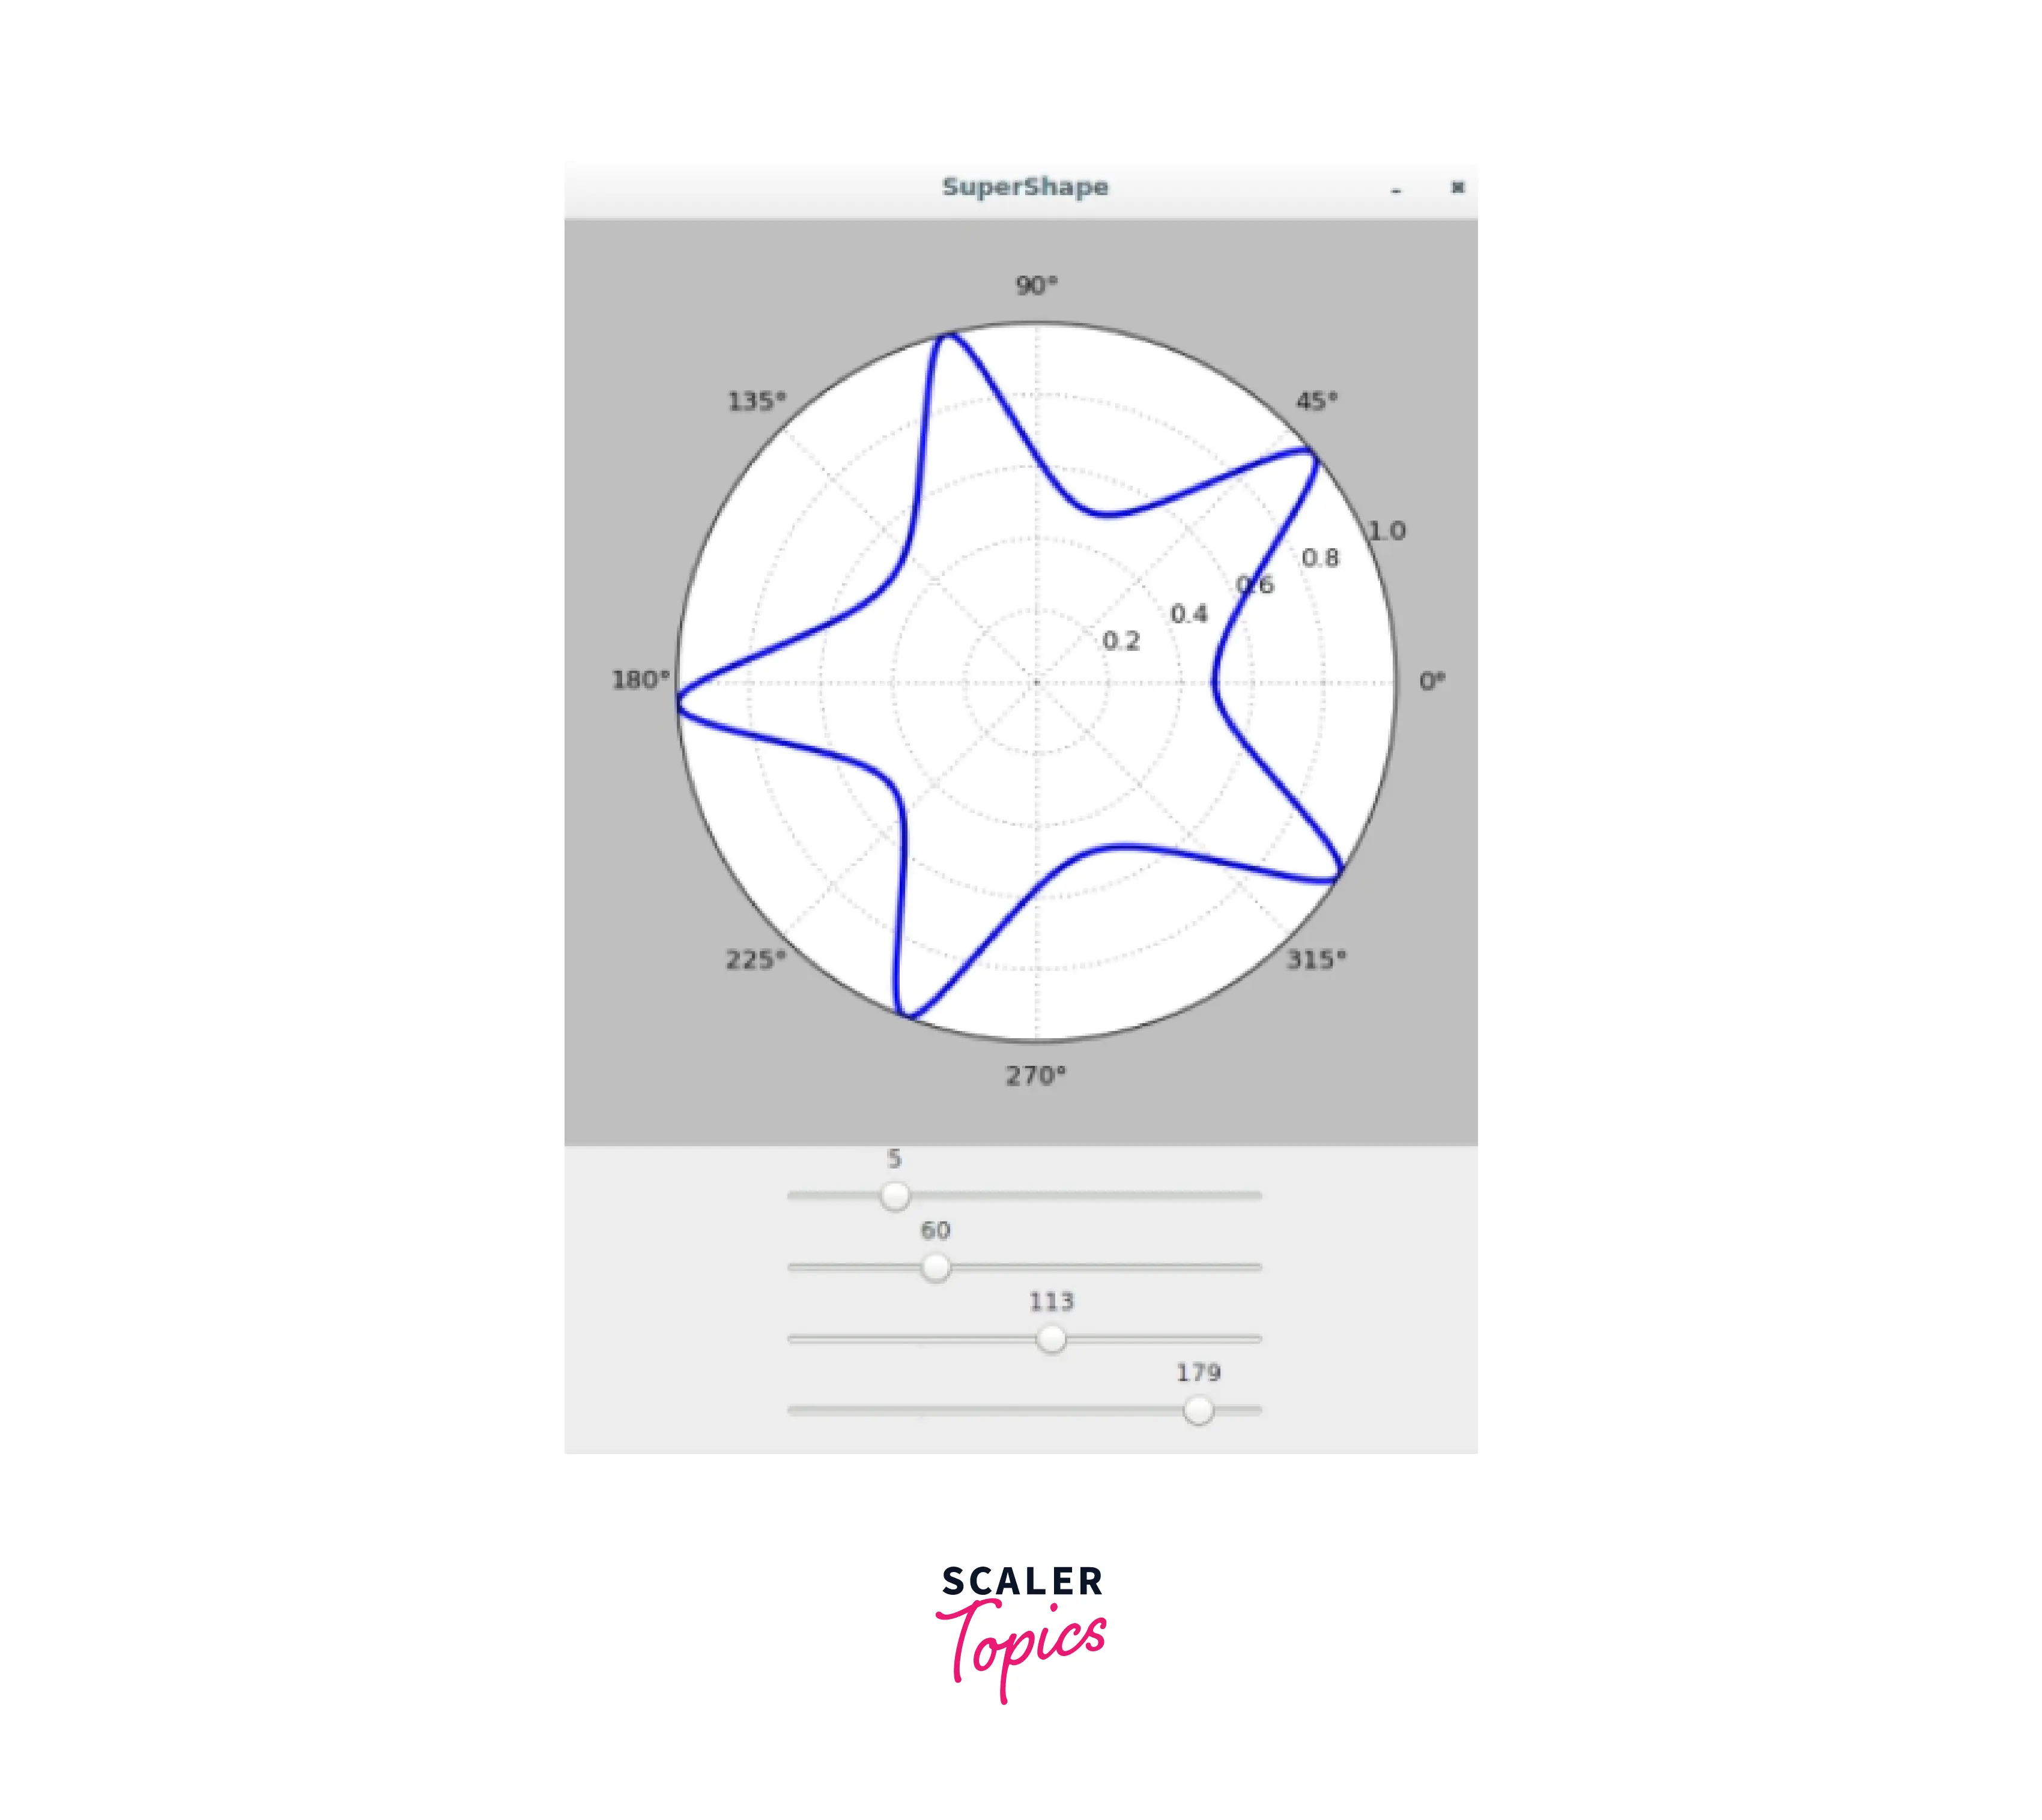
With the help of wxWidgets, we can create visually appealing and interactive graphical user interfaces, with the ability to inherit the design of whatever platform it is running on. To understand the working of wxWidgets with a plotting library such as Matplotlib, we will look at an example, where we would create a SuperShape figure with interactive buttons.
Output:
Code Examples
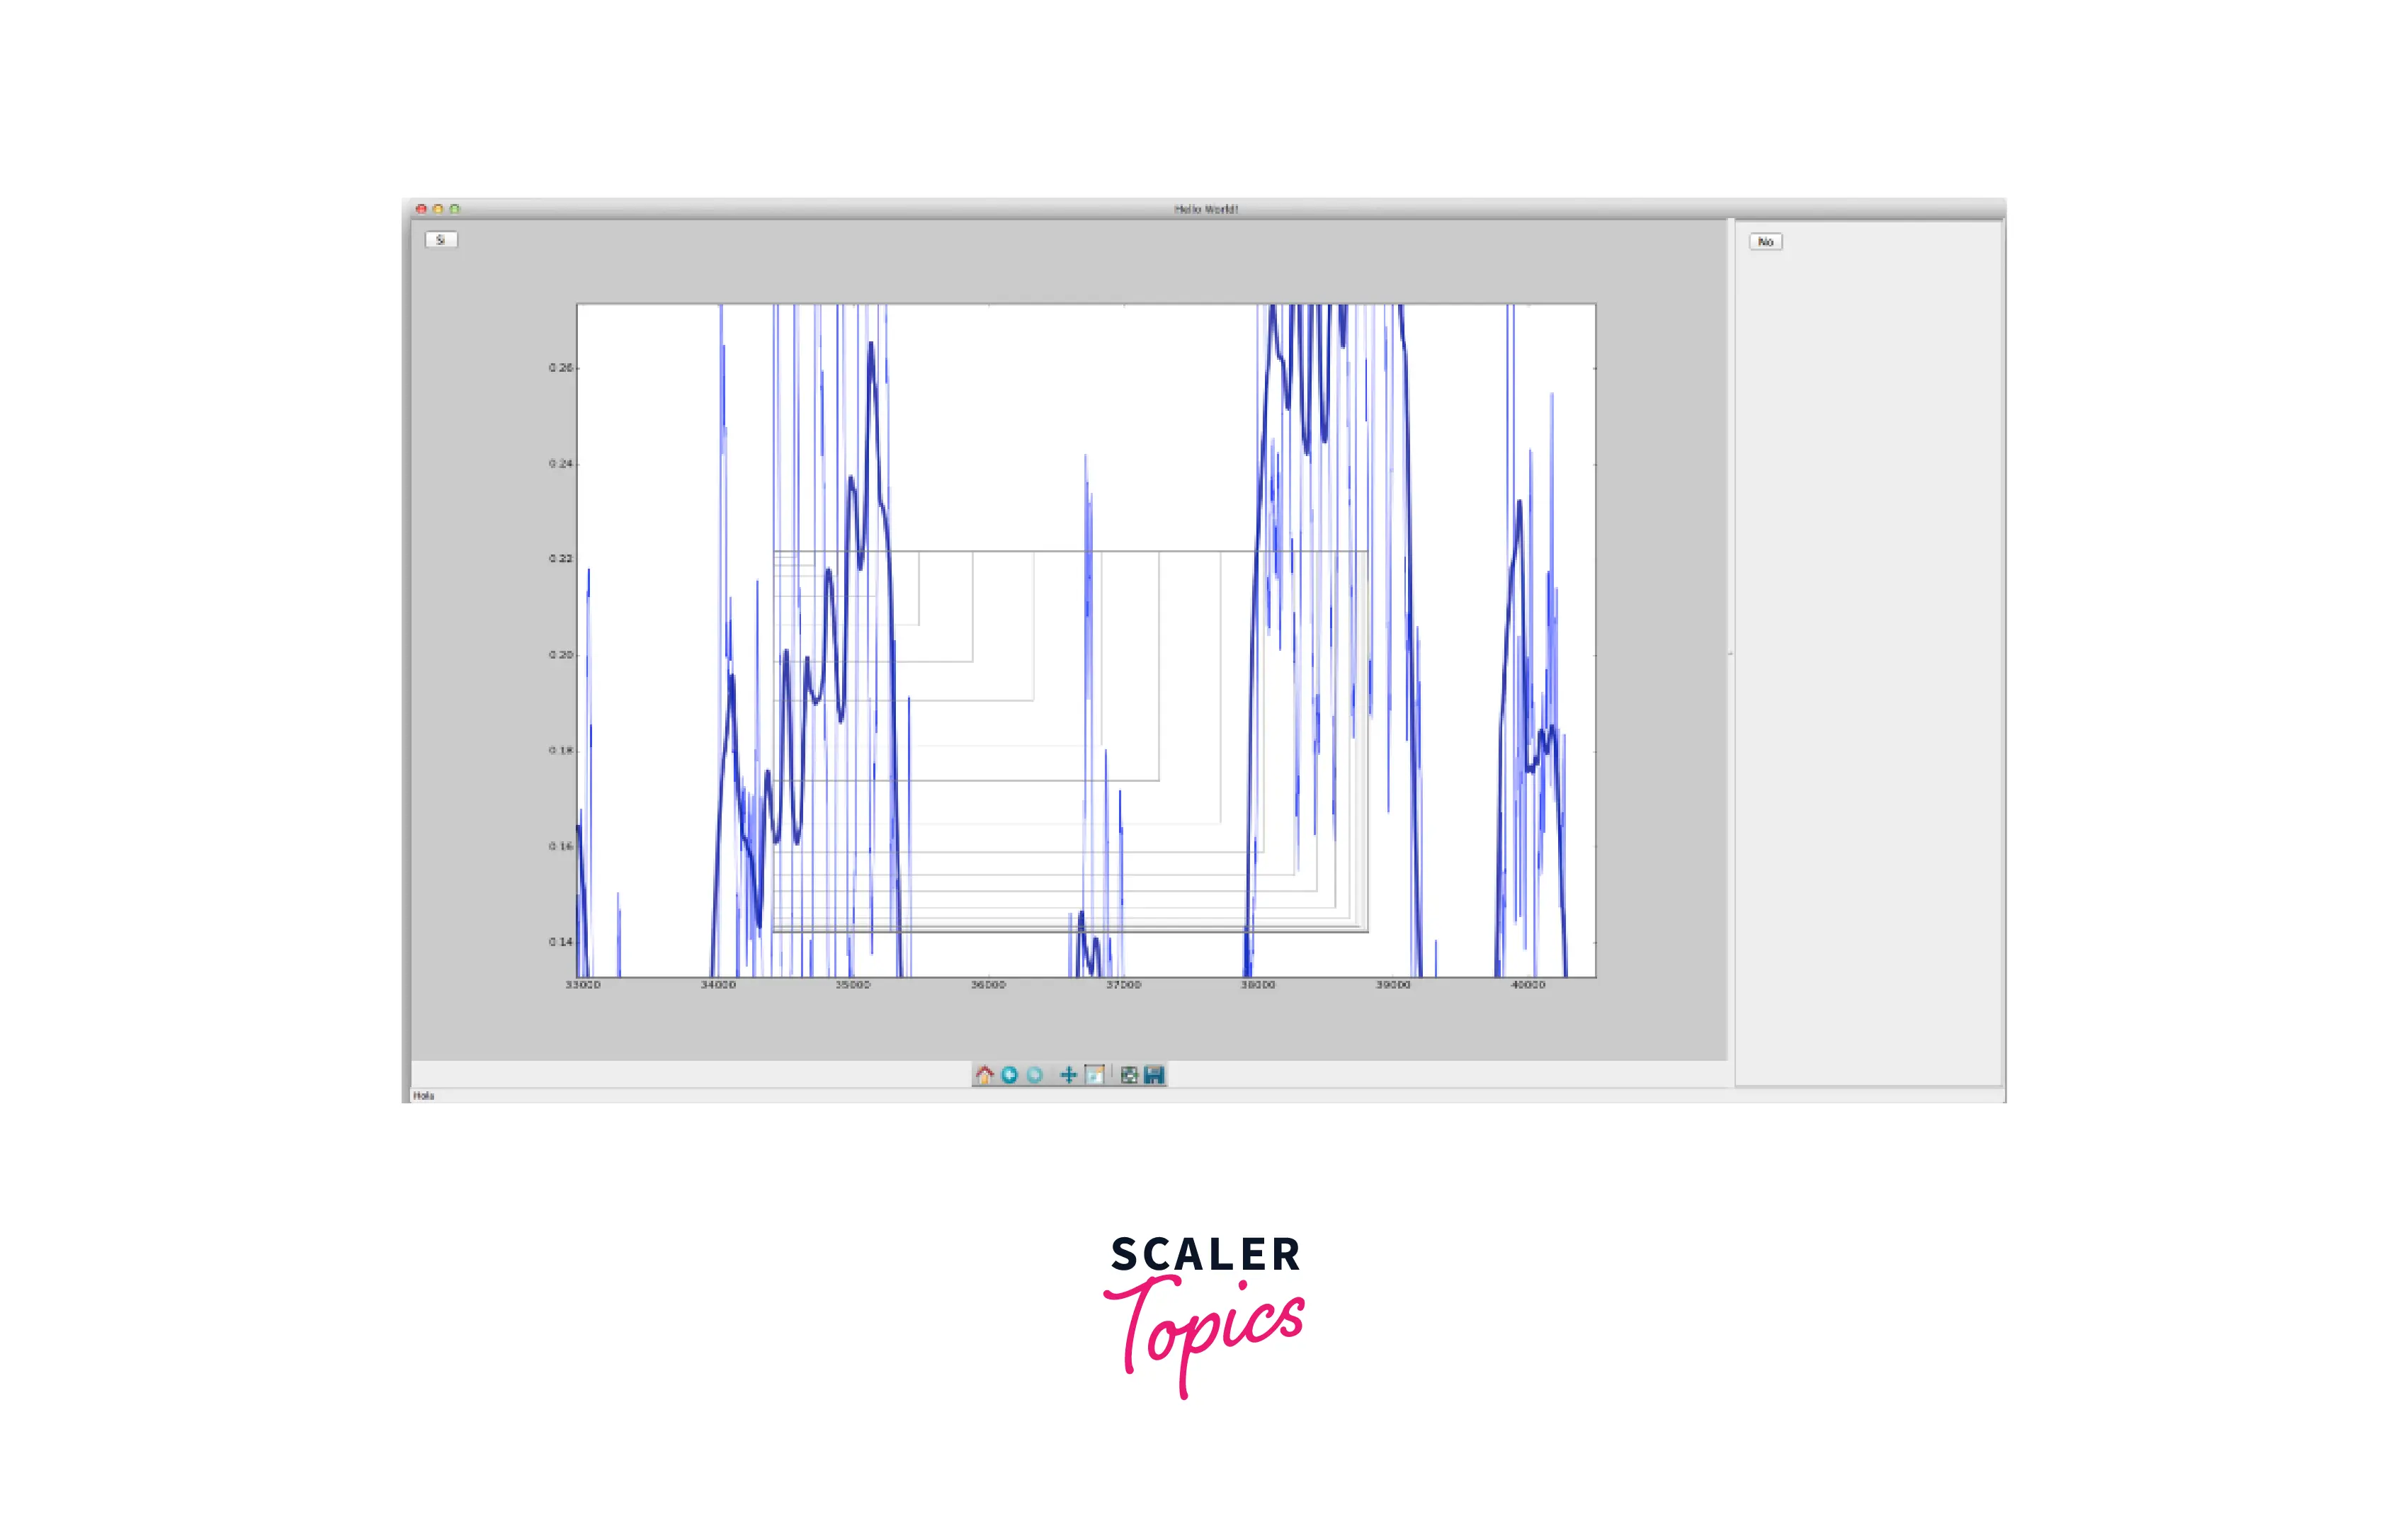
- Using wxWidgets to create a seismic plot using Matplotlib
In this section, we will go over an example in which we will create a seismic plot using the integration technique we learnt previously in this article.
Output:
Conclusion
- In this article, we learned about wxWidgets; A GUI library made in Python that allows us to create state-of-the-art GUI with great accessibility. The striking feature that makes wxWidgets stand out from other GUI modules is that it recognizes and uses the looks and feel of the platform it runs on.
- Apart from this, we learned ways to integrate Matplotlib with wxWidgets; which allows us to design interactive GUIs and visualizations that the user can alter to suit his or her needs.