How to Plot in Matplotlib?
Overview
Python has a library known as Matplotlib to display numeric data in the form of plots, graphs, and charts in Python. It provides a wide variety of functionality for plotting and is a very useful library that helps plot different graph figures, like line plots, bar graphs, contour plots, histograms, scatter plots, etc.
Matplotlib - Pyplot API
The Pyplot API is collection of command-style functions that make Matplotlib work like MATLAB. The unique feature of the Pyplot API is that it always makes some changes to a figure. For example, creating a figure, creating a canvas to plot an image, etc.
Another striking feature of the Pyplot API is that it generally works on the Axes object. This is because it is less flexible than the standard object-oriented APIs provided by Matplotlib. The main application of Pyplot is to create interactive and user-customizable plots.
Syntax for Importing the Matplotlib Library along with the Pyplot:
or
How to Create a Plot in Matplotlib?
For plotting in Matplotlib, we have to import the library Matplotlib, and further import a collection of function pyplot for plotting points(data) to visualize it on the graphs, charts, and plots from it. For example, the plot() function is used to plot points in a graph and connects the points through lines. The Matplotlib.pyplot.plot() function is used for visualizing data in different types of plots.
The Function Takes at least Two Parameters for Specifying Coordinates in the Diagram
- Parameter 1: An array or a list containing the points on the x-axis.
- Parameter 2: An array or a list containing the points on the y-axis.
Plotting points are the simplest example of the plot() function. The plot () function takes two parameters for specifying plot coordinates:
- An array of X-axis coordinates.
- An array of Y-axis coordinates.
Example:
Scaler Placement Report and Statistics
Scaler learners achieved 2.5x salary growth with average post-Scaler CTC reaching ₹23L.
Figure1: Plotting Points Using Plot() Function:
Output:

Transform Your Career
Choose from our industry-leading programs designed for career success
Modern Software and AI Engineering Program
Master full-stack development with AI integration

Modern Data Science and ML with specialisation in AI
Advanced data science techniques with AI specialization
Advanced AIML with Specialisation in Agentic AI
Deep dive into AIML with focus on Agentic systems
DevOps, Cloud & AI Platform Engineering
Build and manage AI-powered cloud infrastructure
AI Engineering Advanced Certification by IIT-Roorkee
Premier AI engineering certification from IIT-Roorkee
Code Explanation:
- First, we import the Matplotlib module and collection of functions - "pyplot".
- For plotting points, we define the co-ordinates using two arrays, "x_axis" and "y_axis".
- To plot the points on the plot Matplotlib.pyplot.plot() or plt.plot() function is used.
- Matplotlib.pyplot.show() or plt.show() function is used for visualizing the coordinates on the XY plane.
Some More Examples on Plotting in Matplotlib
Example 1: Simple Plotting
Output:

Code Explanation:
Plotting points on a detailed graph
- Import required modules.
- For plotting points, we define coordinates using two arrays, "xaxis" and "yaxis".
- We then Define the x and y labels using Matplotlib.pyplot.label() or plt.label(), which uses a string as an argument to label the x-axis and y-axis.
- Matplotlib.pyplot.title() or plt.title is used to set the title of the Matplotlib plot, which takes a string as an argument to set the title.
Example 2: Plotting Two or More Lines on the Same Plot
Output:

Code Explanation:
Plotting two lines on the same figure
- Importing required modules.
- For plotting points, we have to define coordinates using two arrays, "x1" and "y1" for the first line and "x2" and "y2" for the second line.
- For plotting points on a plot, Matplotlib.pyplot.plot() or plt.plot() function is used, which has parameters for x and y values, labels the line, and sets the color of the line.
- Matplotlib.pyplot.title() or plt.title is used to set the title of the Matplotlib plot, which takes a string as an argument to set the title.
- Matplotlib.pyplot.legend() or plt.legend to show a plot legend.
- We then Define the X and Y label using Matplotlib.pyplot.label() or plt.label(), which uses a string as an argument to label the X and Y-axis.
Turn Learning into Career Growth
How to Plot a Curve in Matplotlib?
Line plots are generated from the scattered data list and are straight lines connecting the coordinates, which are quite inappropriate when we visualize maths functions on the plot. We need a smoother curve for data visualization to make plots look understandable and elegant, which Matplotlib and NumPy modules can do.
Syntax for Importing the Required Modules:
For plotting a smoother curve, we need data that can easily be generated. We use the numpy library for this purpose. For example, we can plot different Math functions on the plot such as quadratic equations, Trigonometric functions, etc., using Matplotlib and NumPy Module as shown in the following section.
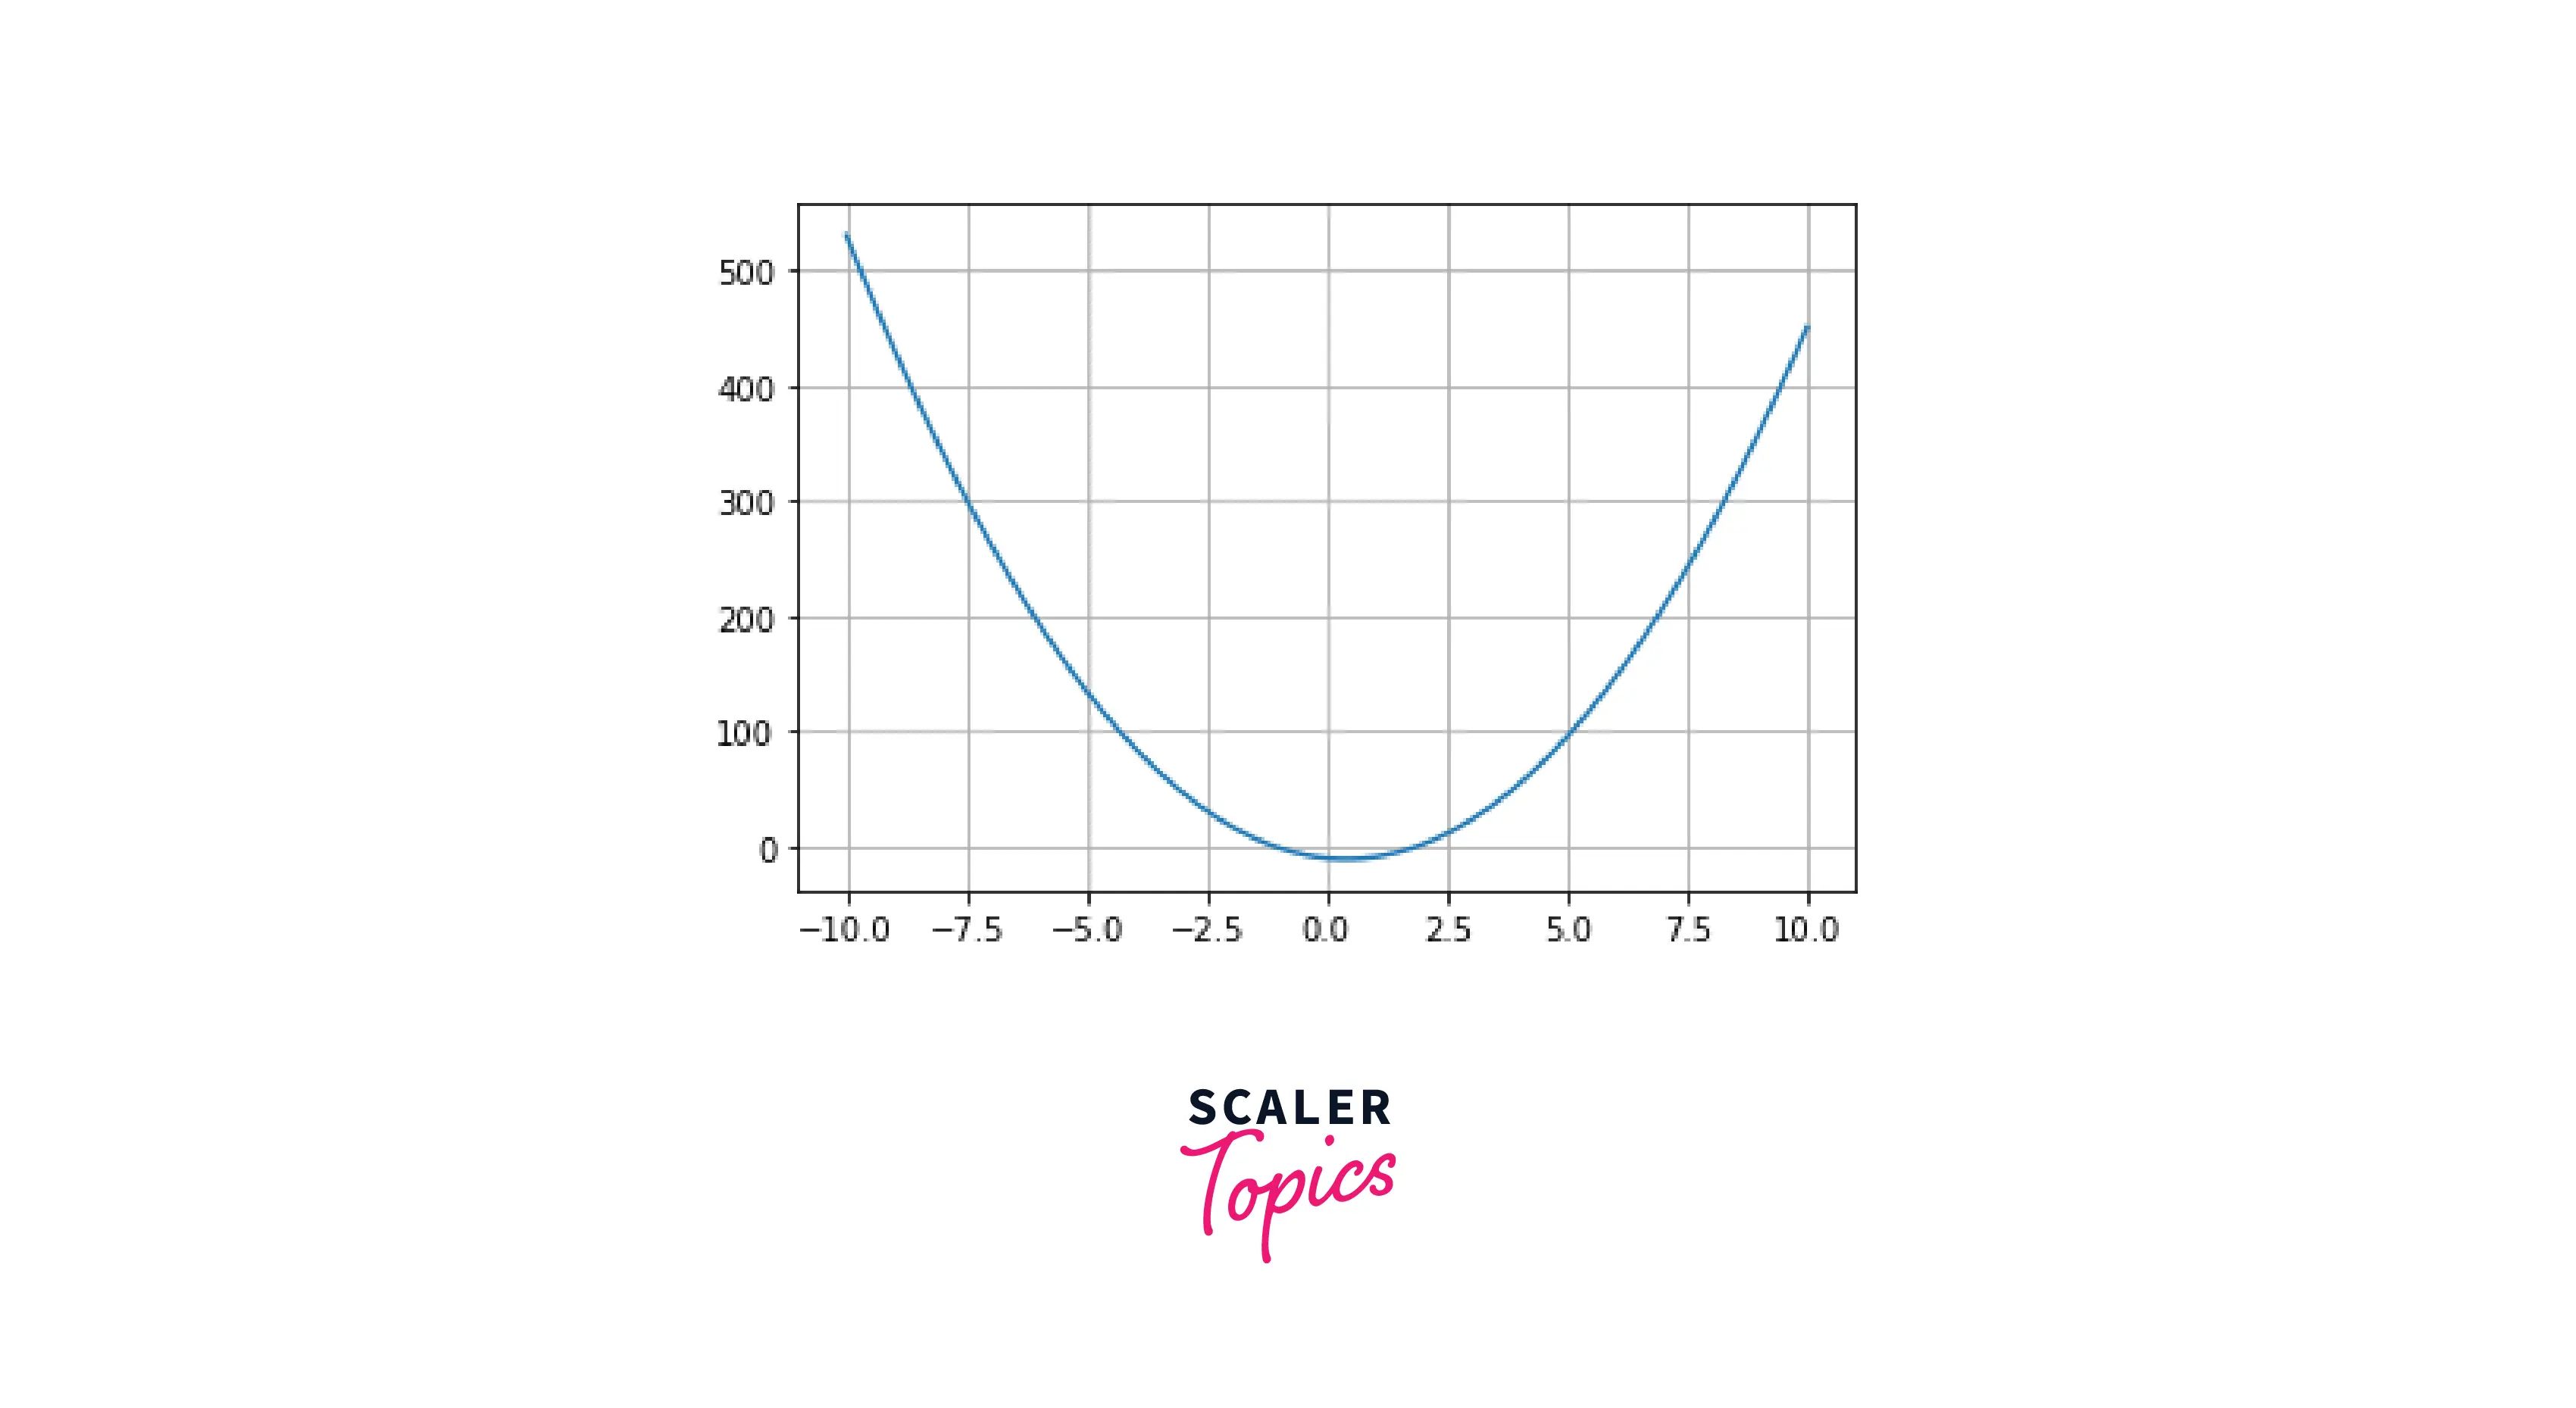
Plotting One Curve Using Numpy
Example:
Output:

Code Explanation:
Plotting a curve using Matplotlib and Numpy
- Import the required modules Matplotlib.pyplot, and numpy.
- Set the value of the coefficient of the quadratic equation.
- Then, np.linspace function is used, that returns the evenly spaced samples, calculated over the interval
- y is the list of values of the quadratic equation according to values of x to plot in on the graph.
- Matplotlib.pyplot.plot or plt.plot() is used to plot the curve.
- Matplotlib.pyplot.show() or plt.show() is used to show the curve.
Plotting Smooth Curve Using Plotting Points
- We have to determine the spline curve's coefficients using scipy.interpolate.make_interp_spline()
- Using the spline curve's coefficients to estimate the y-value over the closely spaced x-values.
- Evenly spaced x-value can be generated using np.linspace() function as we read earlier.
- There is an optional parameter in np.linspace() to generate several samples; the default value is 50. For a smoother curve value of num needs to be sufficiently high.
Syntax for Importing the Required Modules:
Example:
Output:

Plotting Multiple Curves
We can plot multiple curves on the same graph using Matplotlib.pyplot.plot() function multiple times. Example:
Output:

Scaler Placement Report and Statistics
Scaler learners achieved 2.5x salary growth with average post-Scaler CTC reaching ₹23L.
Plotting Curves from File Data
We can also plot the curve using the file data. But, first, we have to import the file and read the data from it where each row in the file is an index, and we can access column data using a particular column index at each row index. For example:
File name: 'Student_data.txt'
| Roll number | Name |
|---|---|
| 1 | A1 |
| 2 | A2 |
| 3 | A3 |
| 4 | A4 |
For accessing the student information from the file name student data.
Example: Plotting curve from file data
Output:
Conclusion
- Basic Plotting in Matplotlib can be done using matplotlib.pyplot.
- matplotlib.pyplot.plot() function is used to plot the line plot, which takes two parameters.
- For adding detailing to the graphs like title, x and y label, legend, and color of the plots by giving parameters in the matplotlib.pyplot.plot() function.
- Multiple plots can be plotted on the same graph using matplotlib.pyplot.plot() function multiple times.
- Curves can be plotted on the graph using the numpy and scipy modules.
- Multiple curves can be plotted on the same graph using matplotlib.pyplot.plot() function multiple times.
- Plotting curve from the file data we need to read the data from the file, then plot it on the graph.