How to Add Shapes to a Figure in Matplotlib?
Overview
Characters that cannot be drawn in a plot are symbolically represented by shapes in a plot or a map. For example, suppose we want to show a water canal in a plot. We can do this by using a label or creating a shape representing the water canal.
The latter method will be more helpful, as the amount of space left would be much compared to the former. This article will cover various shapes we can create in matplotlib and ways to manipulate them in our plots and subplots.
How to Add Shapes to a Figure in Matplotlib?
In matplotlib, there are various ways of adding shapes to a figure. This article will go through the method we call different shape functions in matplotlib. To simplify this, let's take an example.
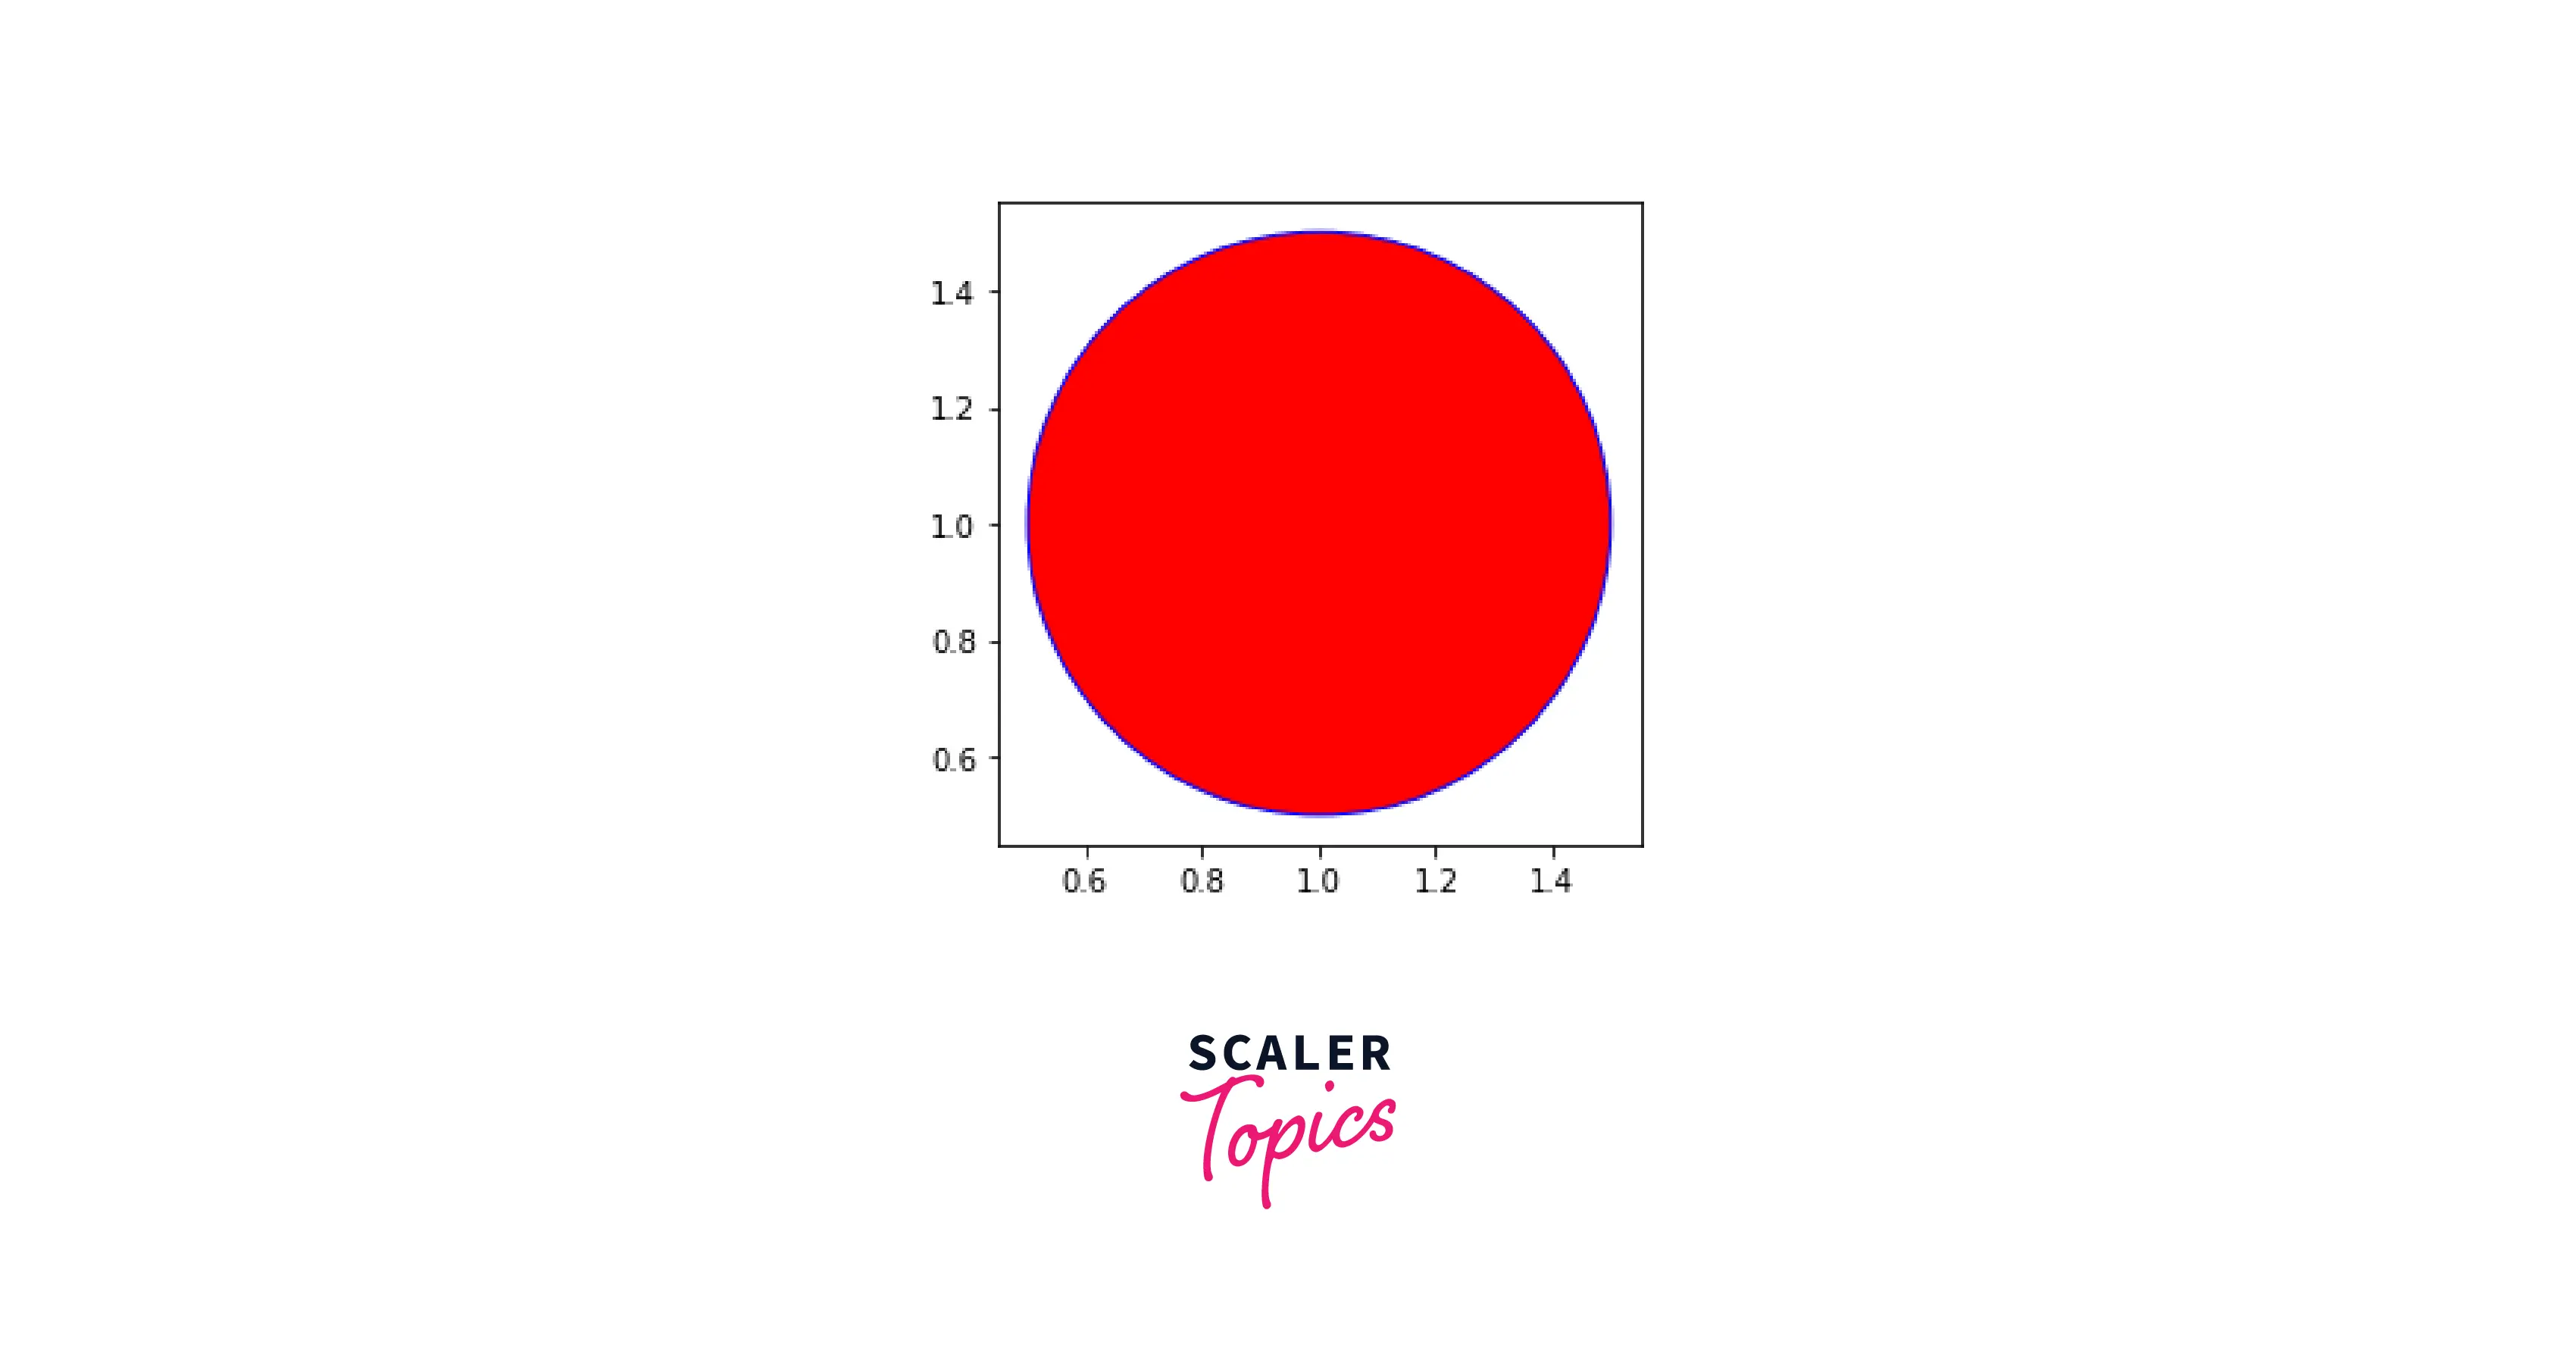
Suppose we make a circle inside a plot in matplotlib. The logic to solve this would be to use the plot. Circle function, and after filling it with the required parameters, voila there's our circle!
- Syntax:
Where: xy: coordinates radius: radius of the circle
Output:
Further in this article, we will see more shapes that can be created using matplotlib.
What are Matplotlib Patches?
Patches in matplotlib is a class that encapsulates many different shapes and informative symbols like arrows, boxes, bulleted lists, etc. Here's what the hierarchy of patches looks like:
 As we can see, a lot of shapes are derived from patches. Later in this article, every shape we draw in a plot will be derived and called from the patches class.
Transform Your Career
Choose from our industry-leading programs designed for career success
Modern Software and AI Engineering Program
Master full-stack development with AI integration

Modern Data Science and ML with specialisation in AI
Advanced data science techniques with AI specialization
Advanced AIML with Specialisation in Agentic AI
Deep dive into AIML with focus on Agentic systems
DevOps, Cloud & AI Platform Engineering
Build and manage AI-powered cloud infrastructure
AI Engineering Advanced Certification by IIT-Roorkee
Premier AI engineering certification from IIT-Roorkee
How to Draw Different Shapes in Matplotlib?
As we saw how to draw a circle earlier, we will now understand how to create a triangle in a plot using matplotlib.
Triangle
- To draw a triangle, we need to use the Polygon function in patches
- In a NumPy array, we need to specify the coordinates of our triangle.
- After that, we must use the add_patch() function to fixate our triangle on the plot.
Output:

Scaler Placement Report and Statistics
Scaler learners achieved 2.5x salary growth with average post-Scaler CTC reaching ₹23L.
Line
- To draw a line, we must use the Line2D function in matplotlib.
- The Line2D function takes in 3 parameters:
- Syntax:
where: ax1: X-coordinate ax2: Y-coordinate lw: Line Width
Output:

Rectangle
- To draw a rectangle, we must use the Rectangle() function in matplotlib.
- The Rectangle() function takes in 3 parameters:
- Syntax:
where: c: starting-coordinates l: length of the rectangle b: breadth of the rectangle
Output:

Turn Learning into Career Growth
Square
- To draw a square, we need to use the Rectangle() and ensure the length and breadth are the same.
- The Square() function takes in 3 parameters:
- Syntax:
Where: c: starting-coordinates l: length of the square b: breadth of the square
Output:

Drawing Shapes with a Mouse on Cartesian Plots
Scaler Placement Report and Statistics
Scaler learners achieved 2.5x salary growth with average post-Scaler CTC reaching ₹23L.
Adding Shapes to Subplots
To add shapes to subplots, we need to create subplots using the add_subplot() function, and then we'd have to call the patch functions to create a shape.
In the example below, we will try to create two subplots and draw a square on one of the subplots.
Output:
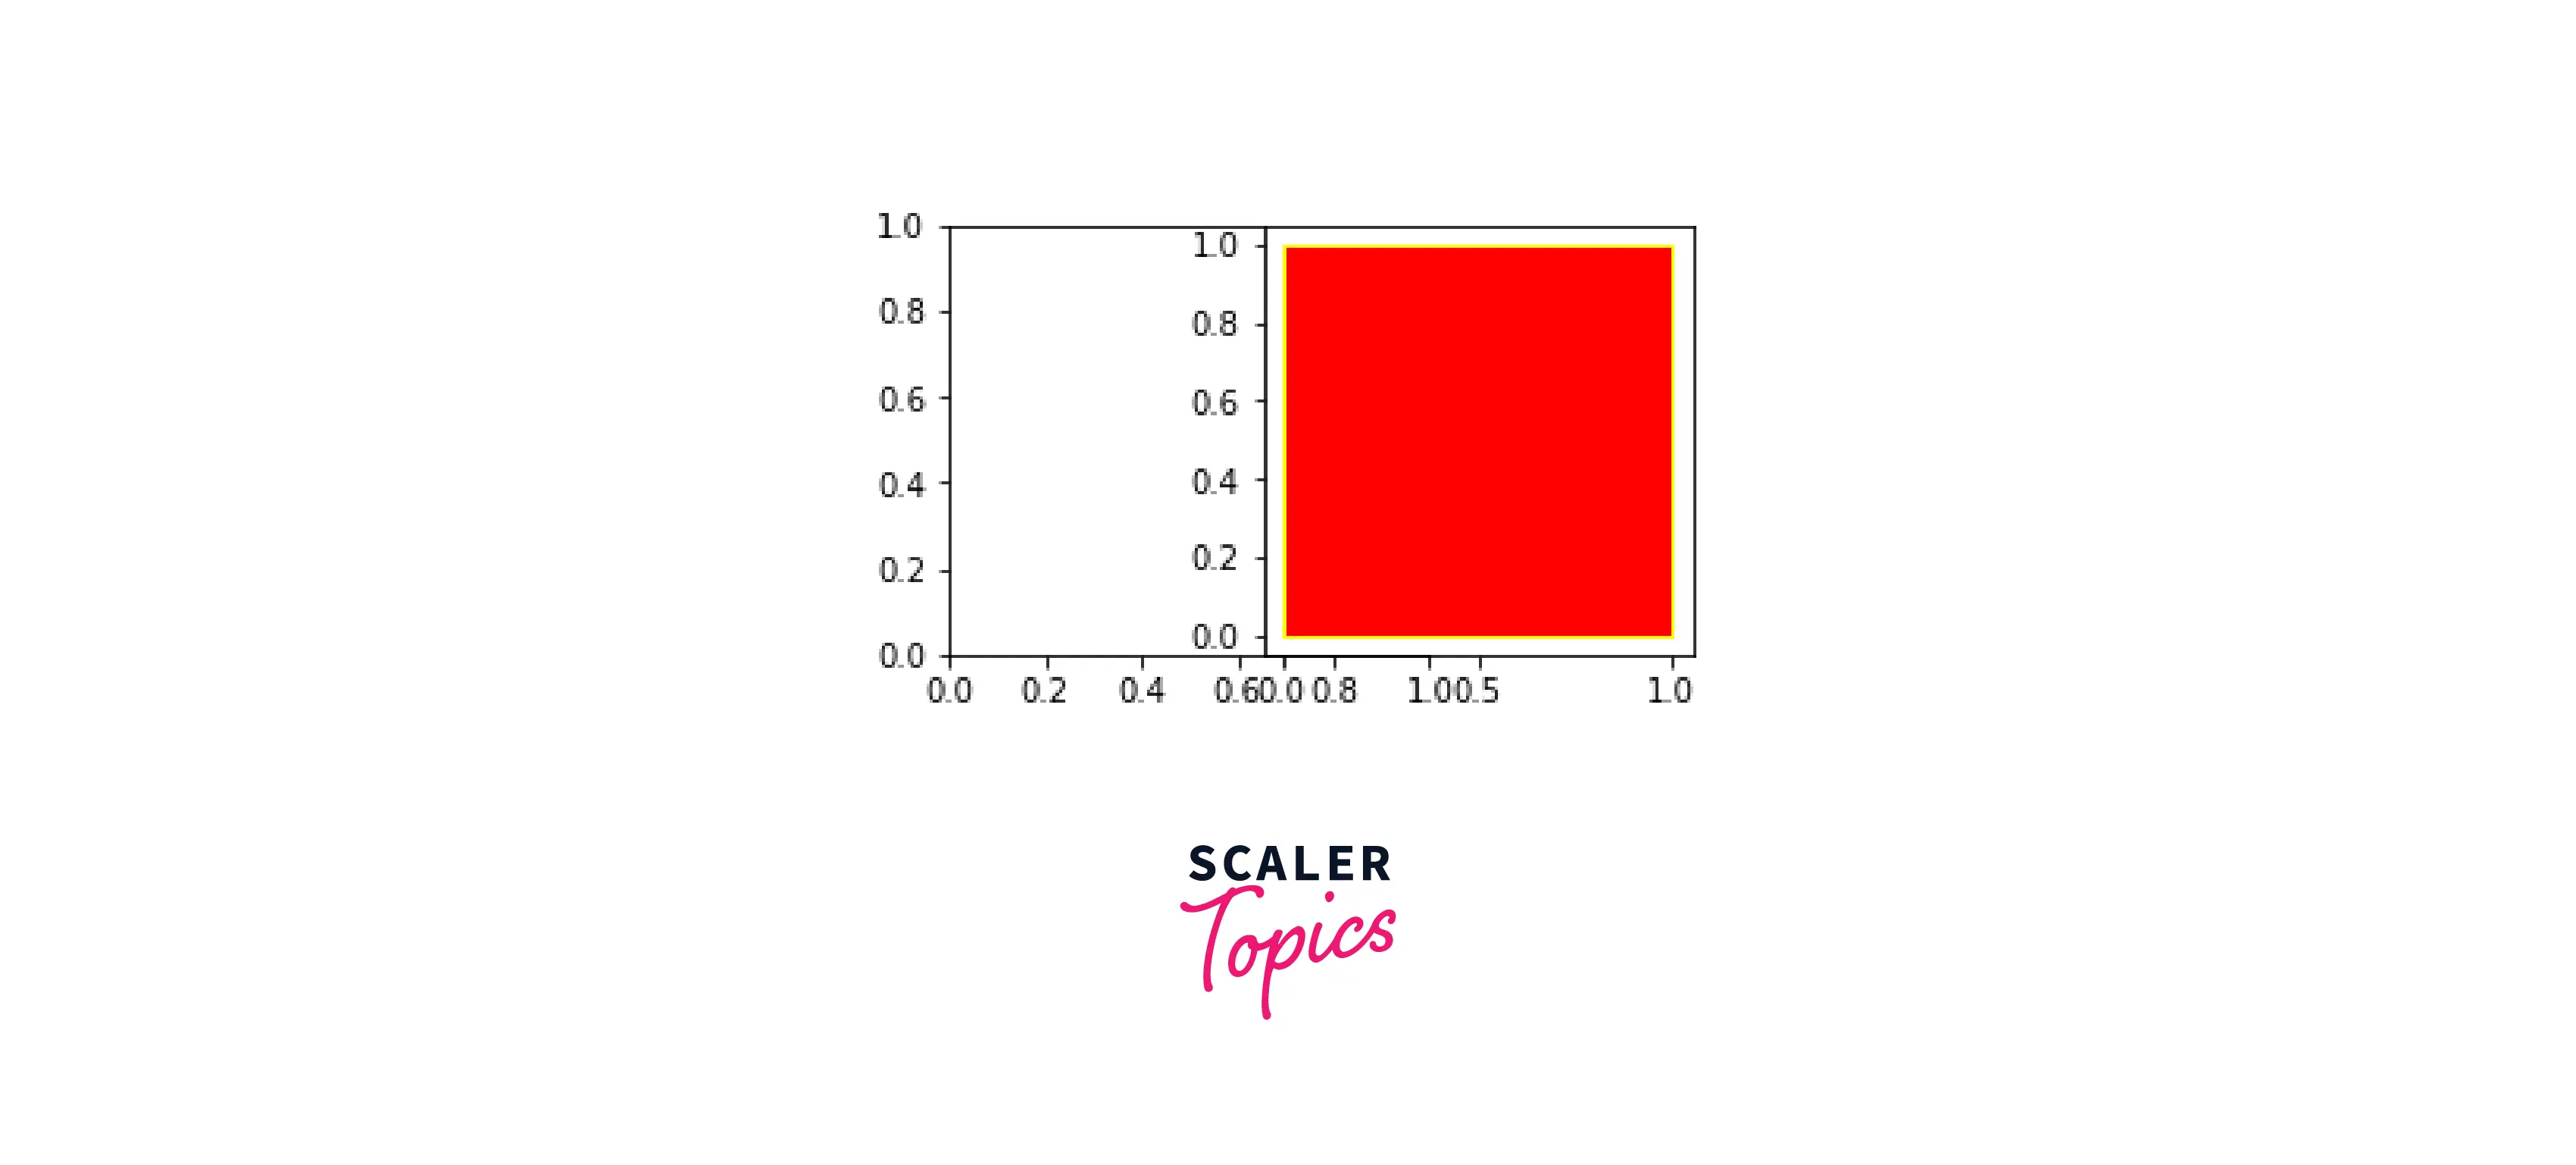
By using this method, we can add shapes to subplots in matplotlib.
Adding the Same Shapes to Multiple Subplots
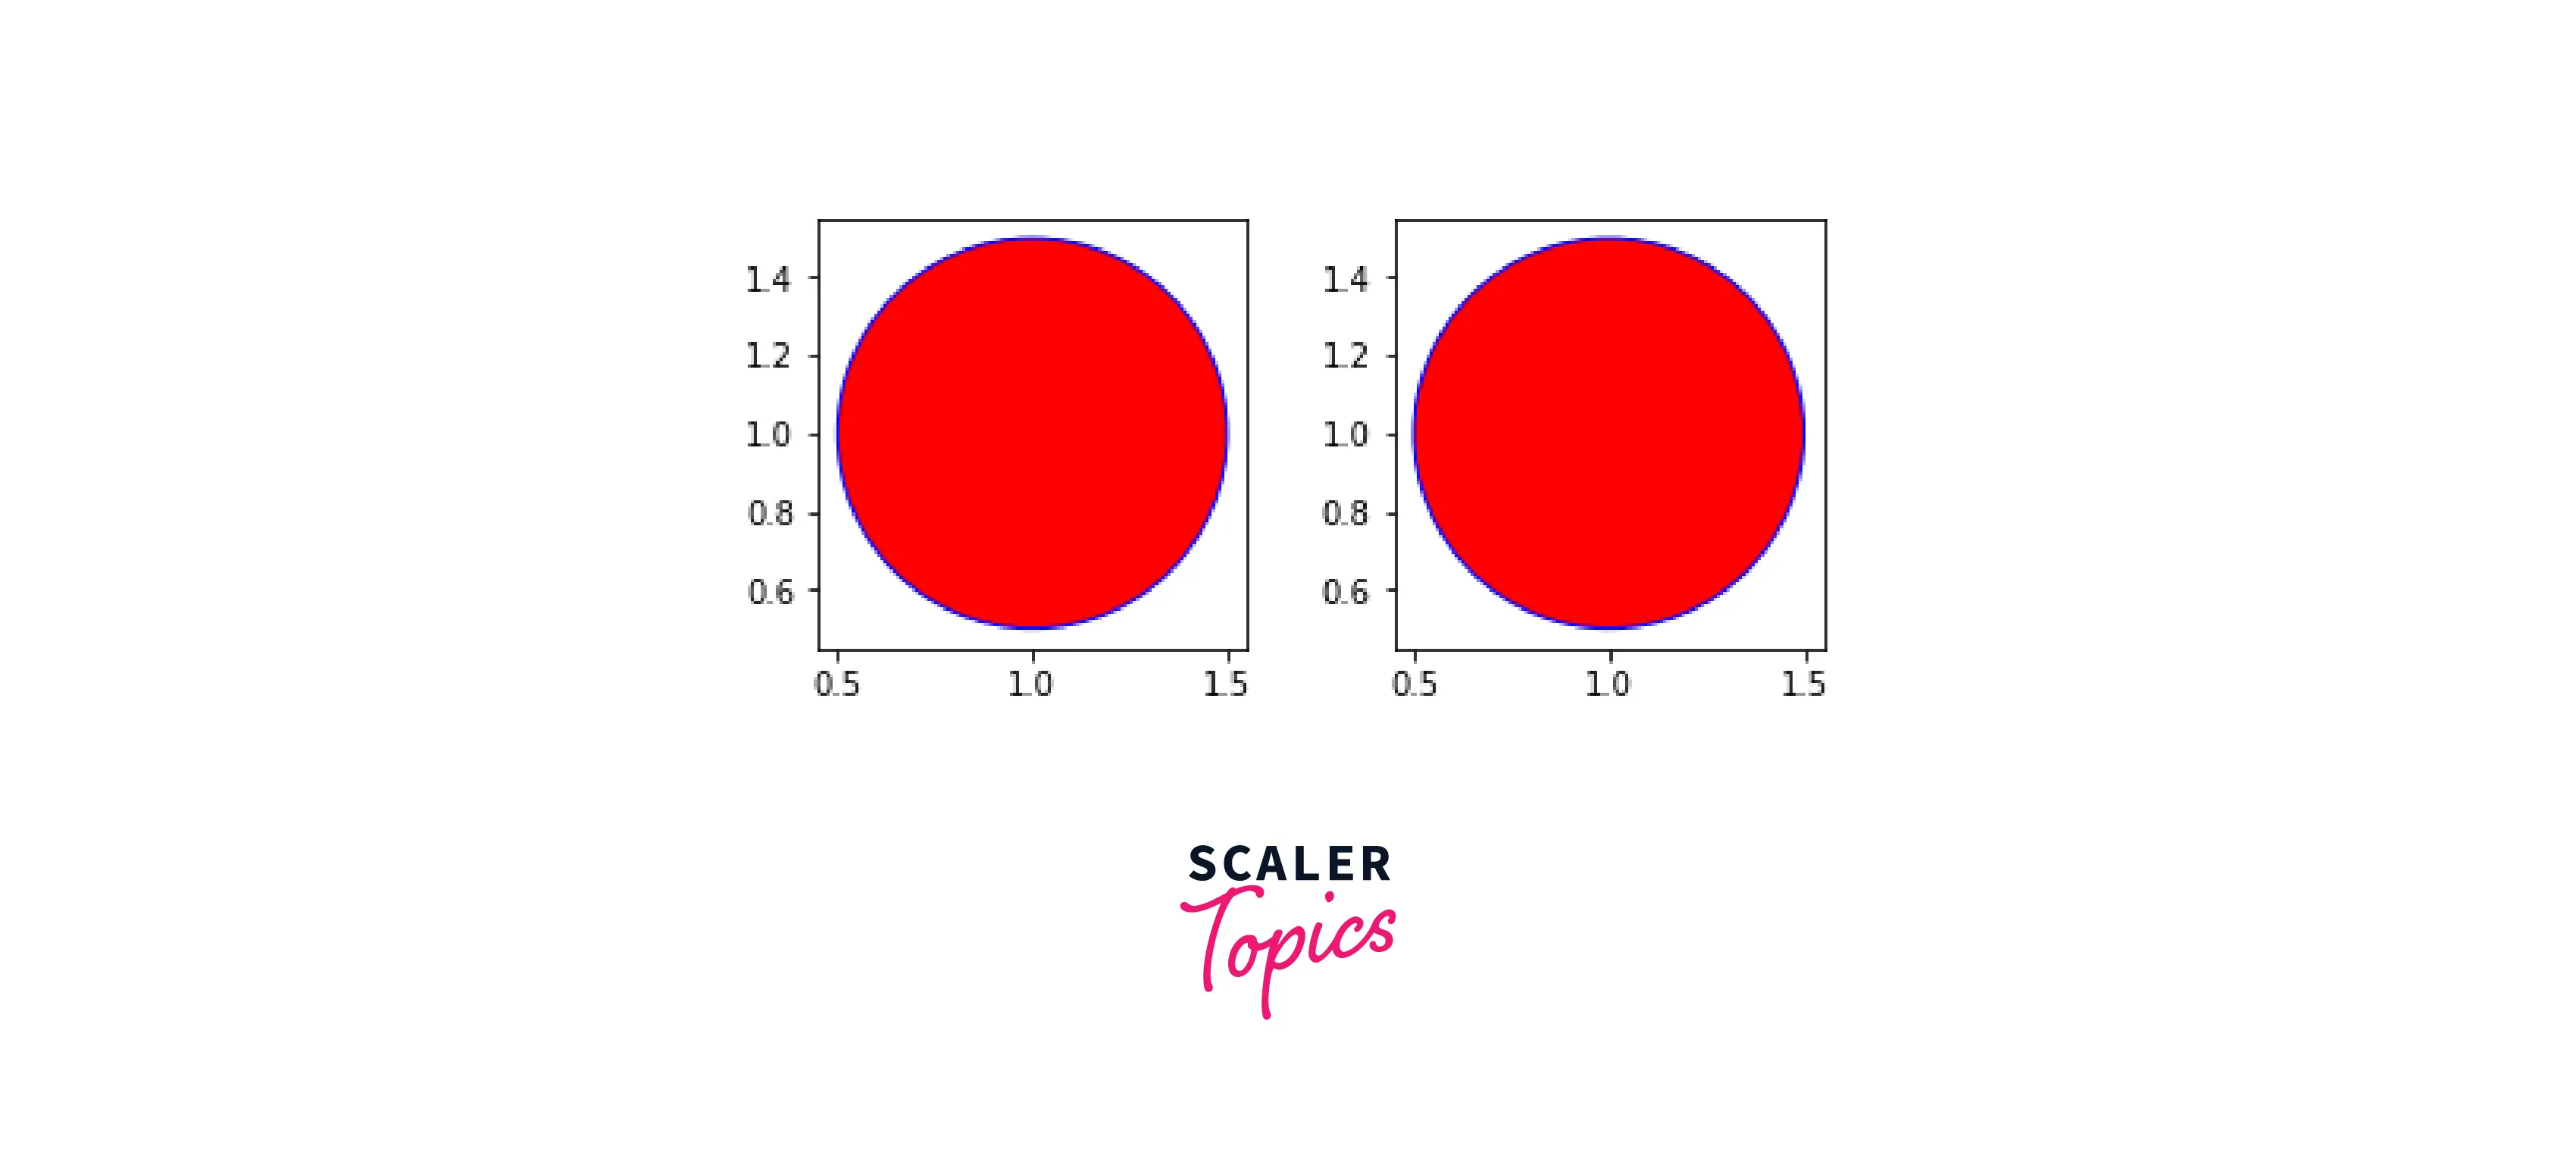
- For better visuals, we will try to add some shapes to multiple subplots in matplotlib. To understand subplots more deeply, refer to this article. (hyperlink subplots article) To achieve this, we will create two subplots and then try to draw a shape on both. For example, we will try to draw a circle on both subplots in this example.
Output:
Add Animations Using matplotlib.animations()
Suppose you are working on a problem where you must represent a pendulum moving in a motion. We can visualize it easily on PowerPoint, but we can do the same in Python too!
Using the animation library in matplotlib, we can quickly animate shapes in our plots. In Python, we have the plot library. Plotly helps us to create publication-quality charts. It creates interactive plots and shapes, enhancing our plot's feel and visibility.
In this example, we will try to create a circle using plotly.
Output:
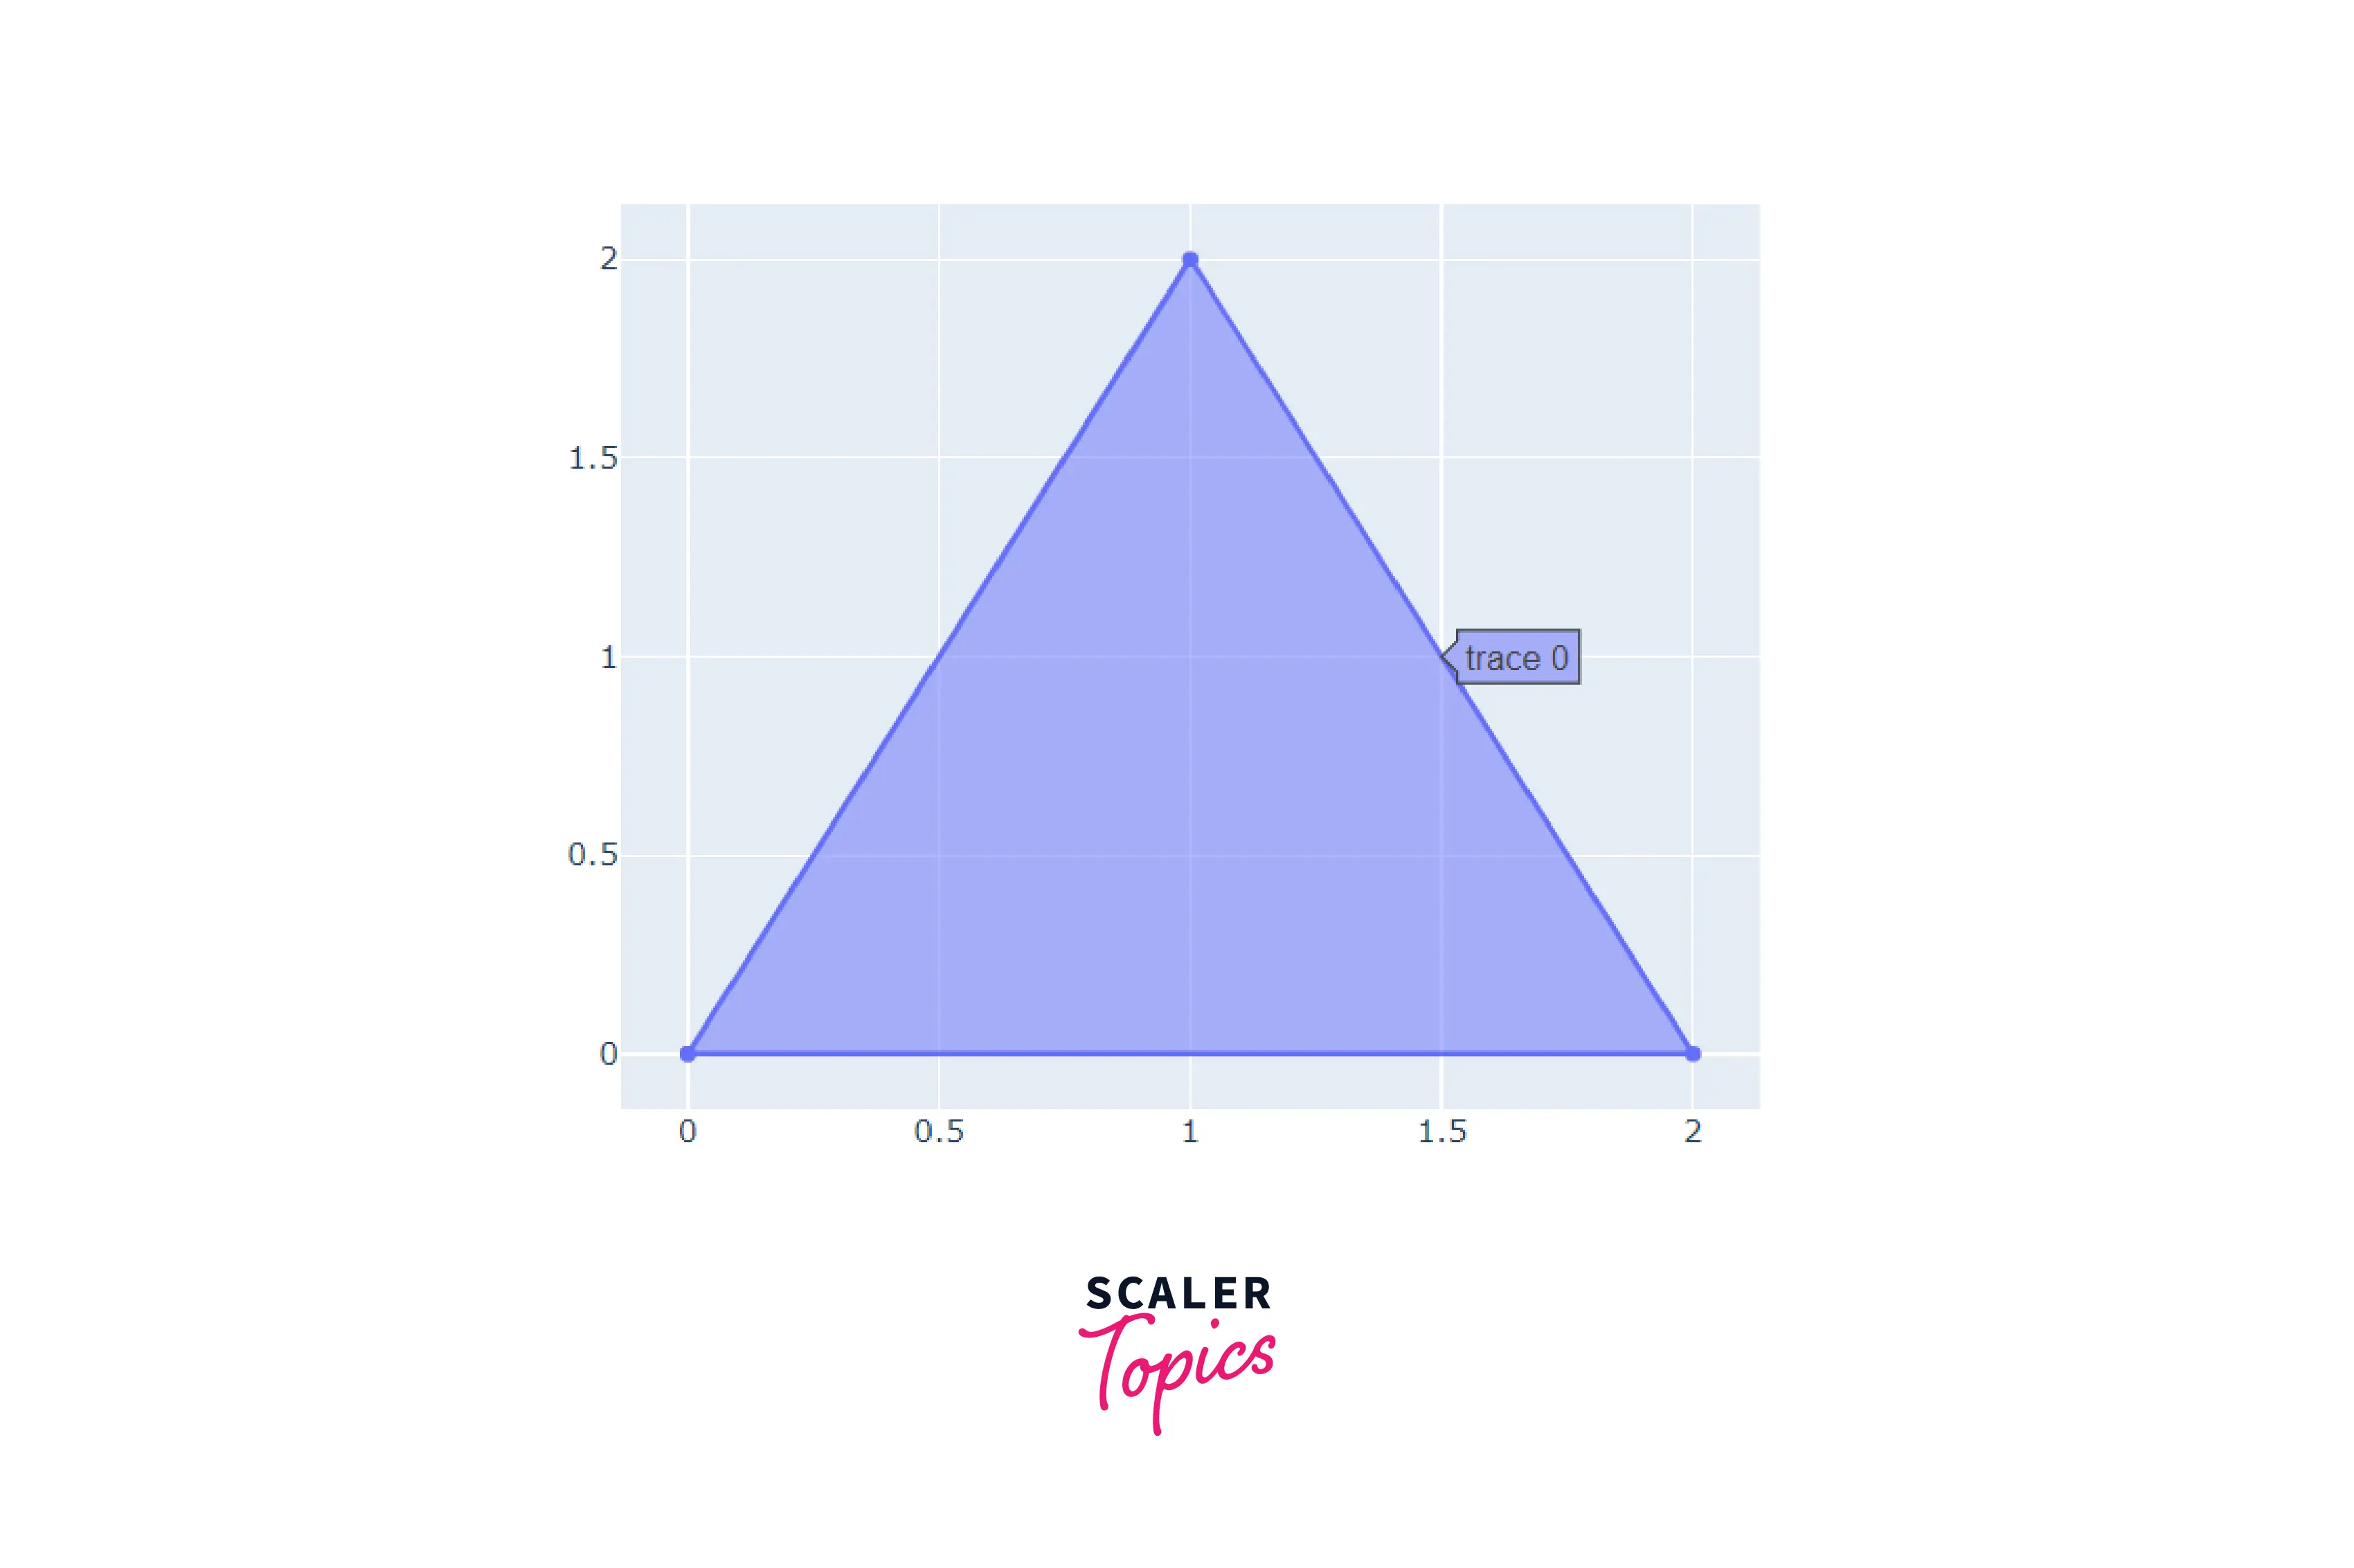
As you can see, by hovering over the figure, we can trace the figure. Apart from this, you can also find coordinates and select a particular area.
Additional Examples
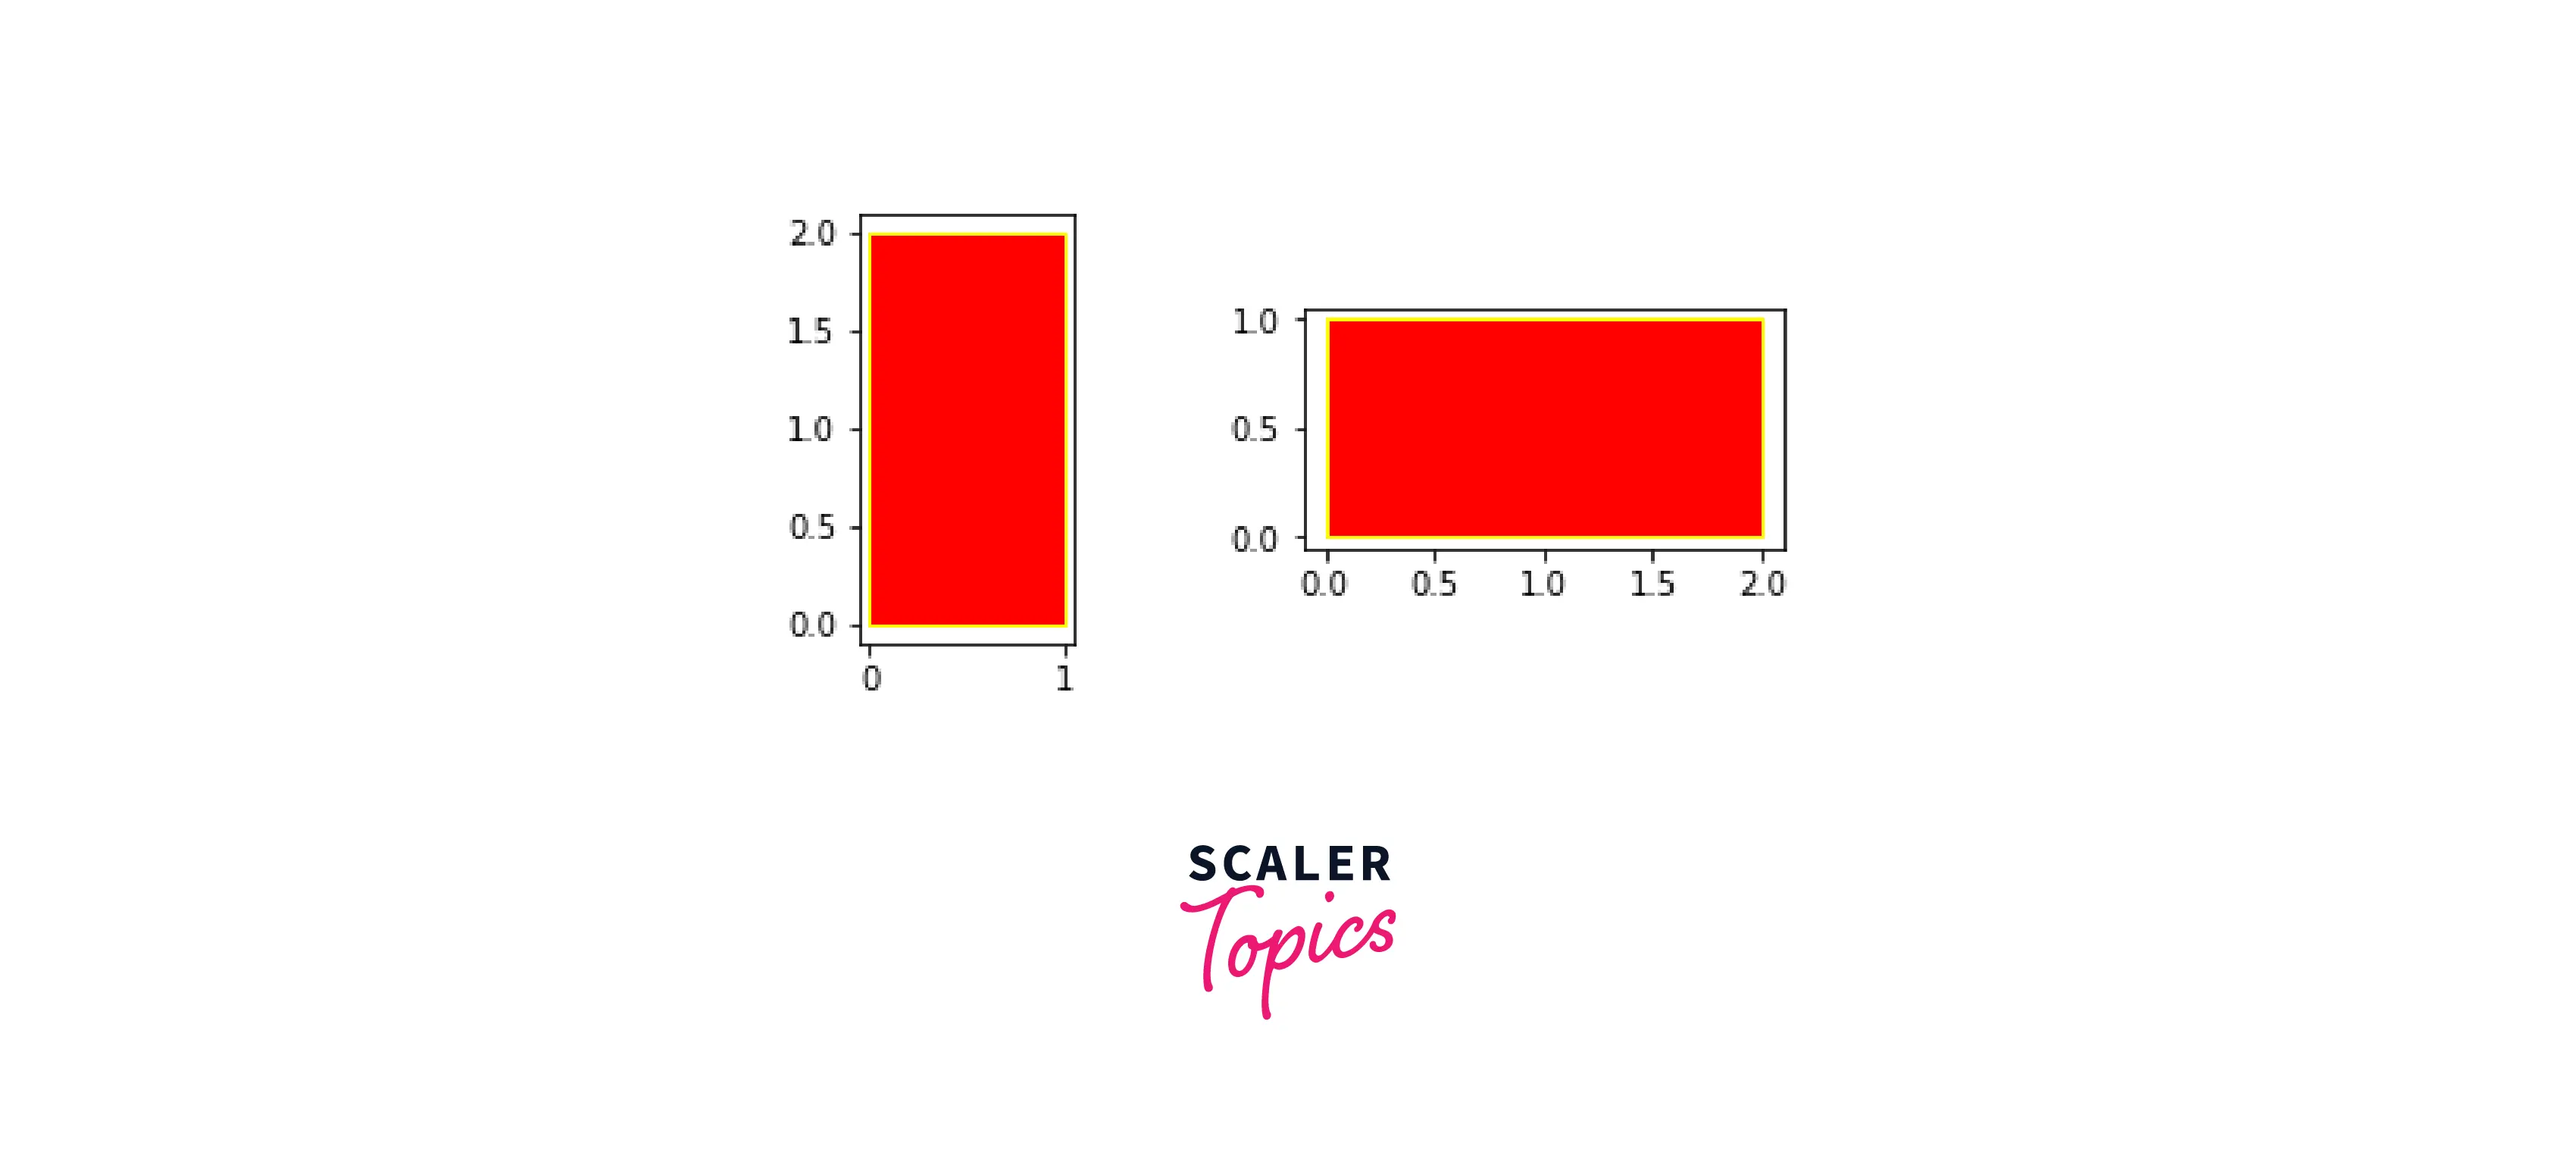
Just as we added circles on two subplots, we will try to mimic that using a rectangle.
Output:
We will now try to create different shapes and animate them using the plotly library.
Output:

Conclusion
- We created various shapes using the in-built matplotlib functions, including plt.Circle() and plt.Rectangle().
- In-depth analysis of patches in matplotlib, how they work and what functions we can inherit from it.
- Walkthrough of adding shapes and designs in subplots in matplotlib.
- Adding similar shapes to different subplots in matplotlib.
- Improving our visualizations by animating shapes and plots using Python's plotly library.