How to Plot Polar Axes in Matplotlib?
Overview
Matplotlib provides the module and functions to plot the coordinates on polar axes. A point in polar coordinates is represented as (r, ). The pair has a distance and angle – for the radius or distance from the origin and for the angle at which r has to be measured from the origin. The pyplot module of matplotlib provides the function polar to draw a polar plot.
Introduction
The polar coordinate system plots angular data on the graph, i.e., periodic functions. A point in the polar coordinate system is represented as (), where r is the distance from the origin and theta is the angle from the axis. matplotlib.pyplot.polar() is used to plotting curve on polar axes.
Scaler Placement Report and Statistics
Scaler learners achieved 2.5x salary growth with average post-Scaler CTC reaching ₹23L.
When to use Polar Coordinates
The two most popular methods for plotting the points on a graph are the rectangular and polar coordinate systems. Polar coordinates are best used when periodic functions are considered. The polar coordinates of points describe their position in terms of distance from the origin and a fixed direction (angle).
Using a rectangular coordinate system when dealing with latitude and longitude would be impractical. Suppose we point out the location of a spherical object. In that case, we use polar coordinates because it will pinpoint the location with more accuracy, distance from the center of the spherical object, and angle from the axes.
Similarly, in a GPS, the concept of polar coordinates is used to find the real-time location of a person. Moreover, many physical systems—such as those concerned with bodies moving around a central point or phenomena originating from a central point—are simpler and more intuitive to model using polar coordinates.
Transform Your Career
Choose from our industry-leading programs designed for career success
Modern Software and AI Engineering Program
Master full-stack development with AI integration

Modern Data Science and ML with specialisation in AI
Advanced data science techniques with AI specialization
Advanced AIML with Specialisation in Agentic AI
Deep dive into AIML with focus on Agentic systems
DevOps, Cloud & AI Platform Engineering
Build and manage AI-powered cloud infrastructure
AI Engineering Advanced Certification by IIT-Roorkee
Premier AI engineering certification from IIT-Roorkee
Angular Data
For plotting the polar coordinates on the polar coordinate system, we need two things, and , where is the distance from the origin to the point, and the is the angle of projection of the point to the x-axis.
Example: Plotting angular data on the polar coordinate system

In the above plot, this is how a polar coordinate system looks: angles are the x-axis and the distance from the origin to the circle's circumference is the y-axis. As we can see, there is a marker on the coordinate system. It is a polar coordinate where r=8 and theta=45°.
How to Plot Polar Axes in Matplotlib
How does it Work?
Before plotting polar coordinates on the graph, we have to change the coordinate system from rectangular to polar, which can be done by using the function matplotlib.pyplot.axes(projection =) where we must pass the value 'polar' in the parameter projection. The matplotlib.pyplot.polar() function pyplot modules are used to plot polar coordinates. This function plots various figures like circles, ellipses, cardioid, and the archimedean spiral. It takes at least two parameters to plot the polar coordinates on the graph, i.e., r and theta.
Turn Learning into Career Growth
Syntax and Parameters
Syntax of the function to plot polar coordinates is
Parameters of the function,
- theta: Angle by which we plot the point.
- r: Distance between the origin and point.
- kwargs: Keyword argument to change the visual properties of the points like a marker, color, size, width, etc.
How to Plot Data on a Polar Coordinate System
Below is the implementation of plotting points on polar axes in matplotlib.
Output:

Code explanation:
- Importing the required modules.
- Creating the new figure and setting up the resolution using the function matplotlib.pyplot.figure(dpi=).
- Adding the subplots to the created figure and set the coordinate system to polar by setting the value of the parameter projection to 'polar'.
- Then, generate the r and theta and store them in the list.
- Plot the point on the polar coordinate system using the function matplotlib.pyplot.polar().
- Then, set the y-axis tick range using the .add_subplot().set_ylim function.
- Displaying the plot using the matplotlib.pyplot.show() function.
Common Examples
Polar Projections
Polar projections are some plots that can be plotted on a polar coordinate system example, a circle, an ellipse, or an archimedean spiral.
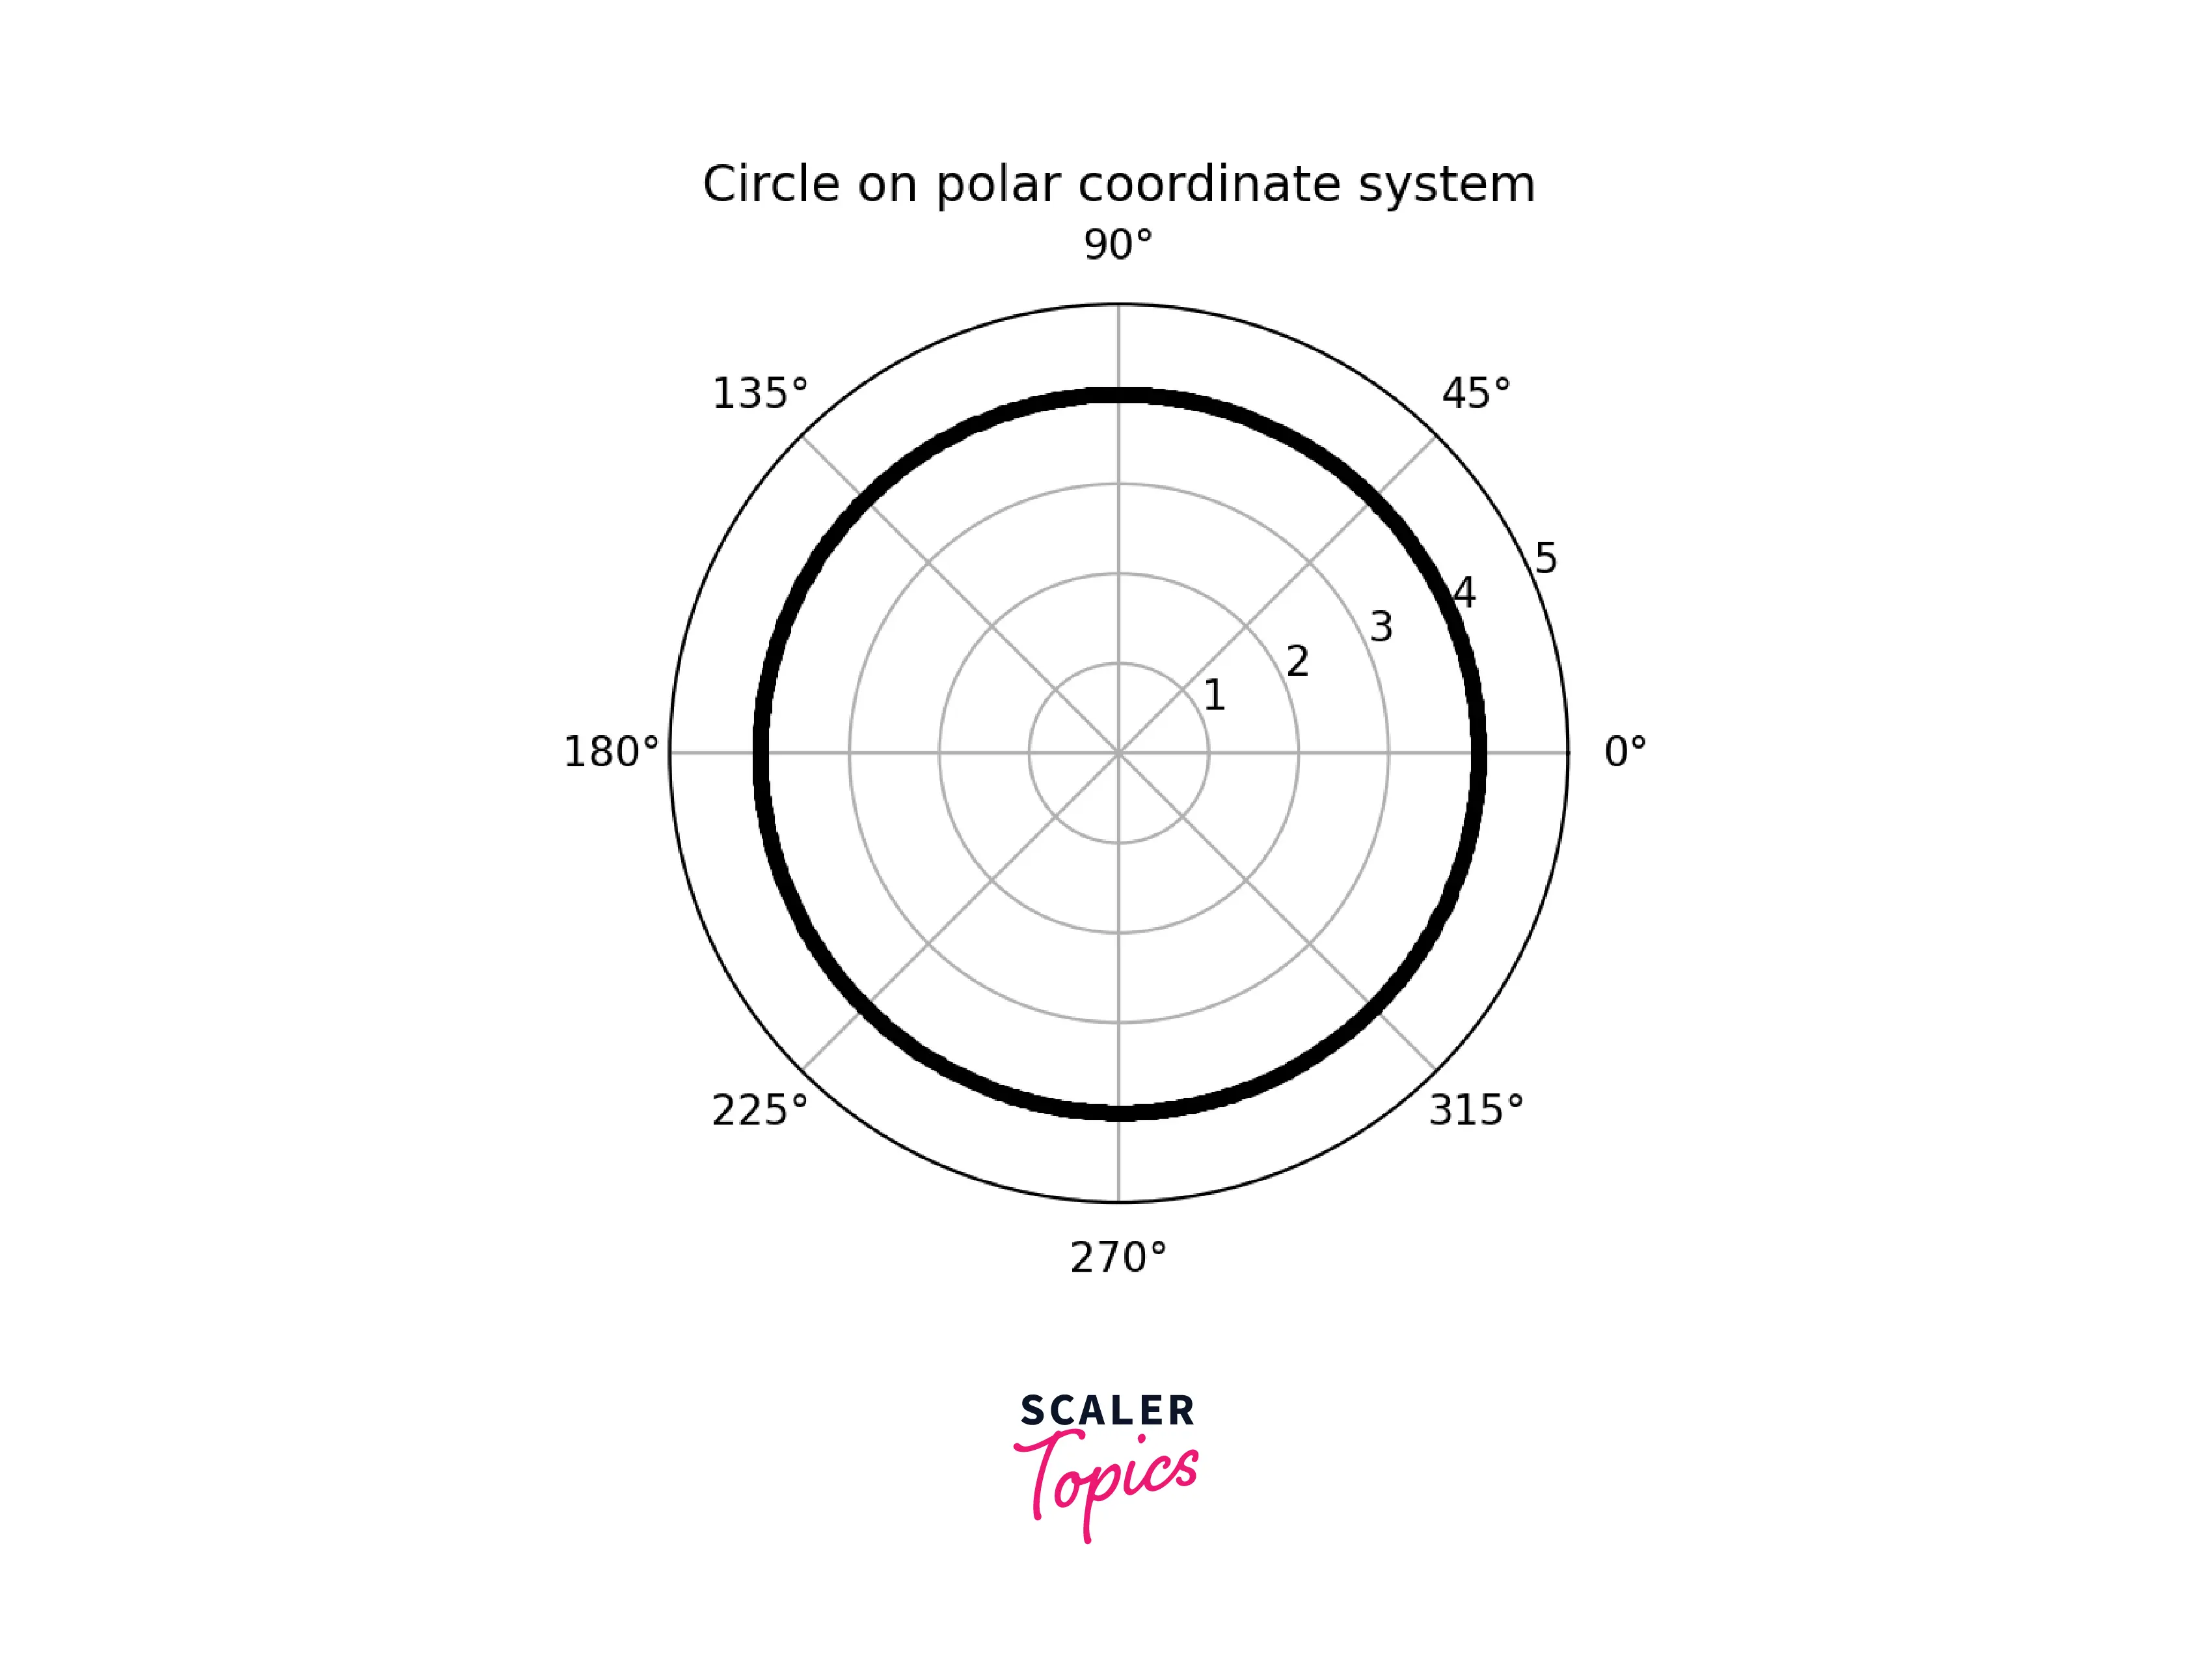
Example 1: Drawing a circle on a polar coordinate system
For Drawing a circle on the polar coordinate system, we need a radius and a list of angles from 0 to 2π in a very short interval.
Output:
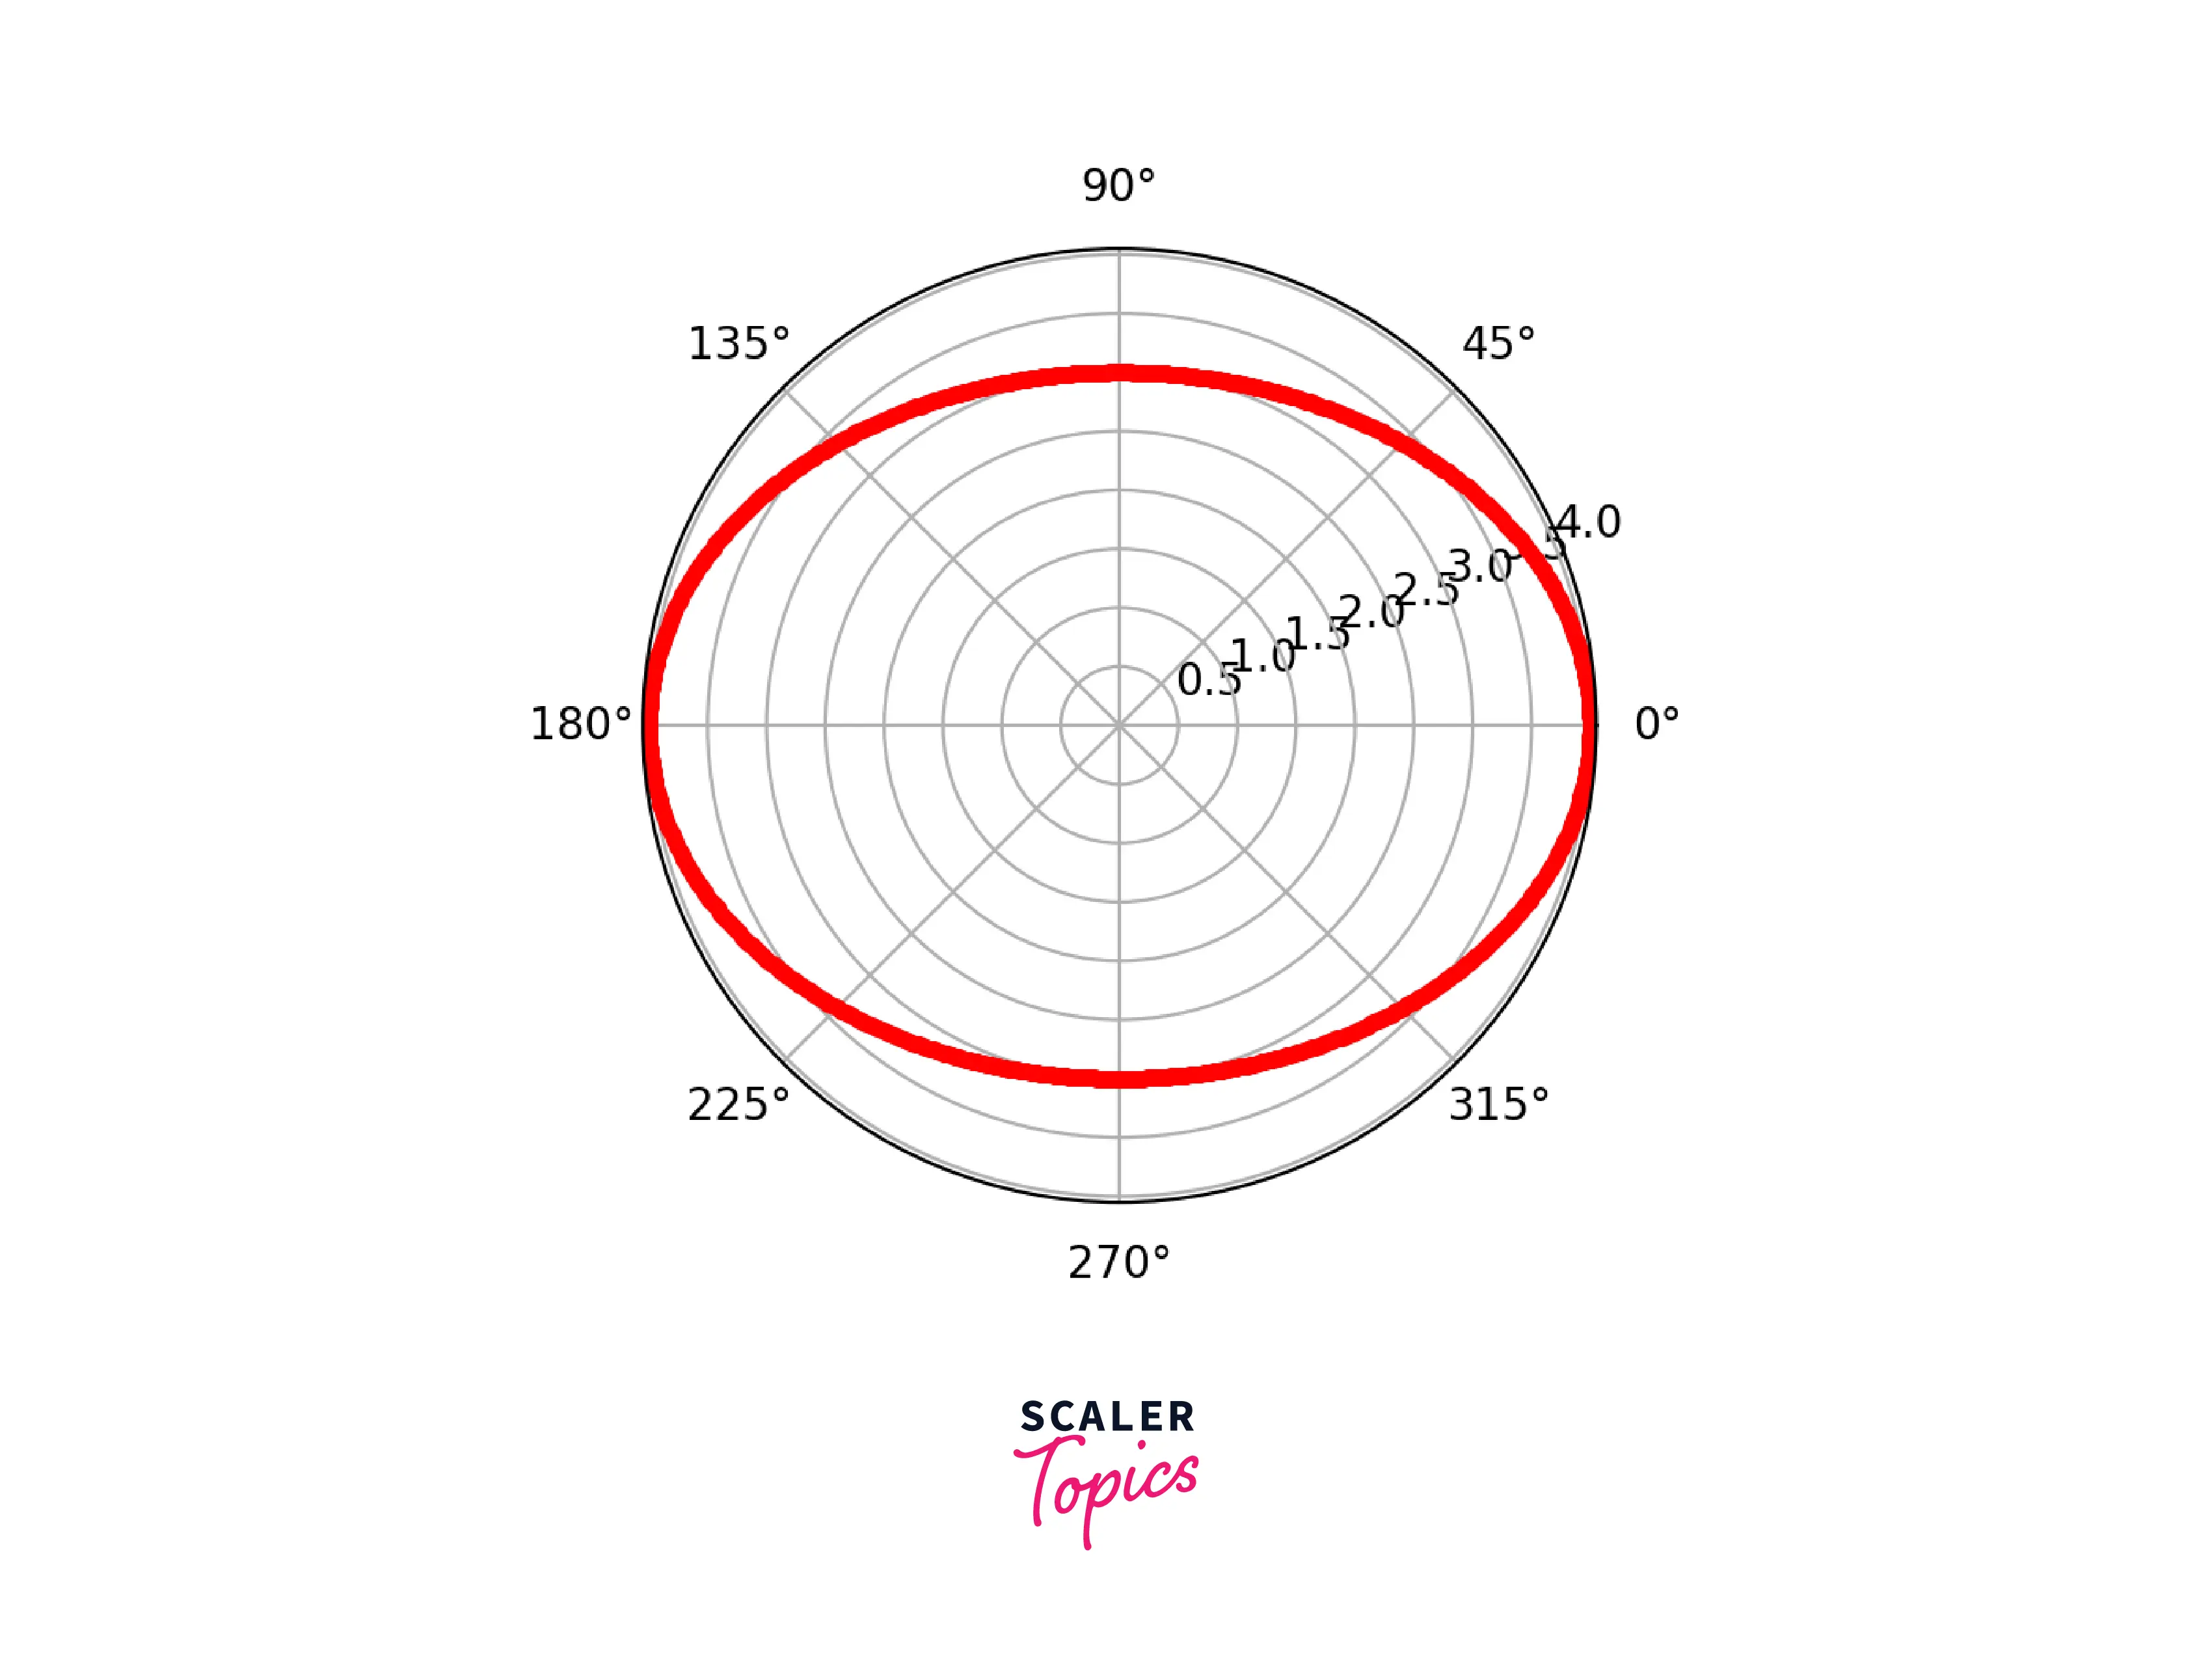
Example 2: Drawing an ellipse on polar coordinates
An ellipse is a locus of a point moving in a plane such that the sum of its distances from two other points (the foci) is constant. Here, r is defined as:
Where,
a = length of the semi-major axis b = length of the semi-minor axis
Output:
Polygons
Example: Implementation of the polygon in matplotlib
Output:

Conclusion
- A point in polar coordinates is represented as ().
- r is the distance from the origin, and theta () is the angle from the axis.
- First, we must set the coordinate system from rectangular to polar.
- In matplotlib, we can plot points on polar axes by using the function matplotlib.pyplot.Polar.