Introduction | Save a Plot in Matplotlib?
Overview
Matplotlib is a powerful library for plotting data. It provides modules and functions to save plots as images to the local memory. This article will discuss how we can save plots in matplotlib. After plotting a graph in matplotlib, we can either display it or save it (or both if desired) by using the savefig() and imsave() functions. We will also discuss the syntax and parameters of the function by which we can change the visual appearance and format of other properties of the saved plot.
Basics of Saving a Plot in Matplotlib
Transform Your Career
Choose from our industry-leading programs designed for career success
Modern Software and AI Engineering Program
Master full-stack development with AI integration

Modern Data Science and ML with specialisation in AI
Advanced data science techniques with AI specialization
Advanced AIML with Specialisation in Agentic AI
Deep dive into AIML with focus on Agentic systems
DevOps, Cloud & AI Platform Engineering
Build and manage AI-powered cloud infrastructure
AI Engineering Advanced Certification by IIT-Roorkee
Premier AI engineering certification from IIT-Roorkee
Introduction
There are two ways to save plots as images in matplotlib, first by using savefig() and second by using the imsave() function. The savefig() function takes at least one parameter (filename) to save an image. The imsave() function takes at least two parameters file name and NumPy array of the coordinates of the rendered file. We can also change the visual appearance of the images before saving by passing some parameters like face color, edge color, and transparency. These functions save images to your local memory in formats like png, pdf, svg, etc.
Syntax
Method 1: savefig() Function
Method 2: imsave() Function
Parameters
Method 1: savefig() Function
| Parameter | Description |
|---|---|
| fname: | It takes a file name as a string or absolute path to save an image at a specific location. |
| dpi: | It stands for dots per inch. The higher the dpi higher the resolution of the image. It takes float. |
| metadata: | Specifies key/value pair to store in the image metadata. Take data in the dict datatype. |
| bbox_inches: | Bounding the box in inches only saves the given portion of the image. |
| pad_inches: | Amount of padding around the figure when bbox_inches is 'tight'. |
| face color: | Change the face color of the image. |
| edgecolor: | Change the edge color of the image. |
| paper type: | Specifies the type of paper, such as A1 to A10, etc. |
| format: | It specifies the file's extension such as png, pdf, svg, etc. |
| transparent: | To make the image's background transparent. |
| orientation: | Change the orientation of the image as landscape or portrait. |
Method 2: imsave() Function
| Parameters | Description |
|---|---|
| fname: | It takes a file name as a string or absolute path to save an image at a specific location. |
| cmap: | We can also specify the color map like magma, plasma, viridus, etc. |
| dpi: | It stands for dots per inch. The higher the dpi higher the resolution of the image. It takes float. |
| vmin, vmax: | vmin and vmax set the color scale for the image by fixing the values that map to the colormap (inferno, viridus, magma, etc.) color limits. If either vmin or vmax is None, that limit is determined from the arr min/max value. |
| format: | It specifies the file's extension such as png, pdf, svg, etc. |
| arr: | The image data. The shape can be one of MxN (luminance), MxNx3 (RGB), or MxNx4 (RGBA). |
Turn Learning into Career Growth
How to Save a Plot in Matplotlib
To save a plot, we have to define a plot by plotting data on the graph before the matplotlib.pyplot.show(); we have to use the savefig() or imsave() function to save the plot as an image.
Using savefig() Function
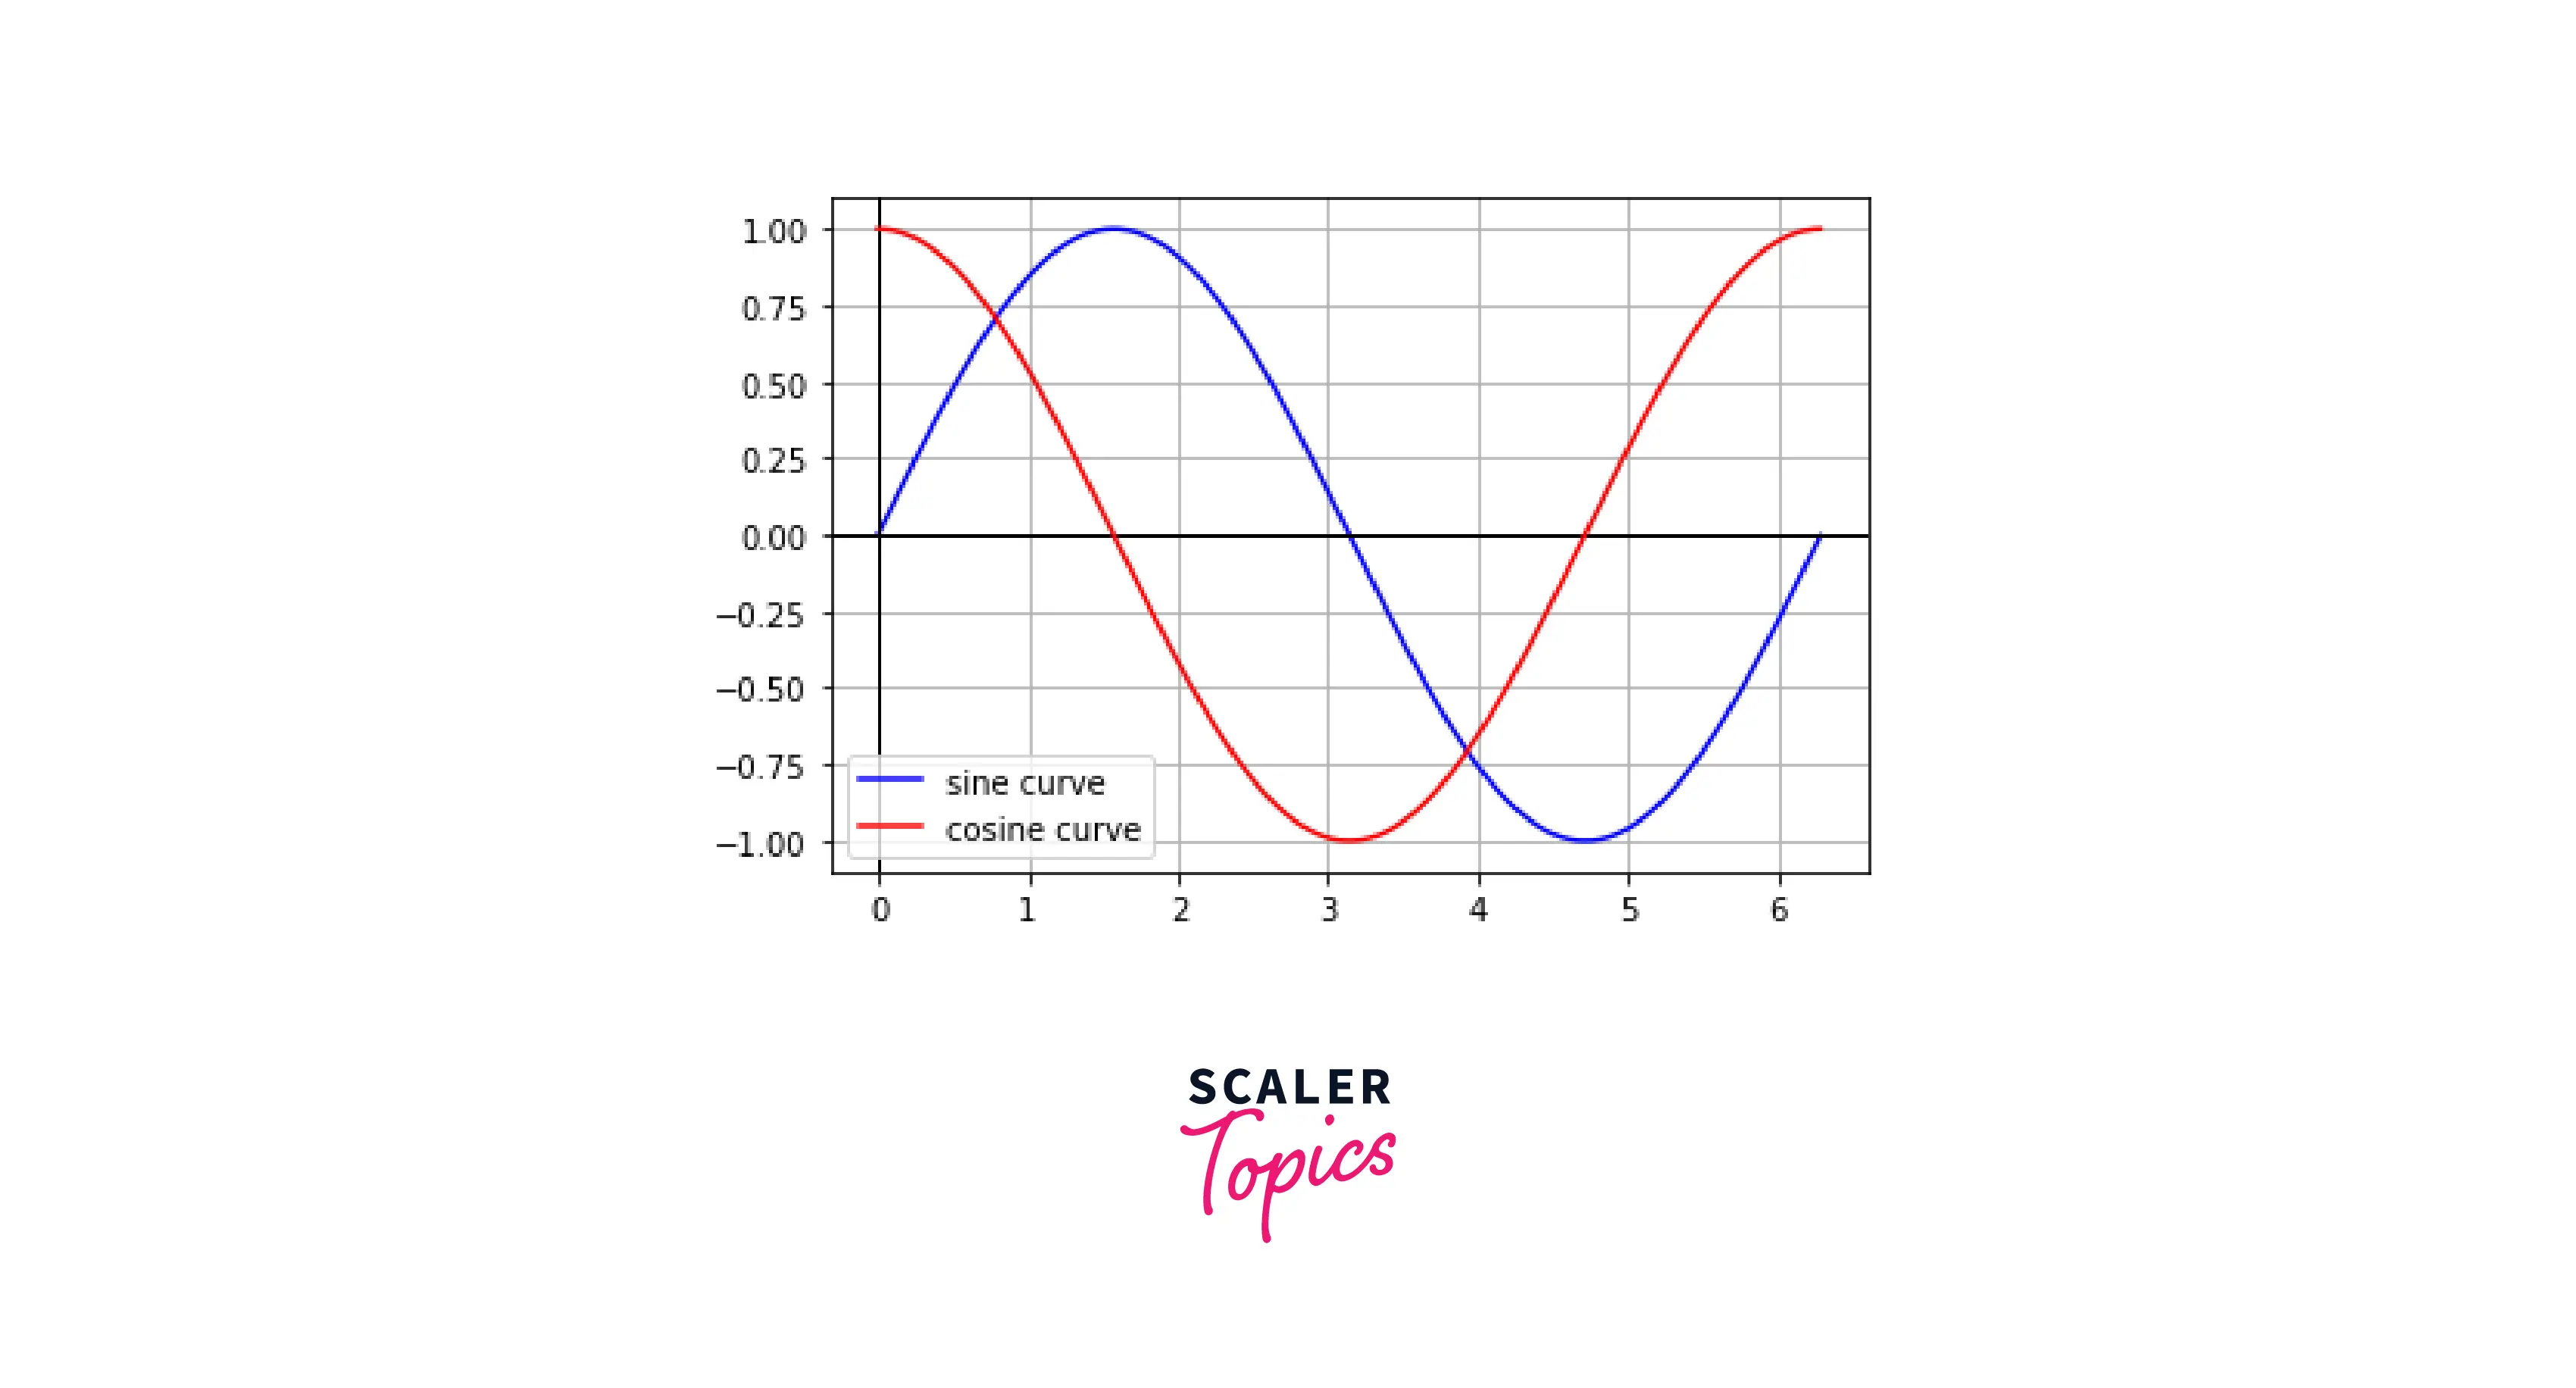
First, we plot some data on the graph.
Output:

Code explanation:
- Importing the required modules.
- Storing the x-axis data points in the list x.
- Storing the y-axis data points in the list y.
- Then, plotting the coordinates using the function matplotlib.pyplot.plot().
- Then enabling the grid on the graph using matplotlib.pyplot.grid() function.
- Saving the images using the function matplotlib.pyplot.savefig() by passing the file name along with the extension.
- Displaying the plot by using matplotlib.pyplot.show() function.
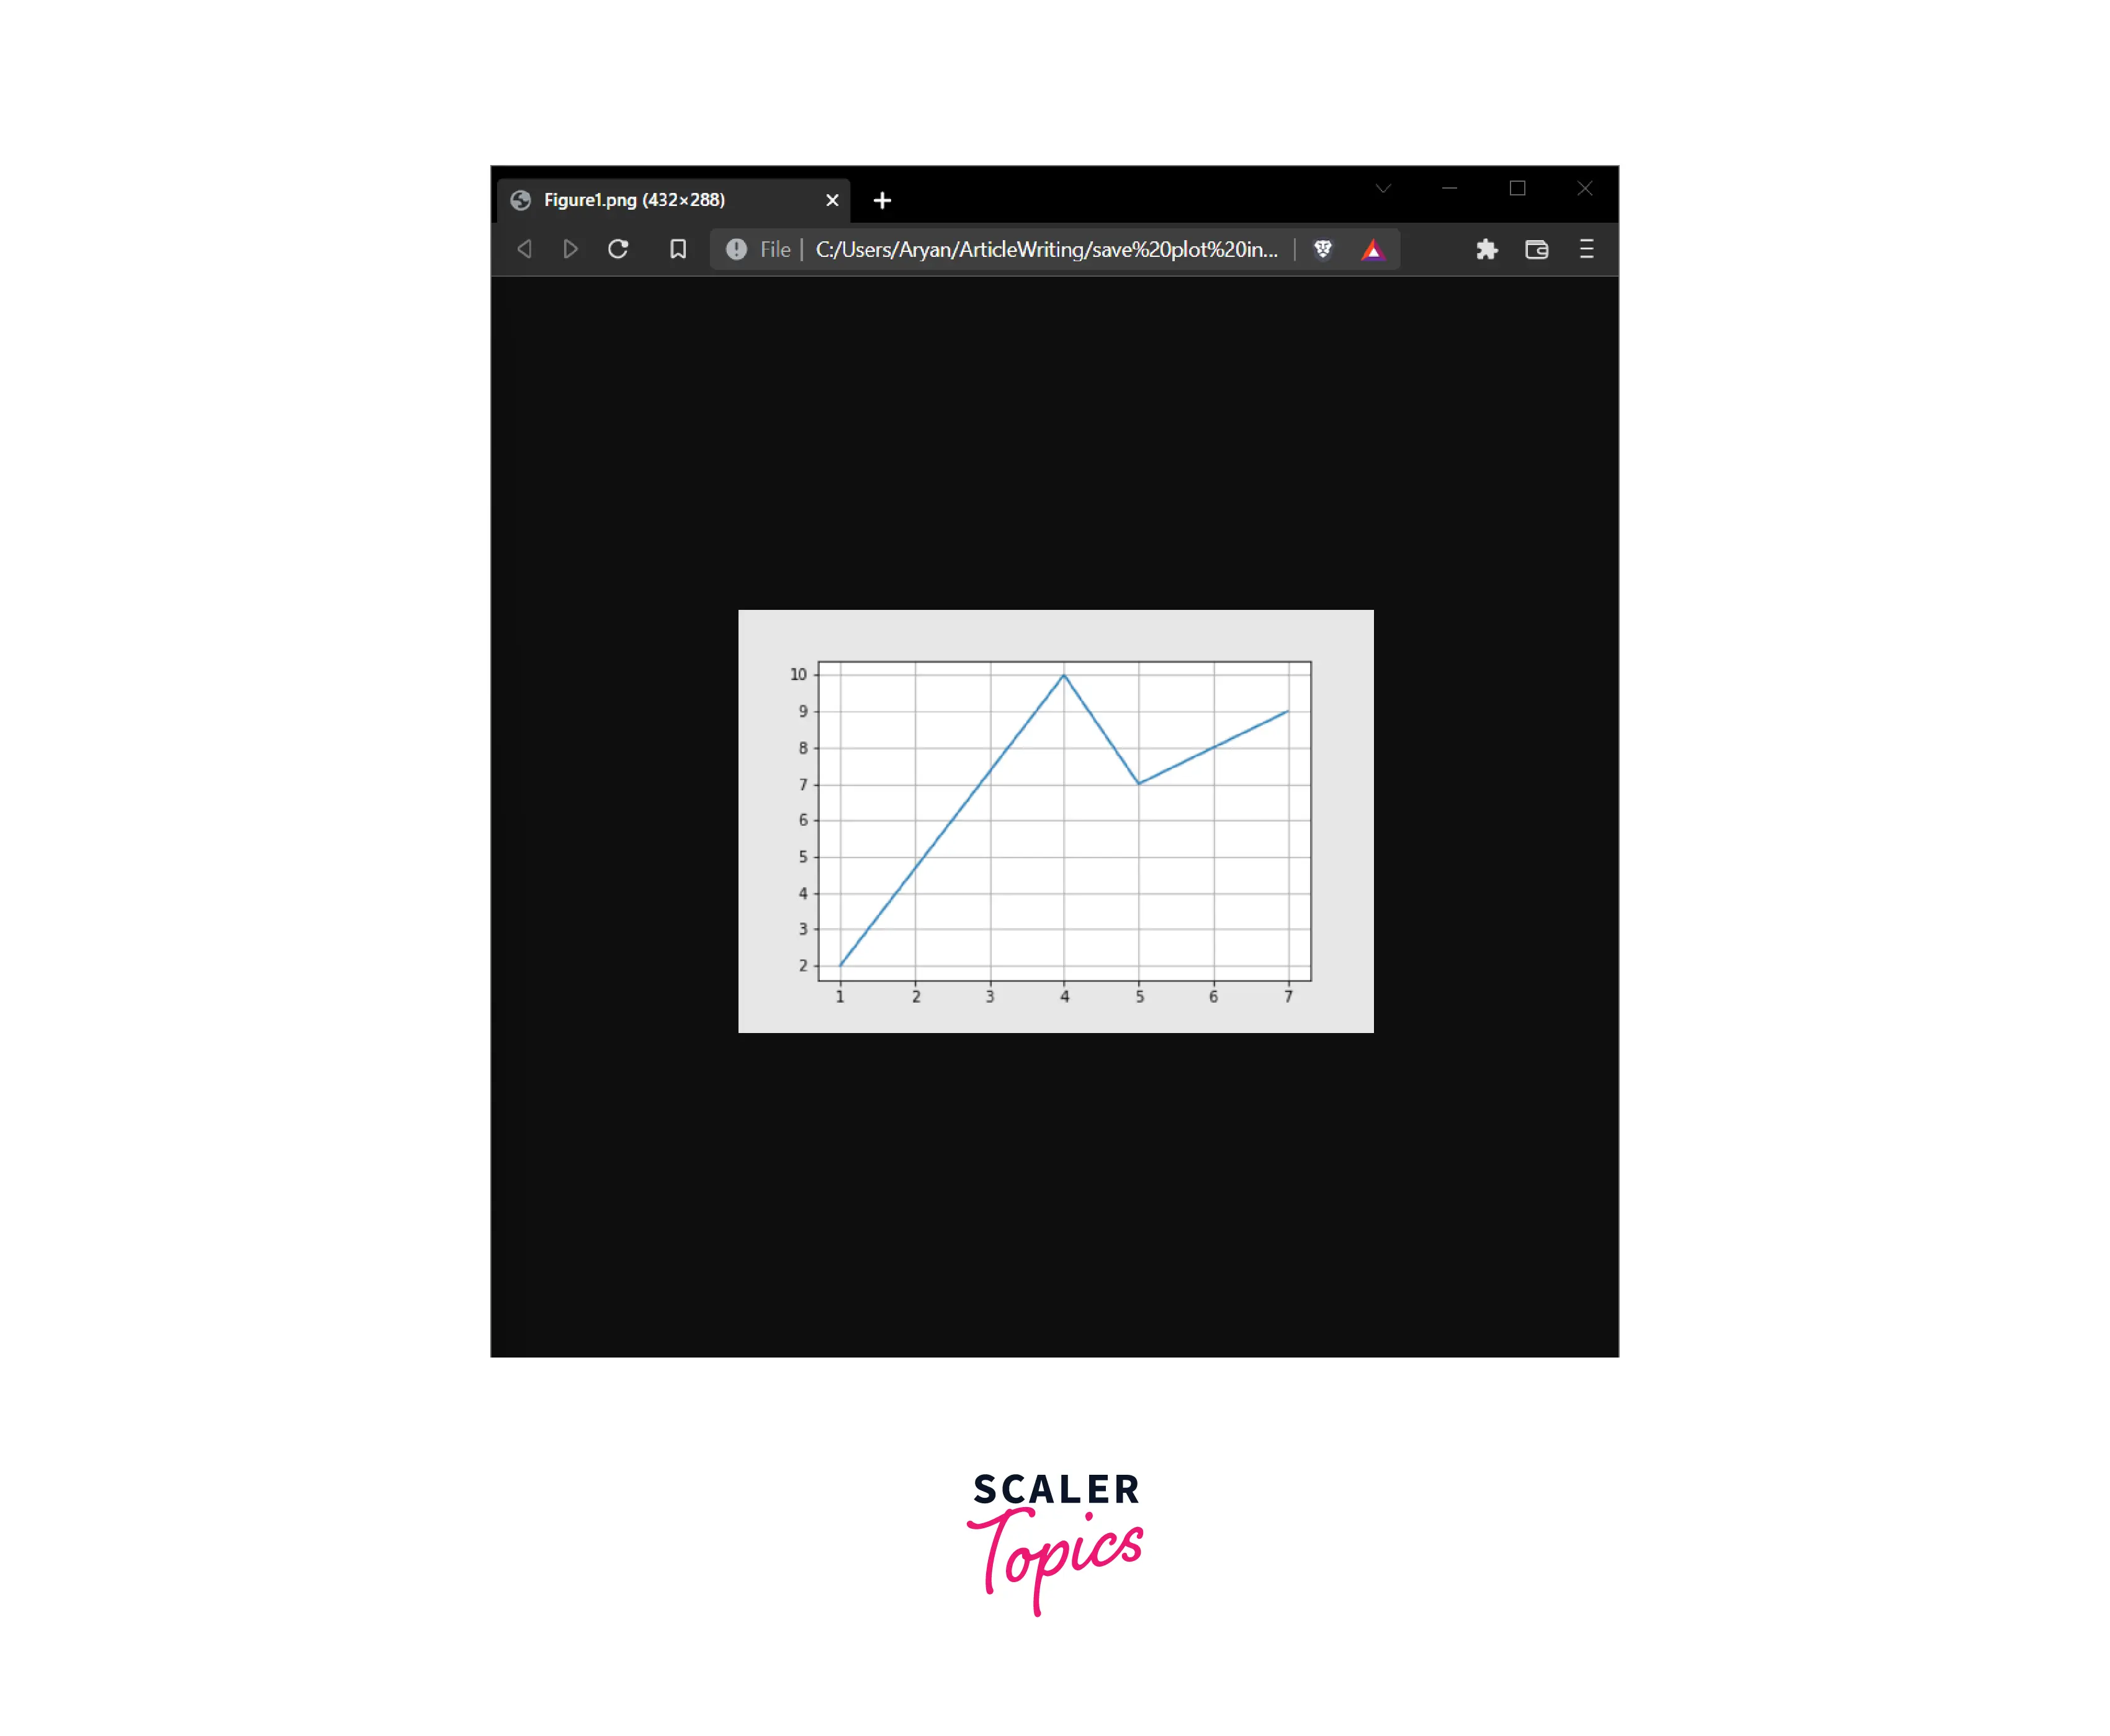
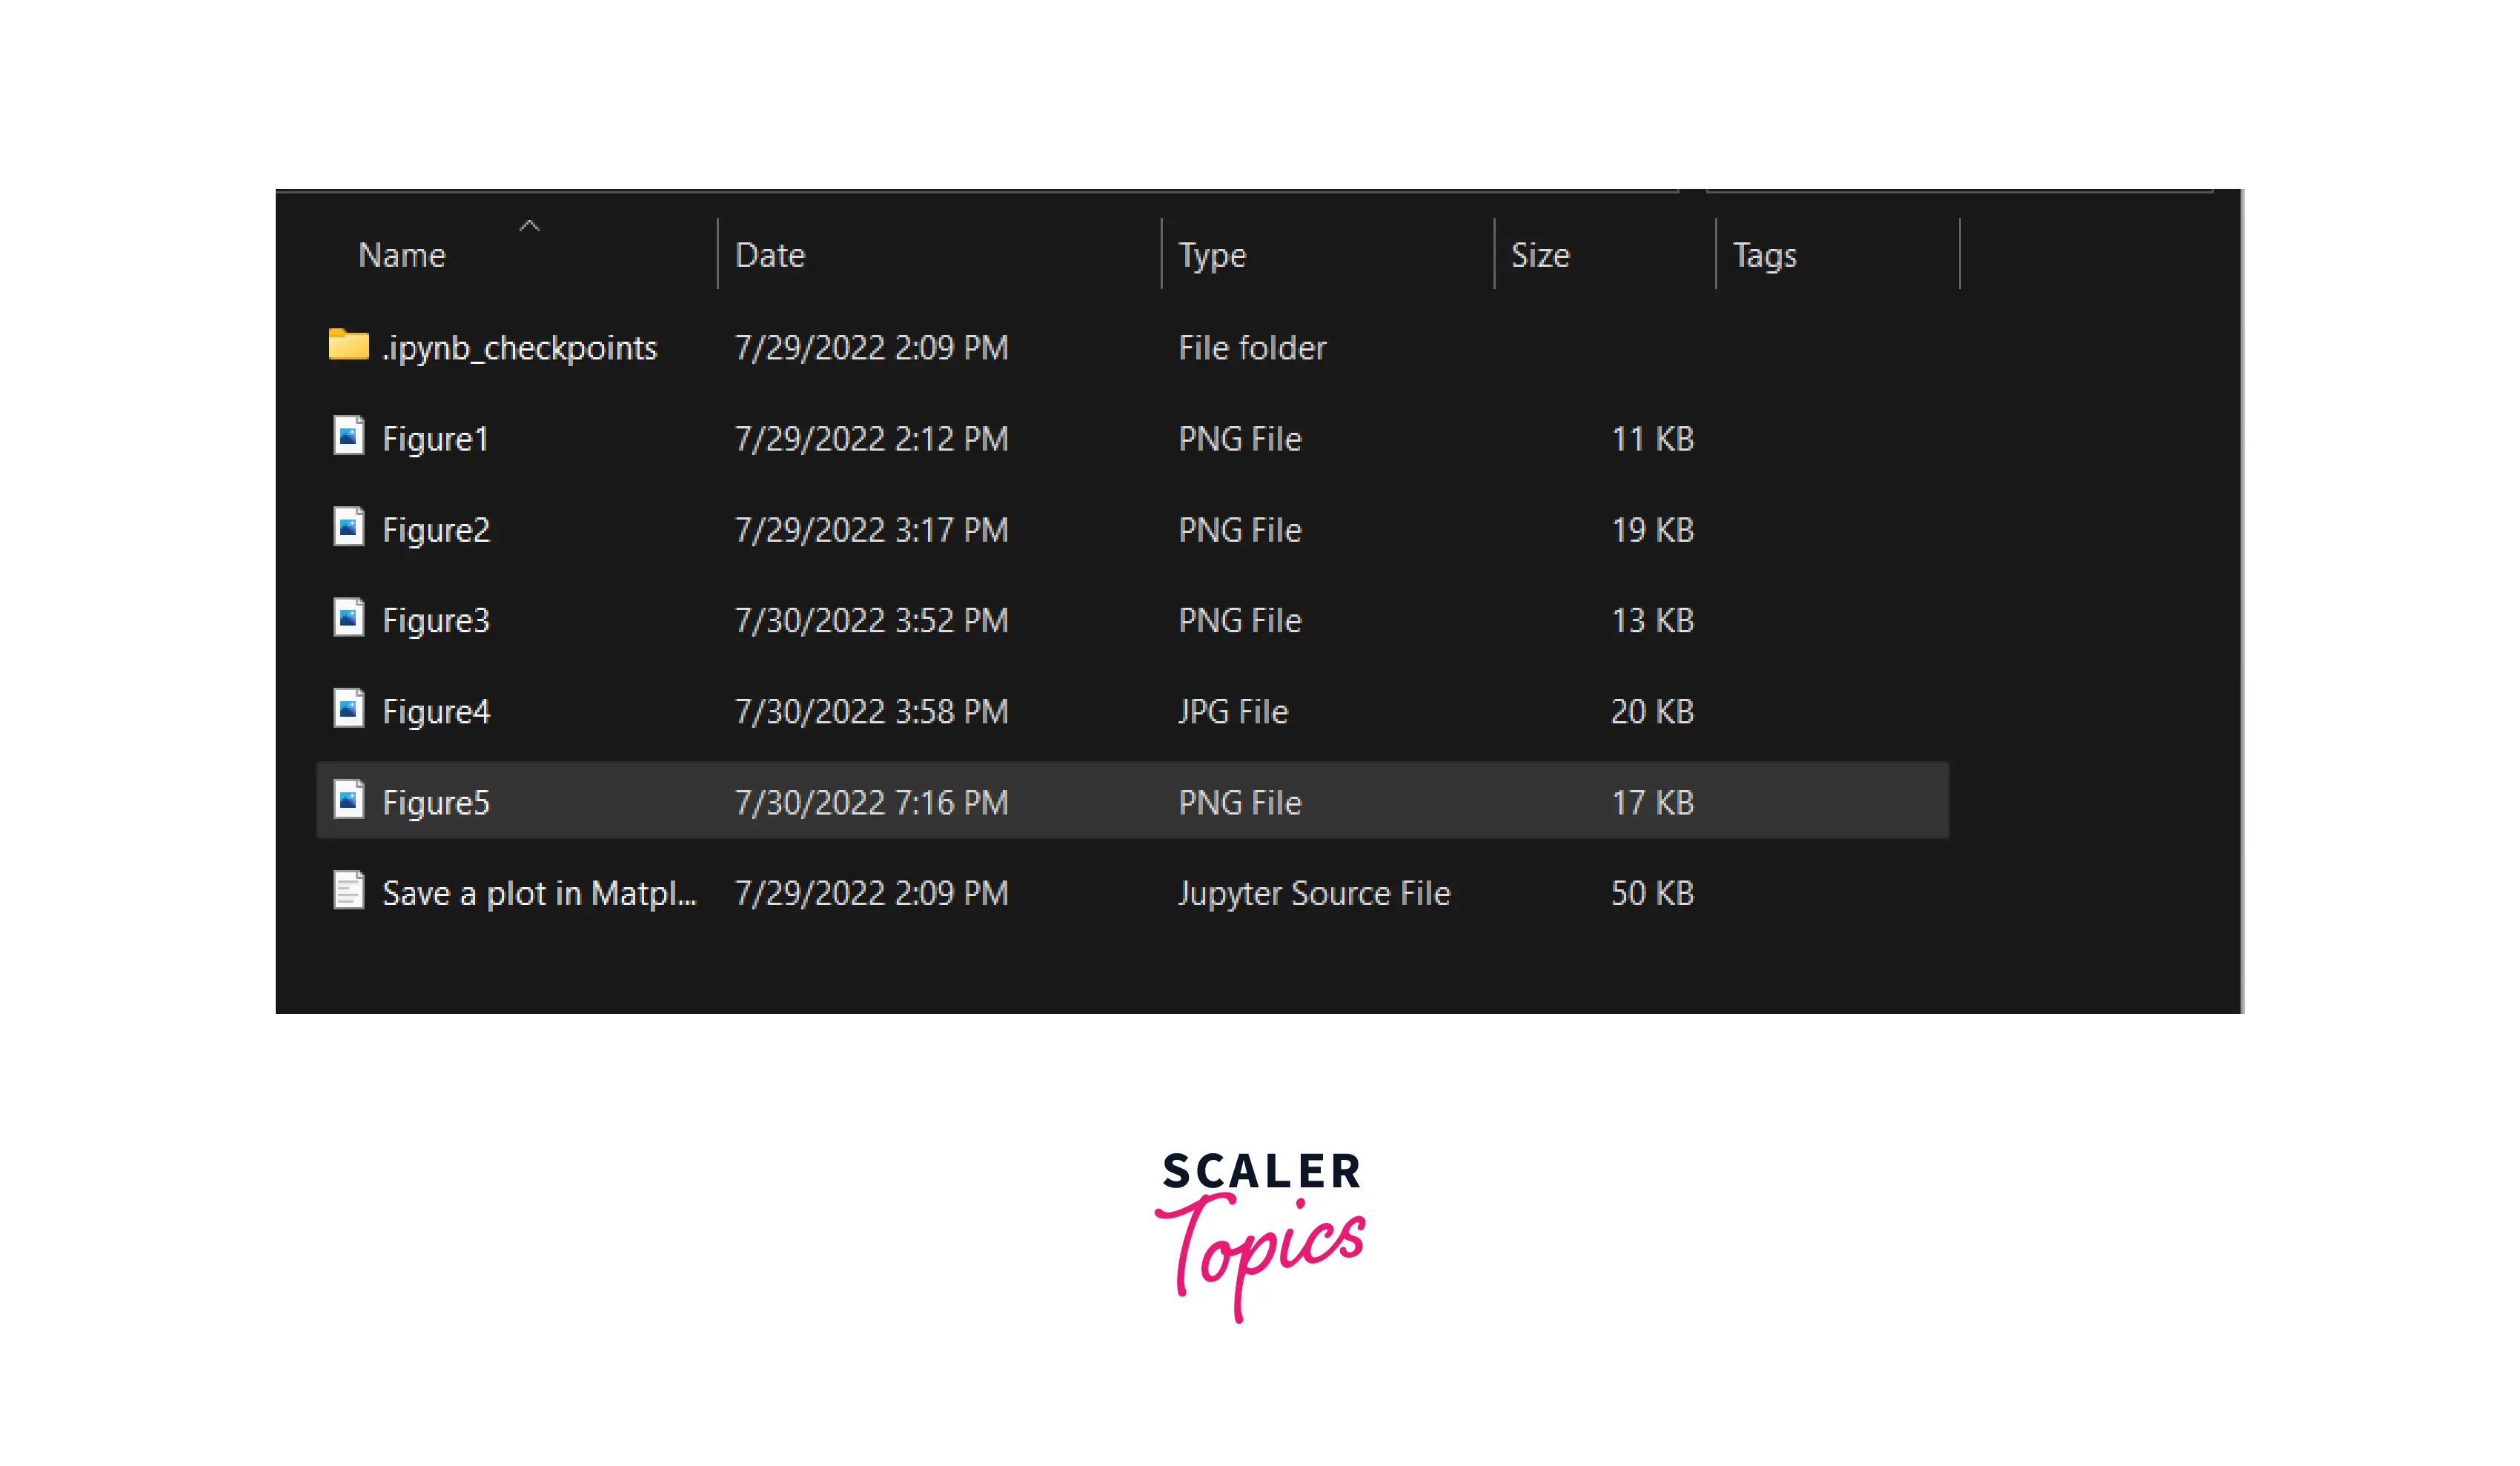
Using the savefig() function in the code above, the plot is saved as an image in your local storage.

We can open the image and see the saved plot.
Using imsave() Function
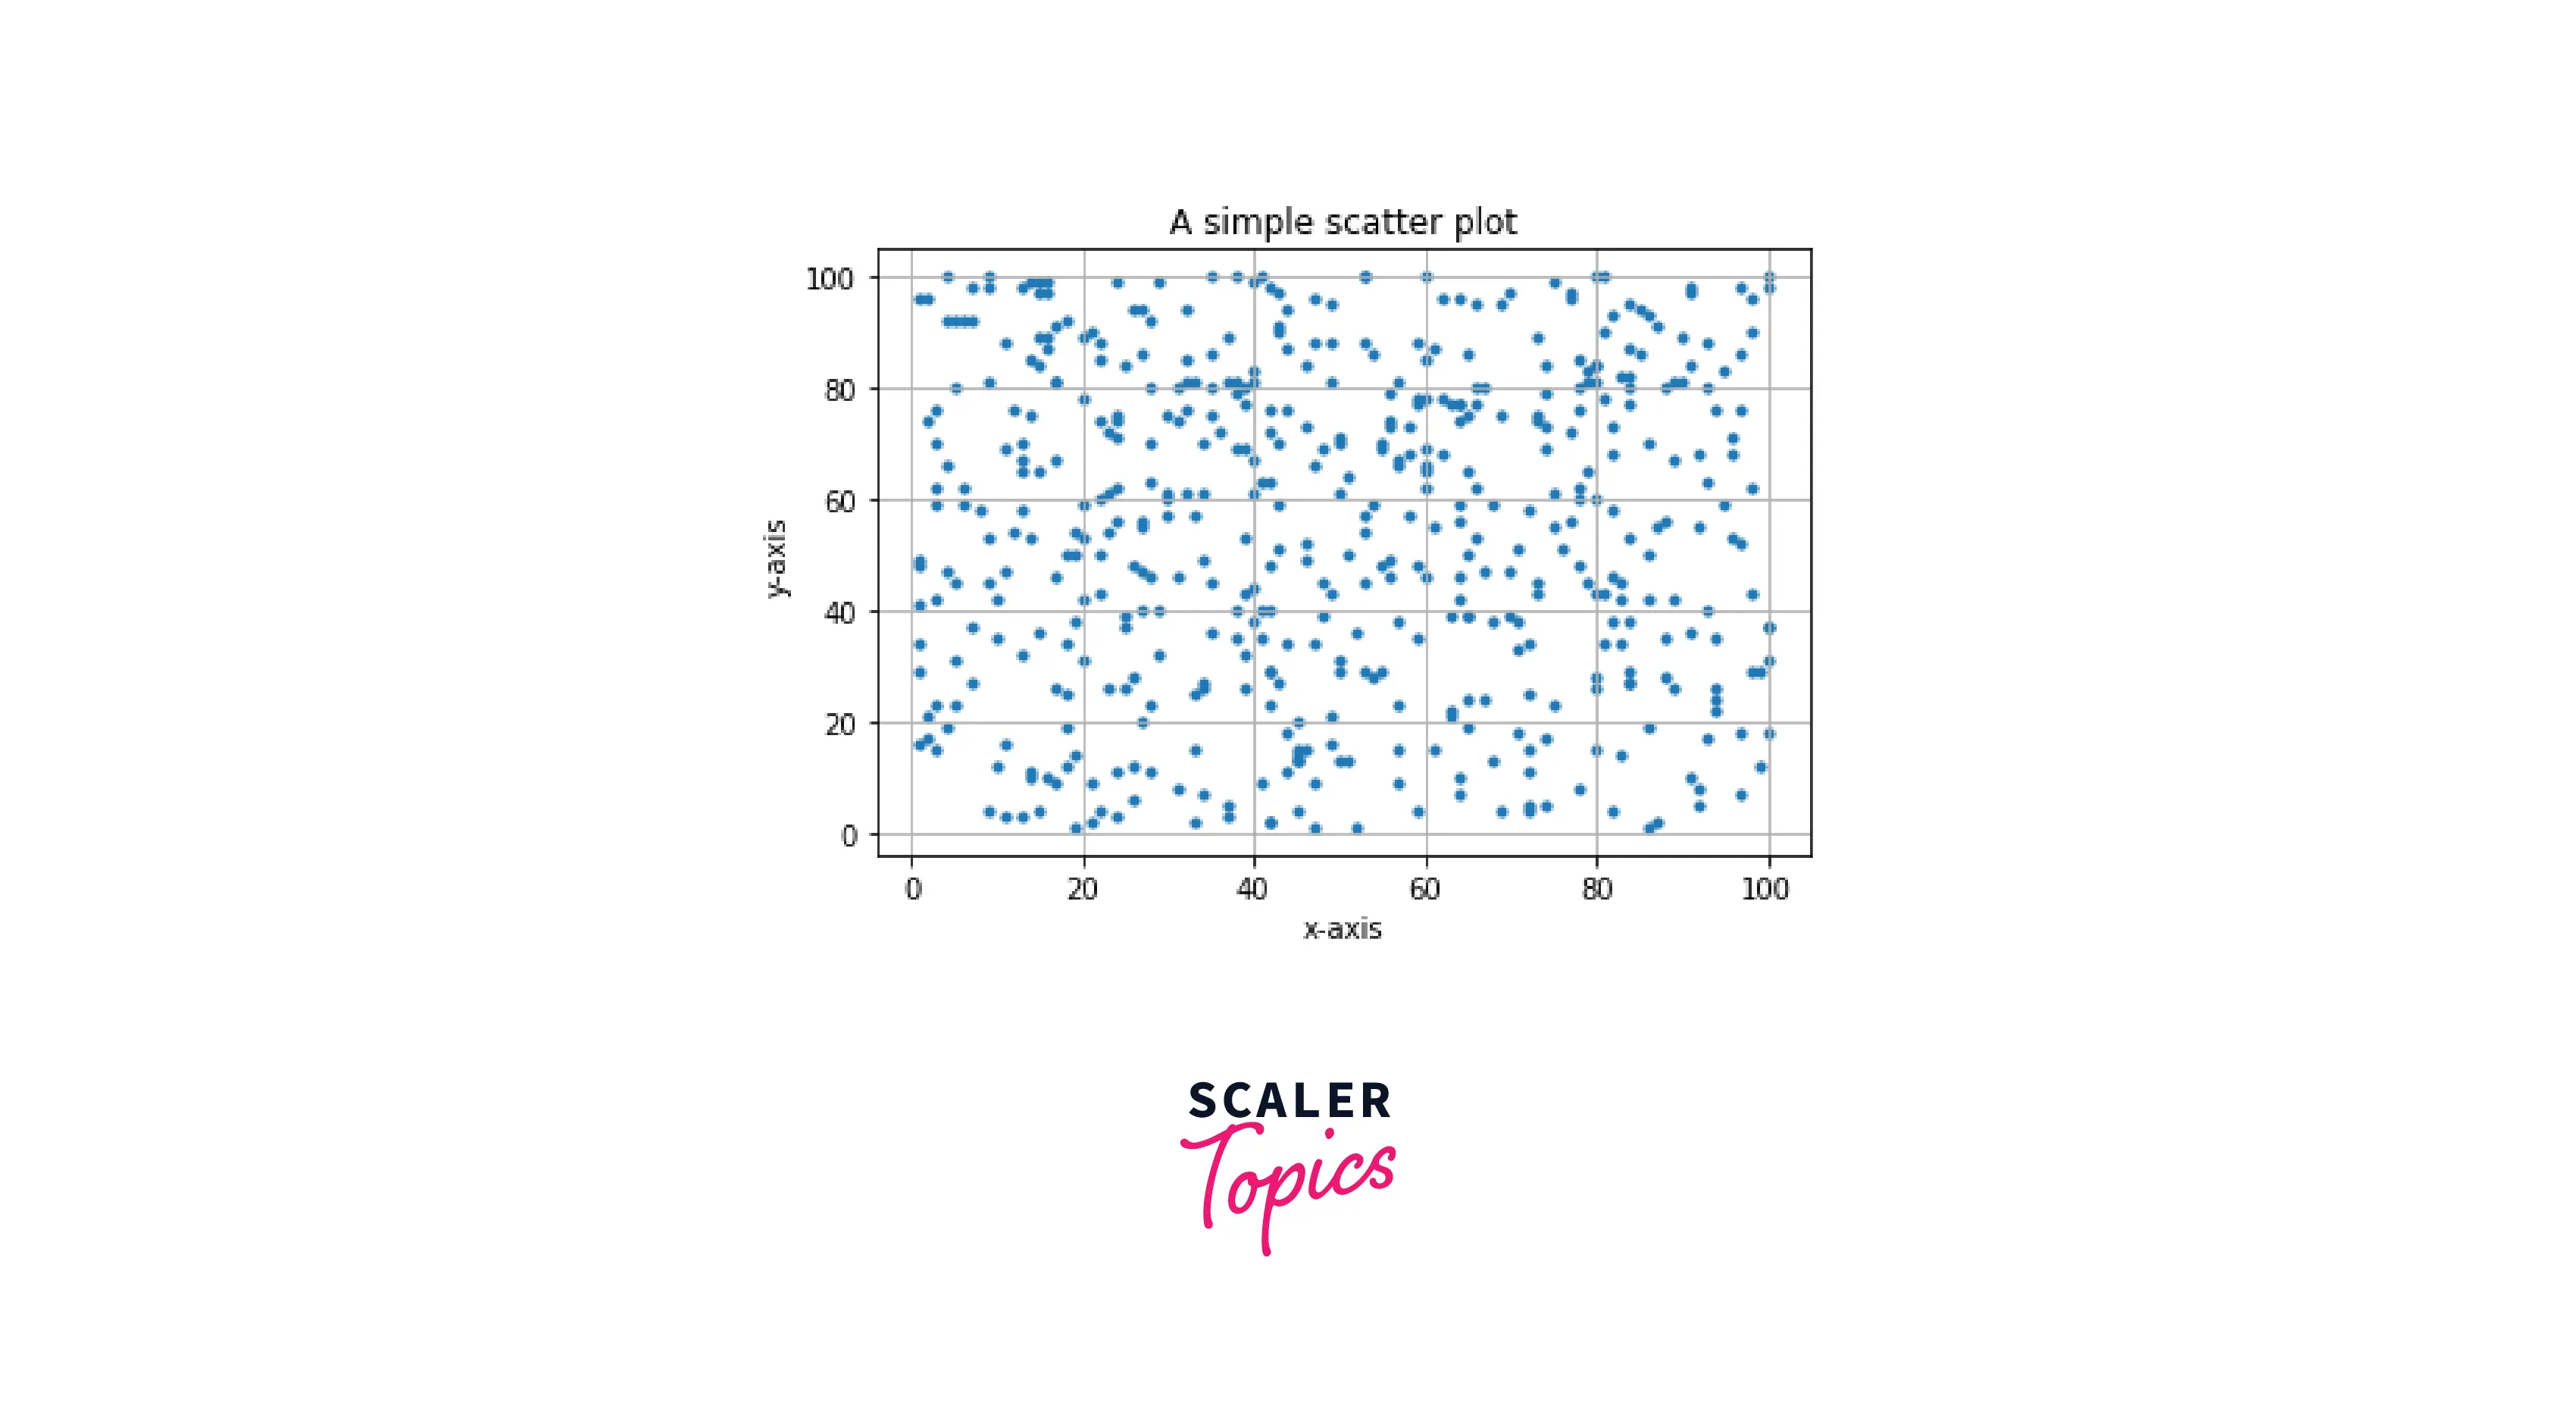
imsave() is also used for saving graphs, charts, plots, etc., in matplotlib. It also takes at least two-parameter (file name and array) to save the plot as an image to your local memory. It isn't very easy to save the matplotlib plots using the imsave() function as this function takes two parameters. The first parameter is the file name in which we must pass a string ending with extensions like 'png', 'svg', 'jpg', etc. The second parameter is an array containing the data of the rendered image.
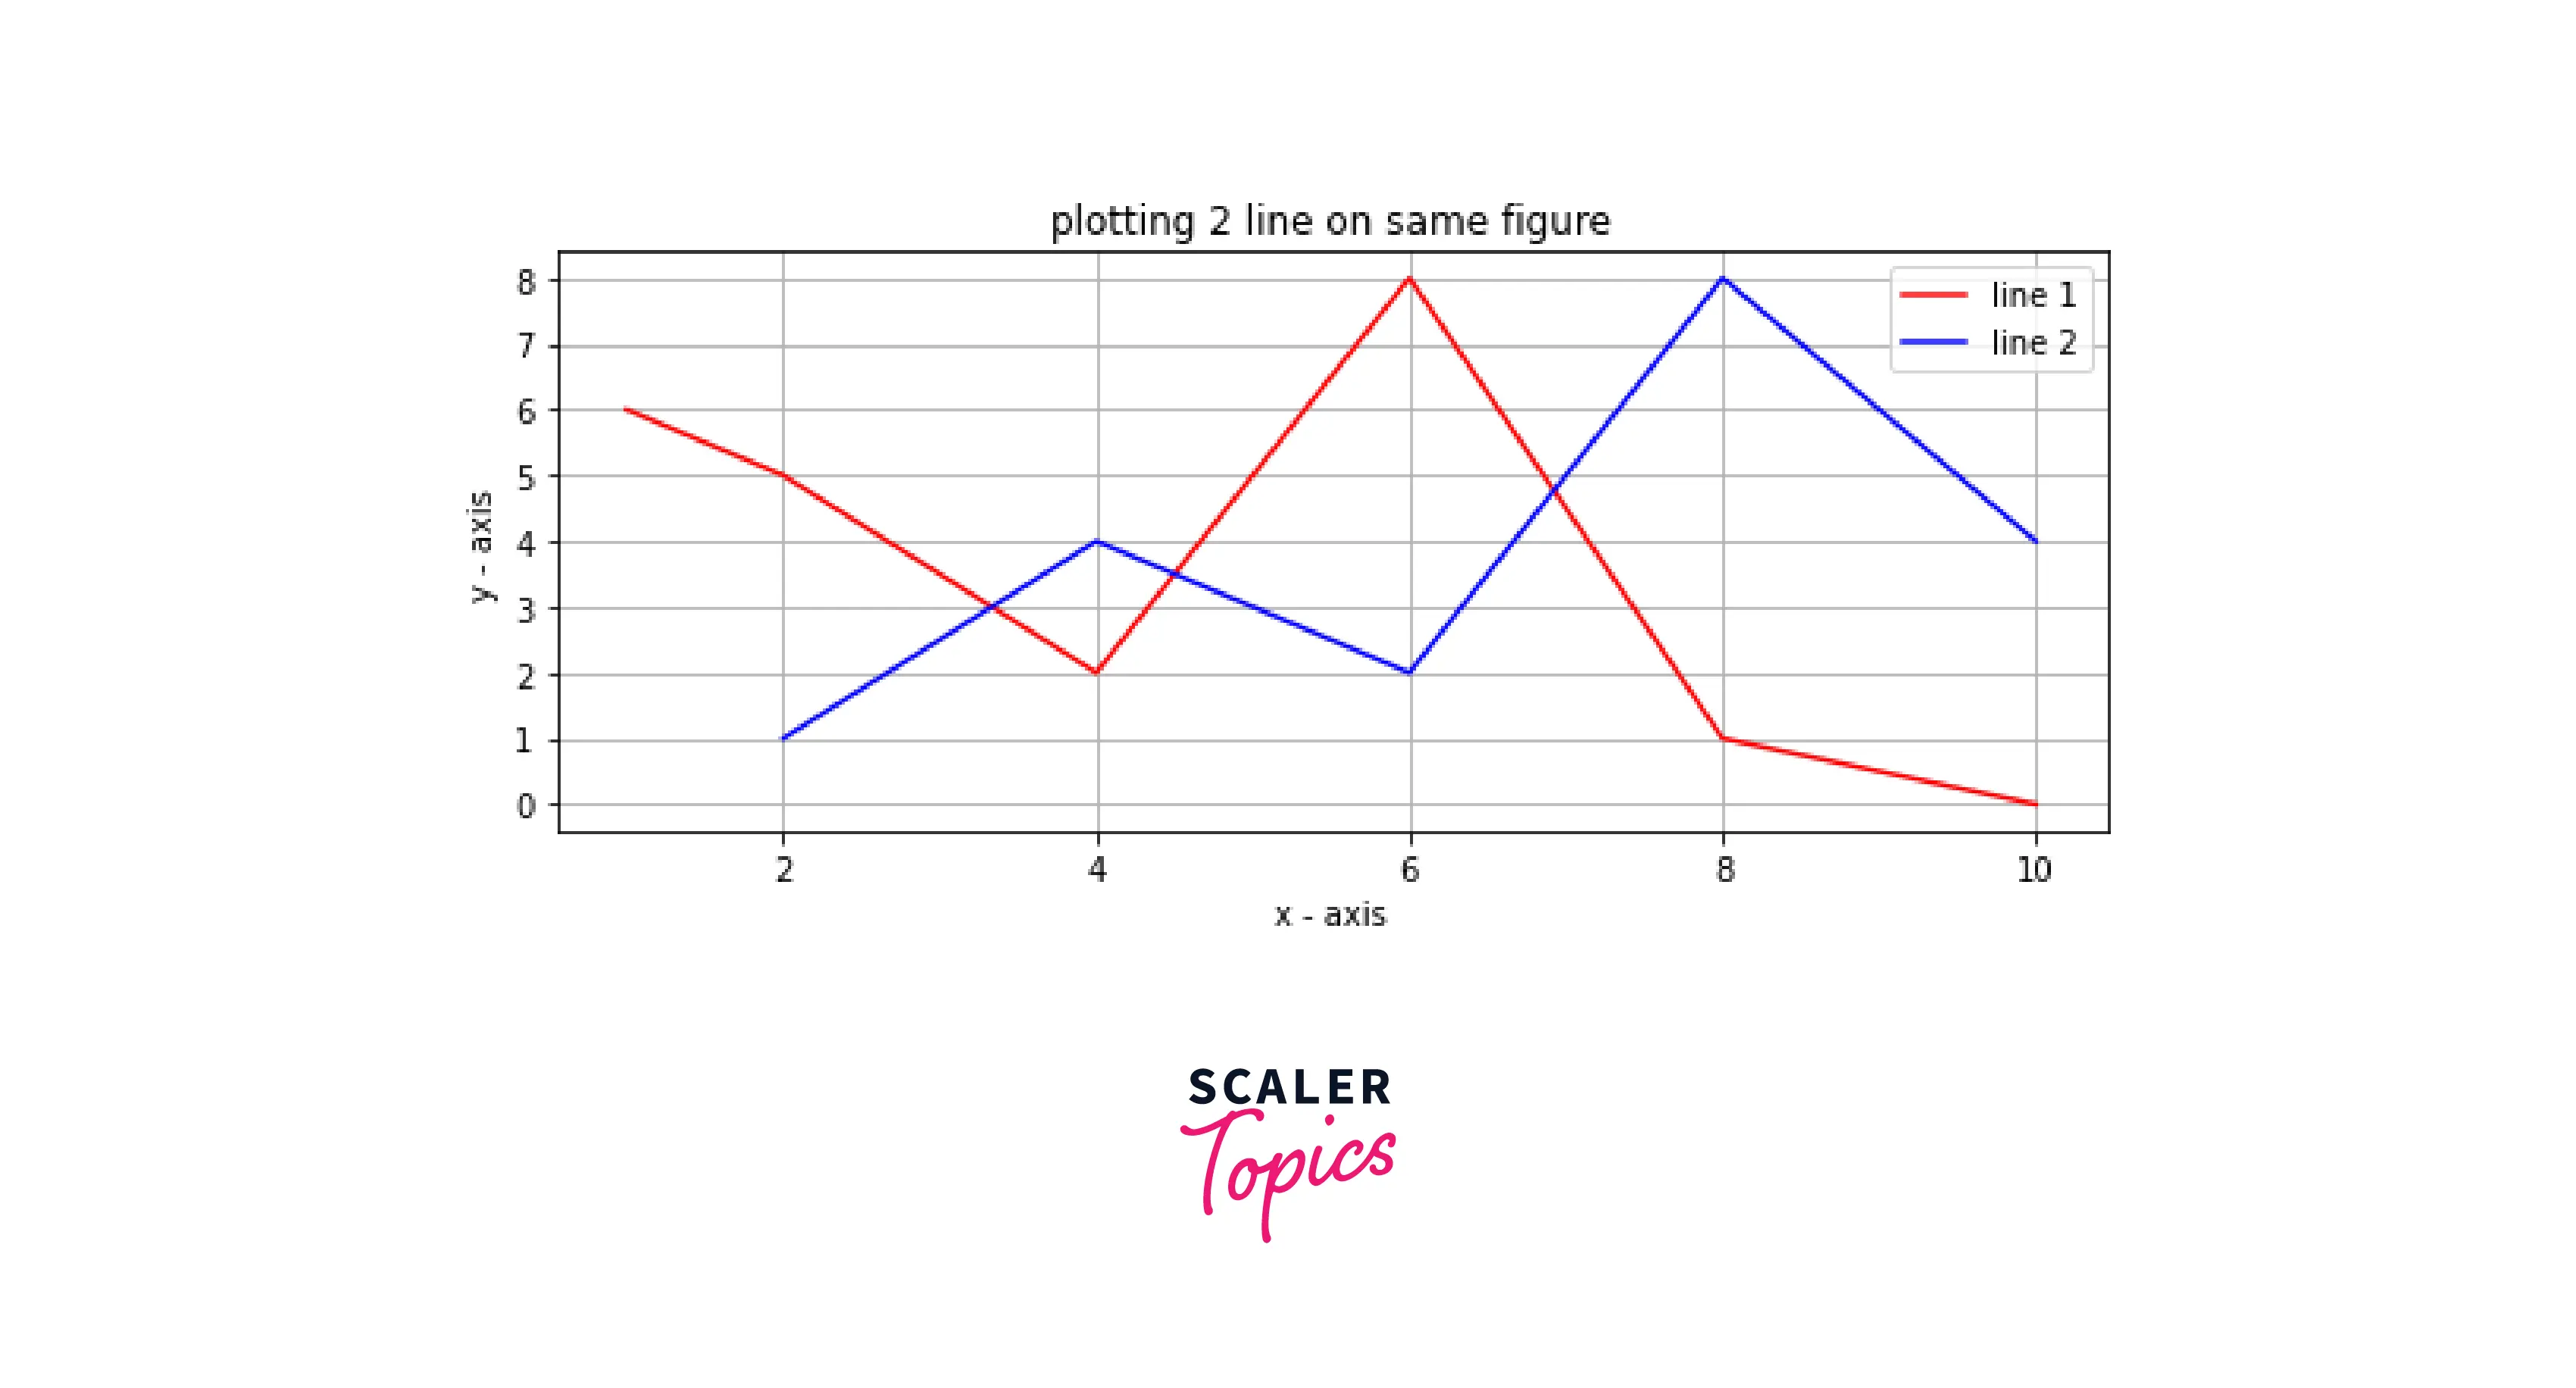
Below is the representation of how we can save plots as the image in matplotlib
Output:


Code Explanation:
- Importing the required modules.
- Creating a figure using the matplotlib.pyplot.figure() function.
- Taking x-axis data points and storing them in the list x1.
- Taking y-axis data points and storing them in the list y1.
- Then, plot line 1 on the figure using the matplotlib.pyplot.plot() function.
- Similarly, we plot line 2.
- For adding details to the plot add title, x-label, and y-label to the plot by using the function matplotlib.pyplot.title(), matplotlib.pyplot.xlabel() and matplotlib.pyplot.ylabel() functions respectively.
- make an agg figure using fig.canvas.draw().
- Converting the rendered figure into the numpy array and storing it in the list X.
- Saving the image using the function matplotlib.pyplot.imsave(), the figure's name is 'Figure2.png', and array X is the coordinates of the rendered figure.
- Displaying the plot using the matplotlib.pyplot.show() function.
Examples
Example 1: Storing the plot as an image using an absolute path
Output:

Example 2: Saving a plot as jpg
Output:


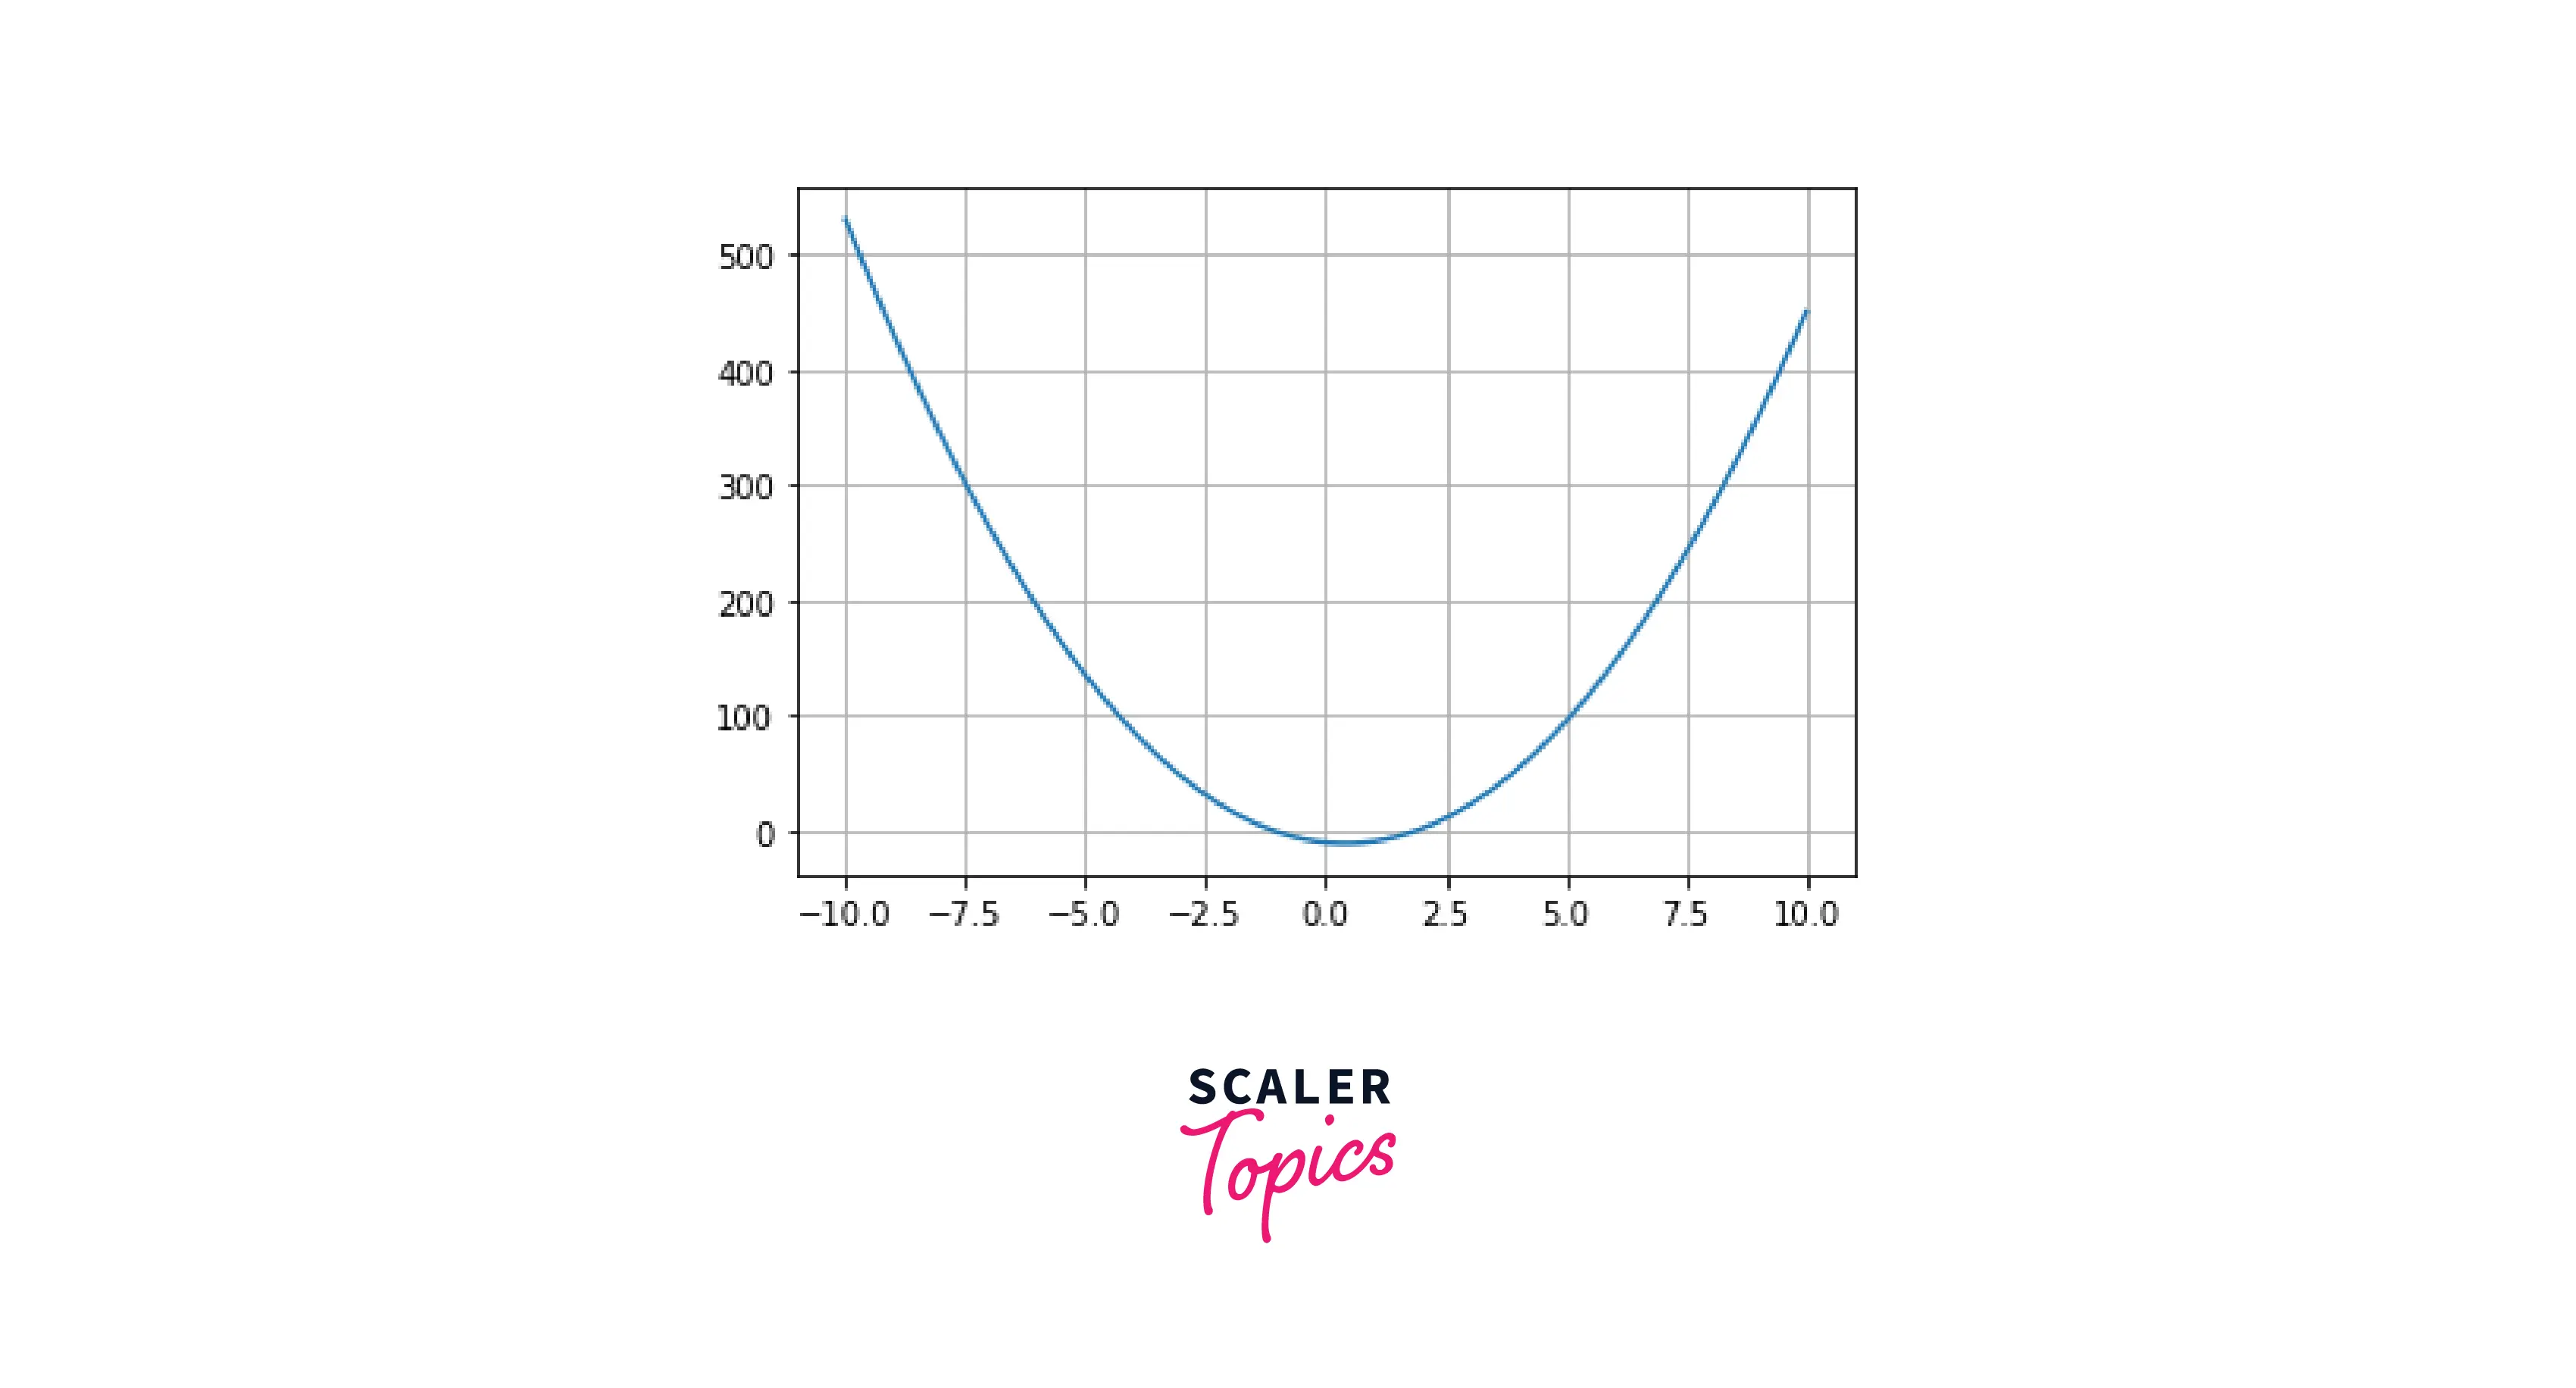
Example 3: Saving the plot as an image with high resolution
Before using the dpi parameter, we can see that the output image is unclear, as shown below.
Output:

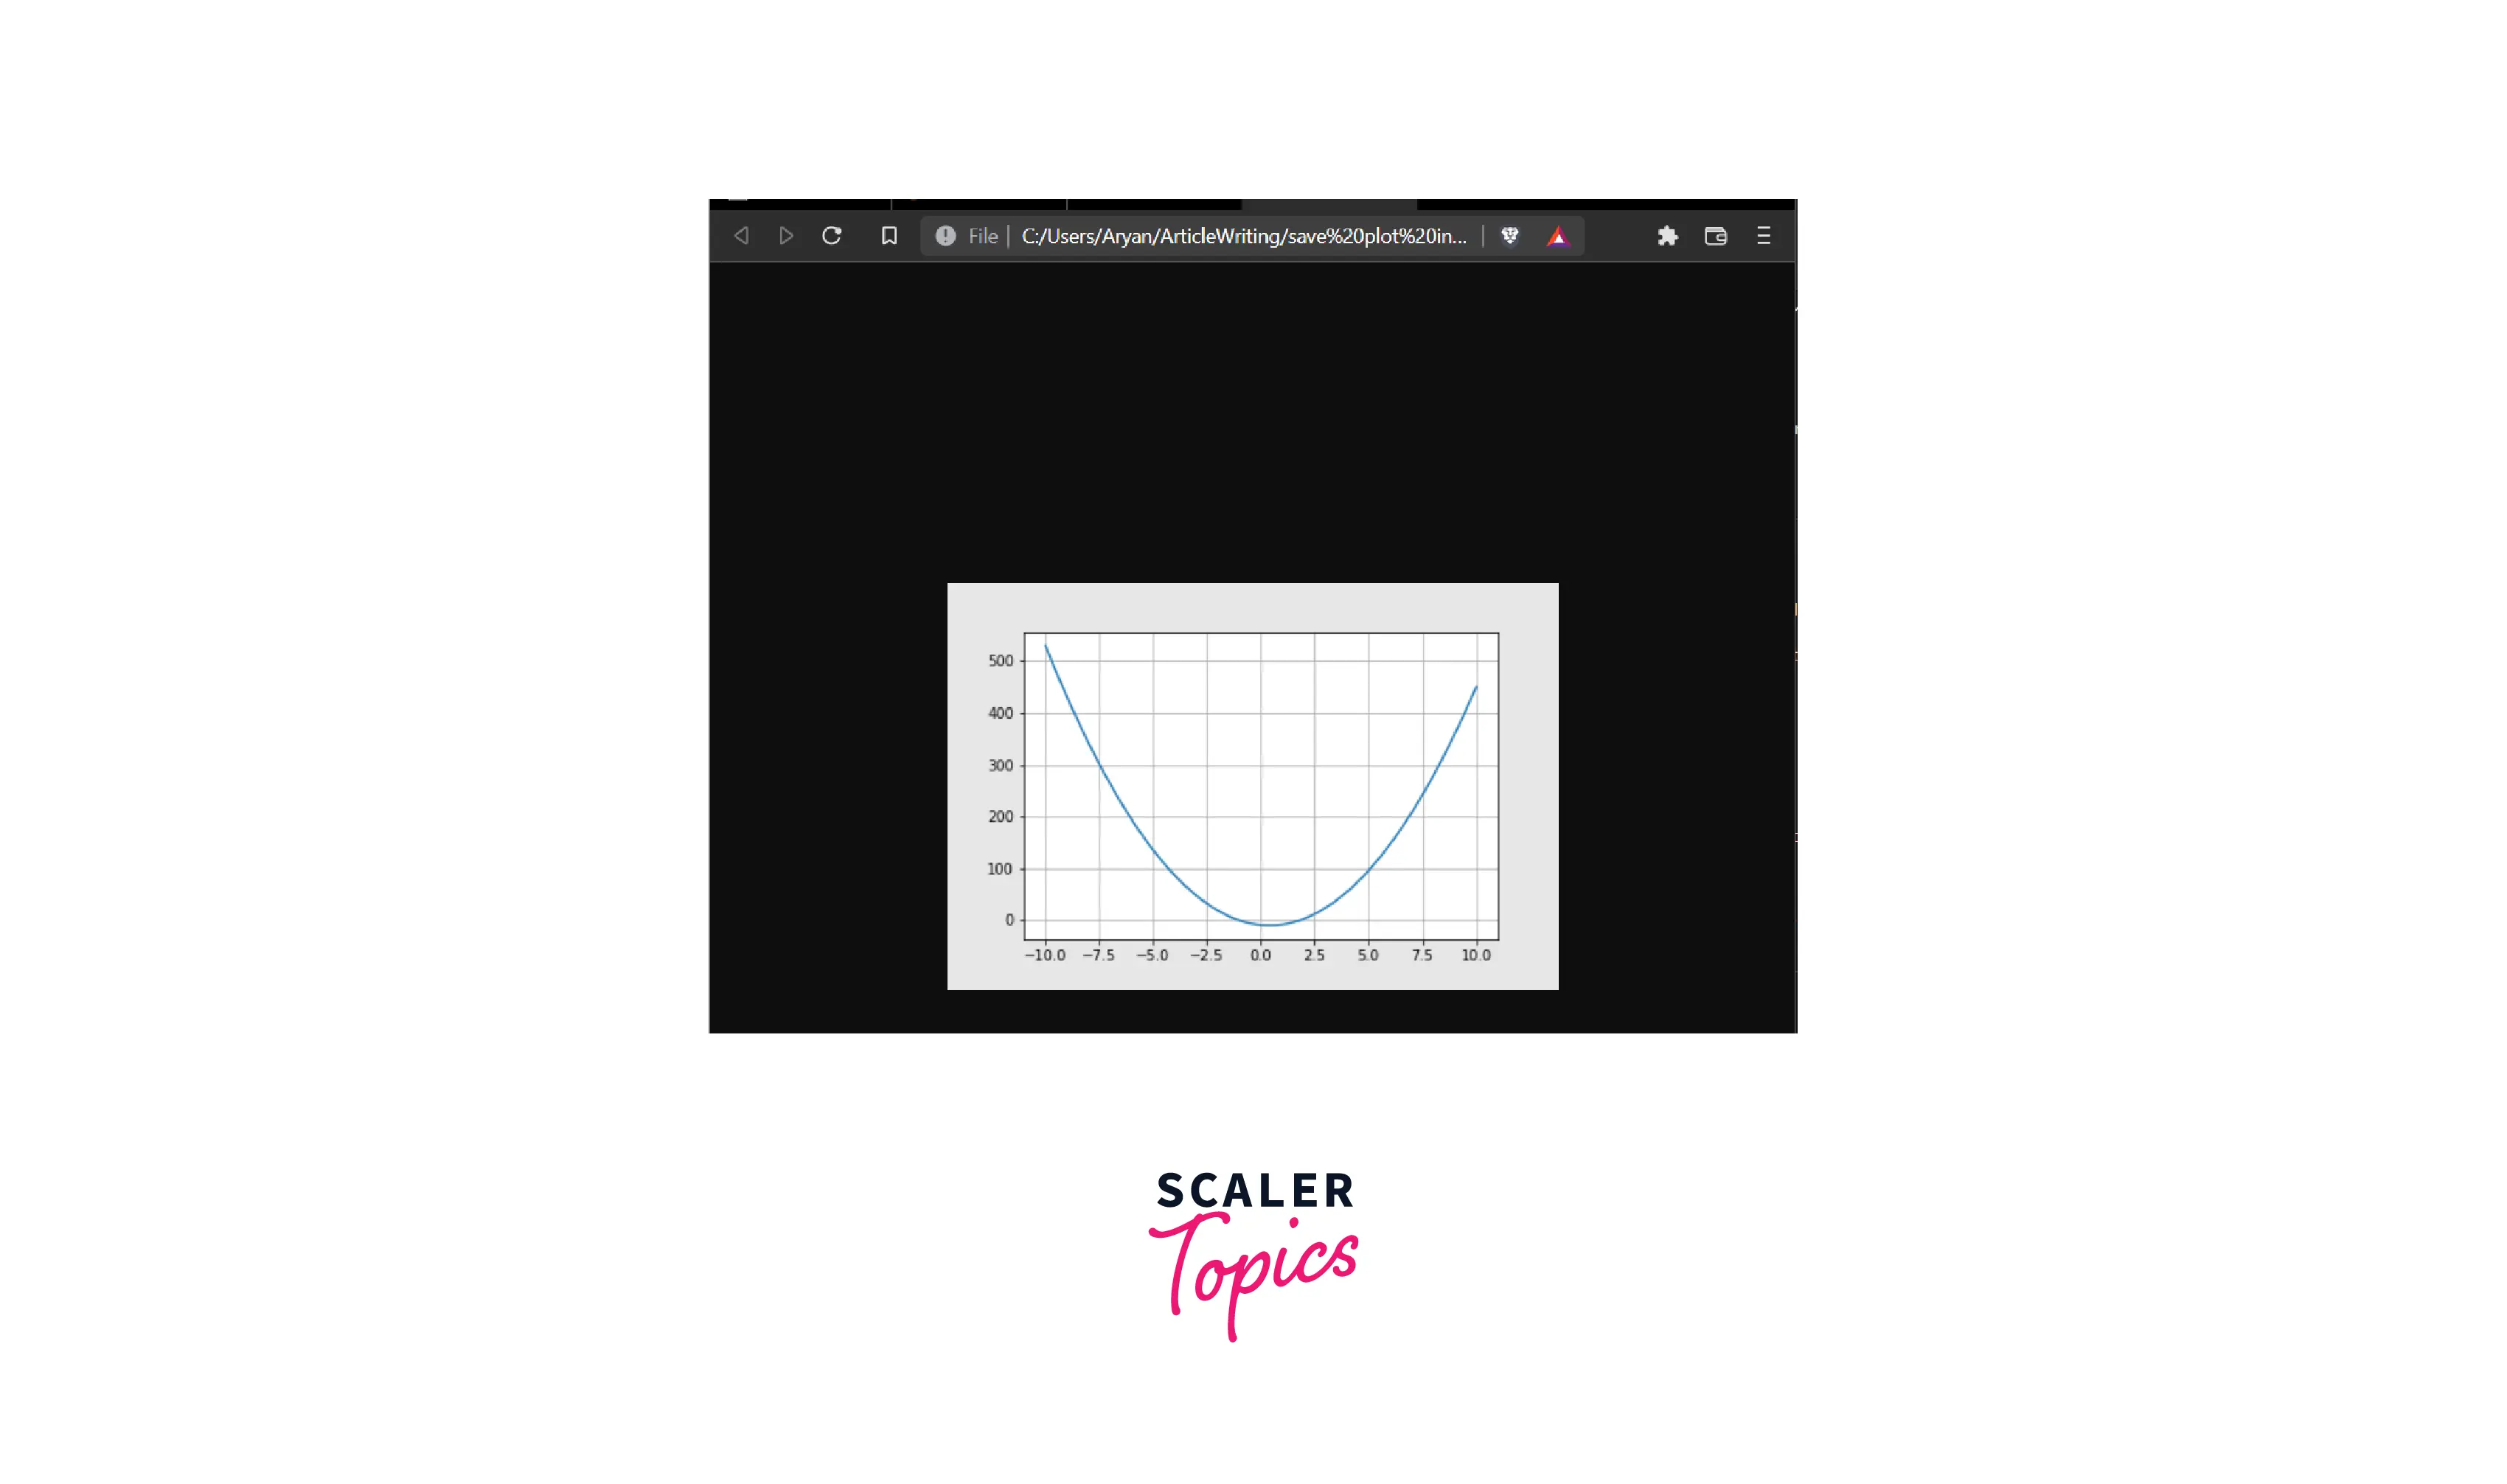
The plot is saved as a high-resolution image after using the dpi.
Output:


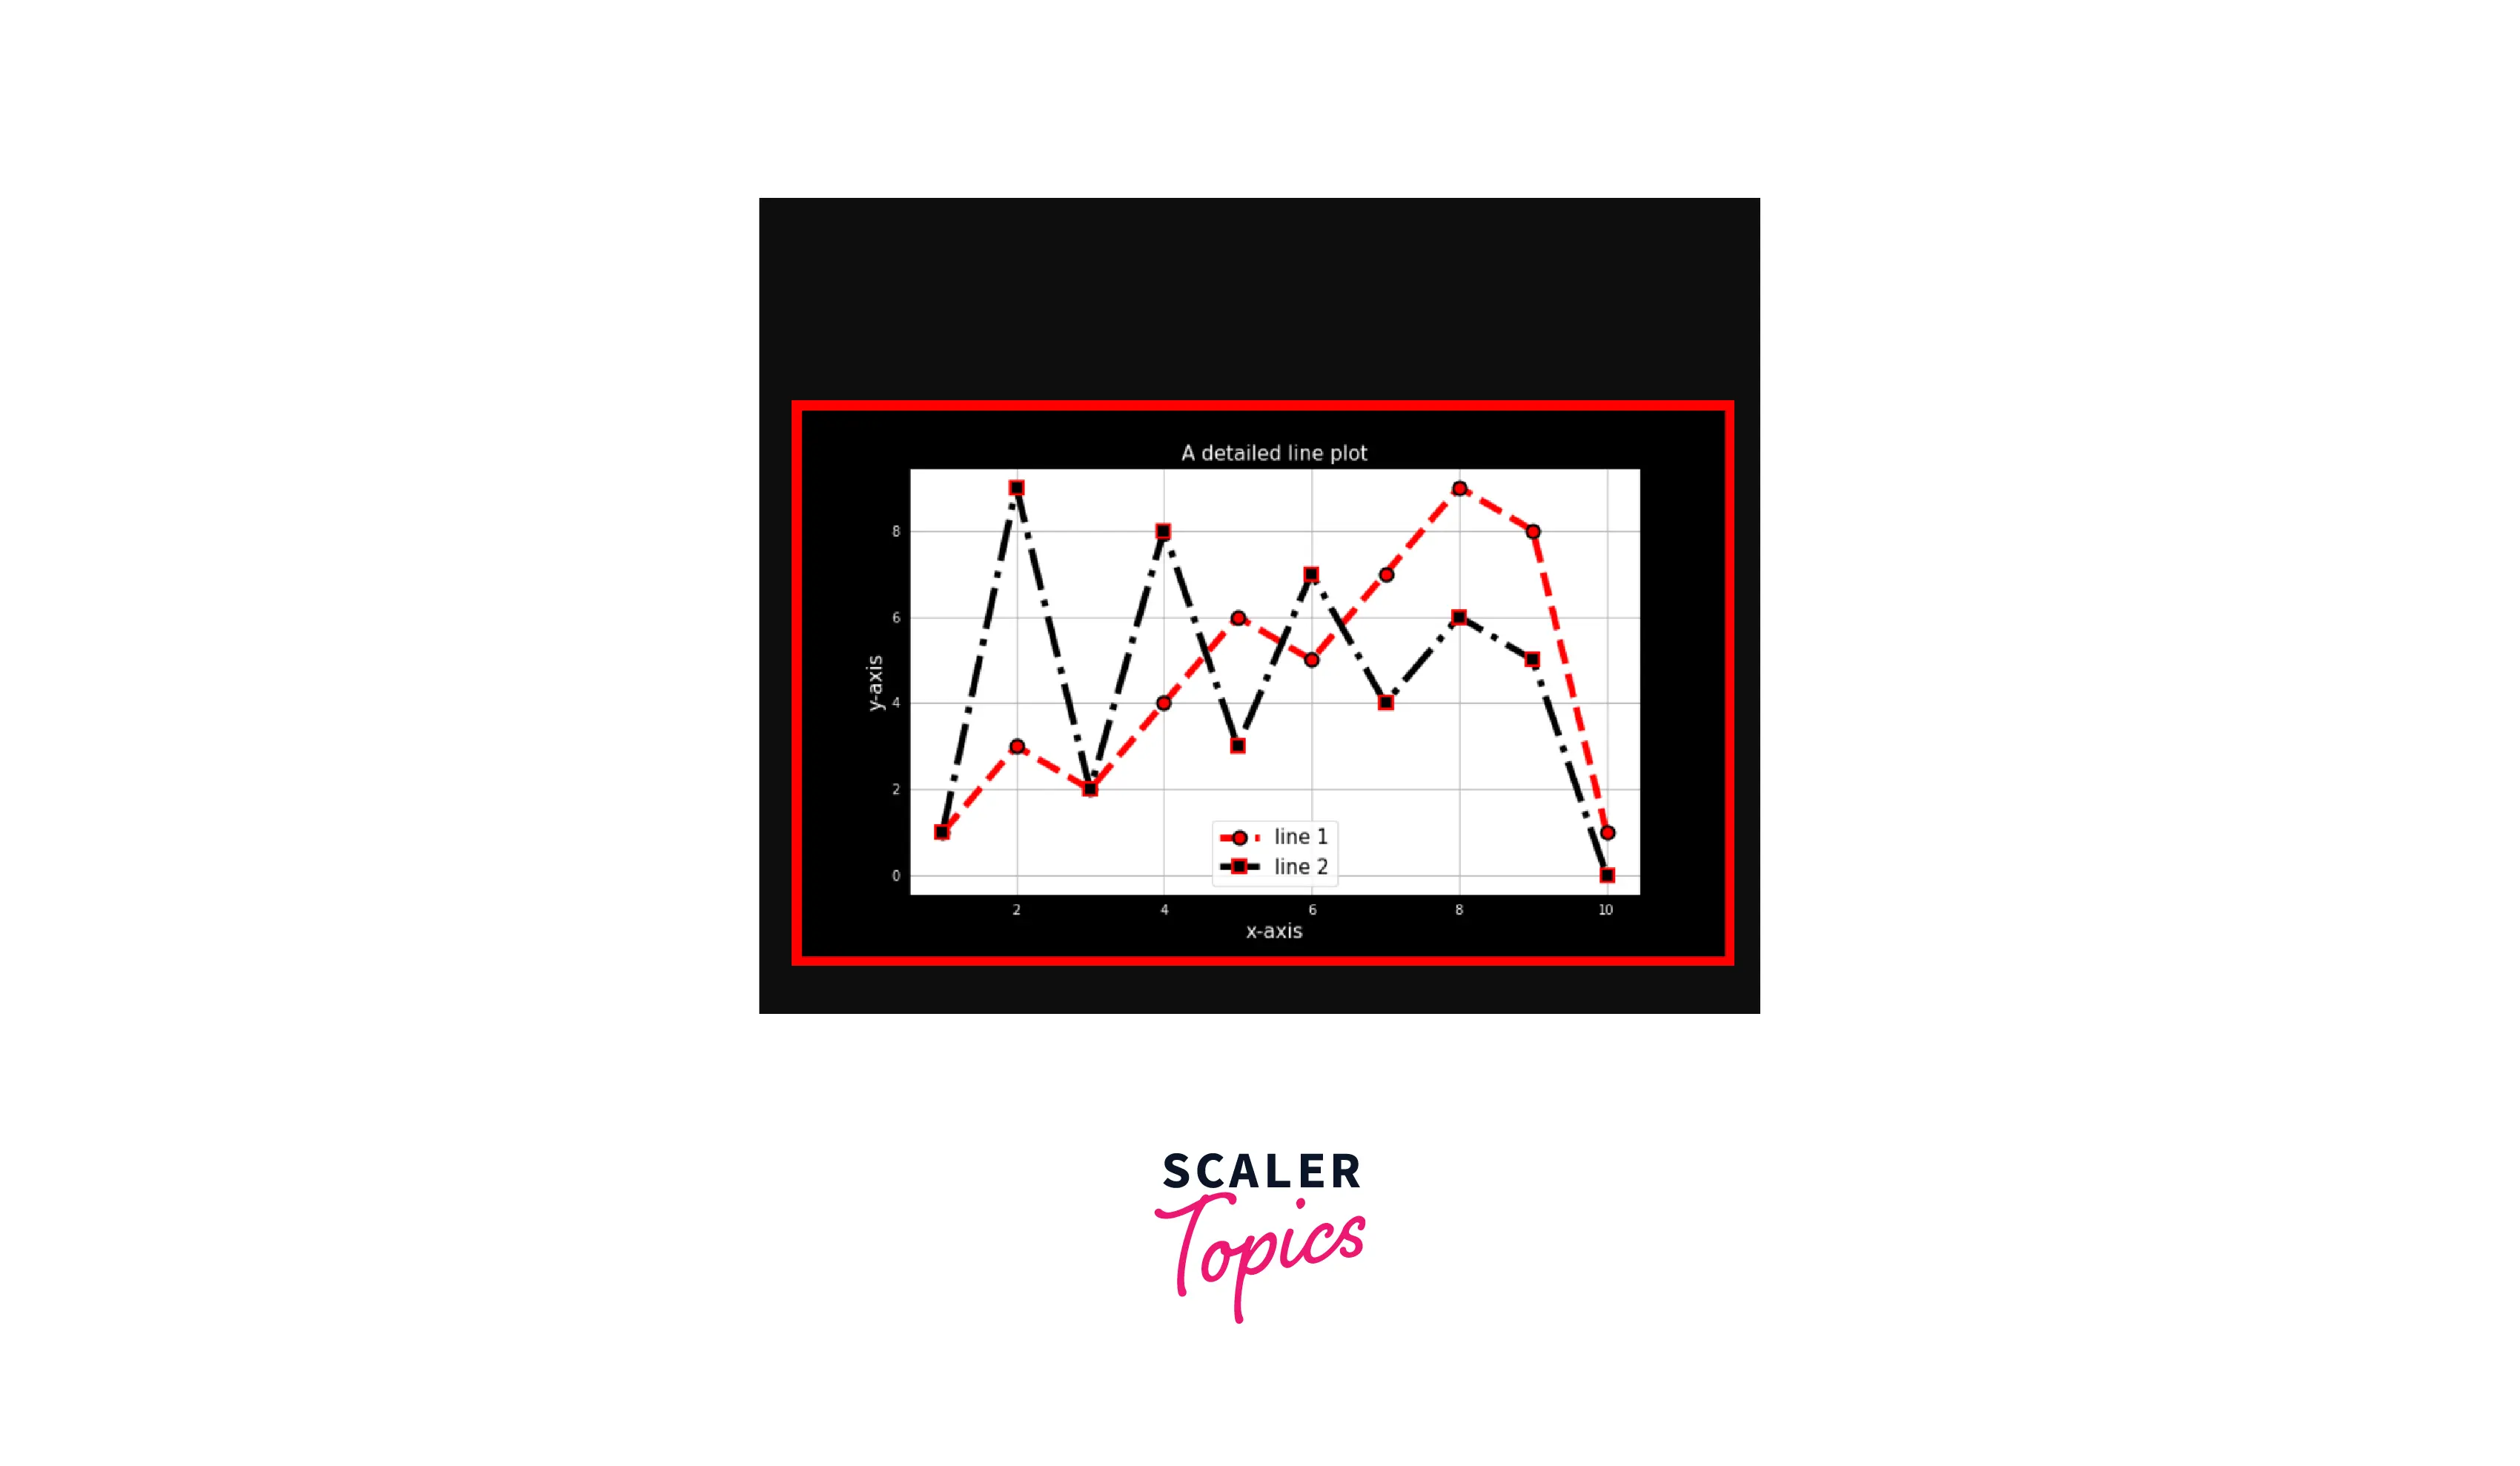
Example 4: Changing the background of the image
We can change the image's background by specifying the facecolor parameter in the imsave() or savefig() function.
Output:


Check Out Our Data Science Certification Course that Takes You Beyond the Basics Explored in This Blog. Enroll Now and Fuel Your Passion for Learning.
Conclusion
- It is important to save the plot as an image in your local memory to prevent data loss.
- There are two ways to save a plot as an image in matplotlib.
- matplotlib.pyplot.savefig() - before the show() function we have to call this function along and stating a filename ending with the valid format.
- matplotlib.pyplot.imsave() - before the show() function, we have to call this function along and state a filename ending with the valid format and an array that contains the NumPy array of the rendered figure.
- We can store the images in formats like pdf, png, jpg, svg, etc.
- We can also change the dpi of the image by using the parameter dpi in the function.
- Matplotlib's plot can be saved as an image at a specific location using an absolute path.
- By saving the plot as an image, we can change its background, transparency, edge color, and border thickness.