Save Matplotlib Figure as PNG
Overview
Plots developed using matplotlib are useful for generating inferences and making informed decisions. Moreover, saving our plots in a specific format enables us to use them anywhere as an image/file, and we can embed them with presentations, Excel sheets, documents, etc.
This article will cover various methods to save matplotlib figures as png. We'll also make our plots and save them locally.
Introduction
Matplotlib is a powerful library in Python for creating graphs and plots. Matplotlib can produce many graphs, plots, charts, histograms, and other visual representations.
When we generally use matplotlib to plot our observations, we use the plt.show() function to display our plots inline with our Jupyter Notebook/Visual Studio Code. This ensures that our plots are visible to us but not locally in our system.
To save matplotlib figures as png images, we need to use the plt.savefig() function with its relevant parameters. We'll start from the basics and end with real-world examples of saving plots.
Transform Your Career
Choose from our industry-leading programs designed for career success
Modern Software and AI Engineering Program
Master full-stack development with AI integration

Modern Data Science and ML with specialisation in AI
Advanced data science techniques with AI specialization
Advanced AIML with Specialisation in Agentic AI
Deep dive into AIML with focus on Agentic systems
DevOps, Cloud & AI Platform Engineering
Build and manage AI-powered cloud infrastructure
AI Engineering Advanced Certification by IIT-Roorkee
Premier AI engineering certification from IIT-Roorkee
Basics of Saving a matplotlib Figure as a PNG File
We save our plots as .PNG files to use them anywhere and infer decisions from them. However, regarding matplotlib, it doesn't automatically save our plot in the script folder. Instead, we have to explicitly call a function to make matplotlib save the file in our local system.
There are two ways of saving a matplotlib figure as a .PNG file:
- .savefig()
- .imsave()
Syntax
The syntax for .savefig() is:
Parameters
The parameters for .savefig() are given below:
- fname: Name of the file
- dpi: Dots Per Inch used to alter the resolution of our image.
- format: The specific format of our file (In this case, PNG)
Some additional parameters are:
- bbox_inches: Only the specified area of the figure is kept in inches when using the bounding box.
- facecolor: The face-color of our image.
- edgecolor: The edge-color of our image.
Turn Learning into Career Growth
Syntax
The syntax for .imsave() is:
Parameters
The parameters for .imsave() are:
- fname: Name of the file.
- arr: The image in array-format.
How to Save matplotlib Figure as PNG
To save matplotlib figure as .PNG file, we will have to plot our graph first, then use the savefig() or imsave() function.
In the example given below, we will use the .savefig() method to save a matplotlib figure as a .PNG file:
Explanation:
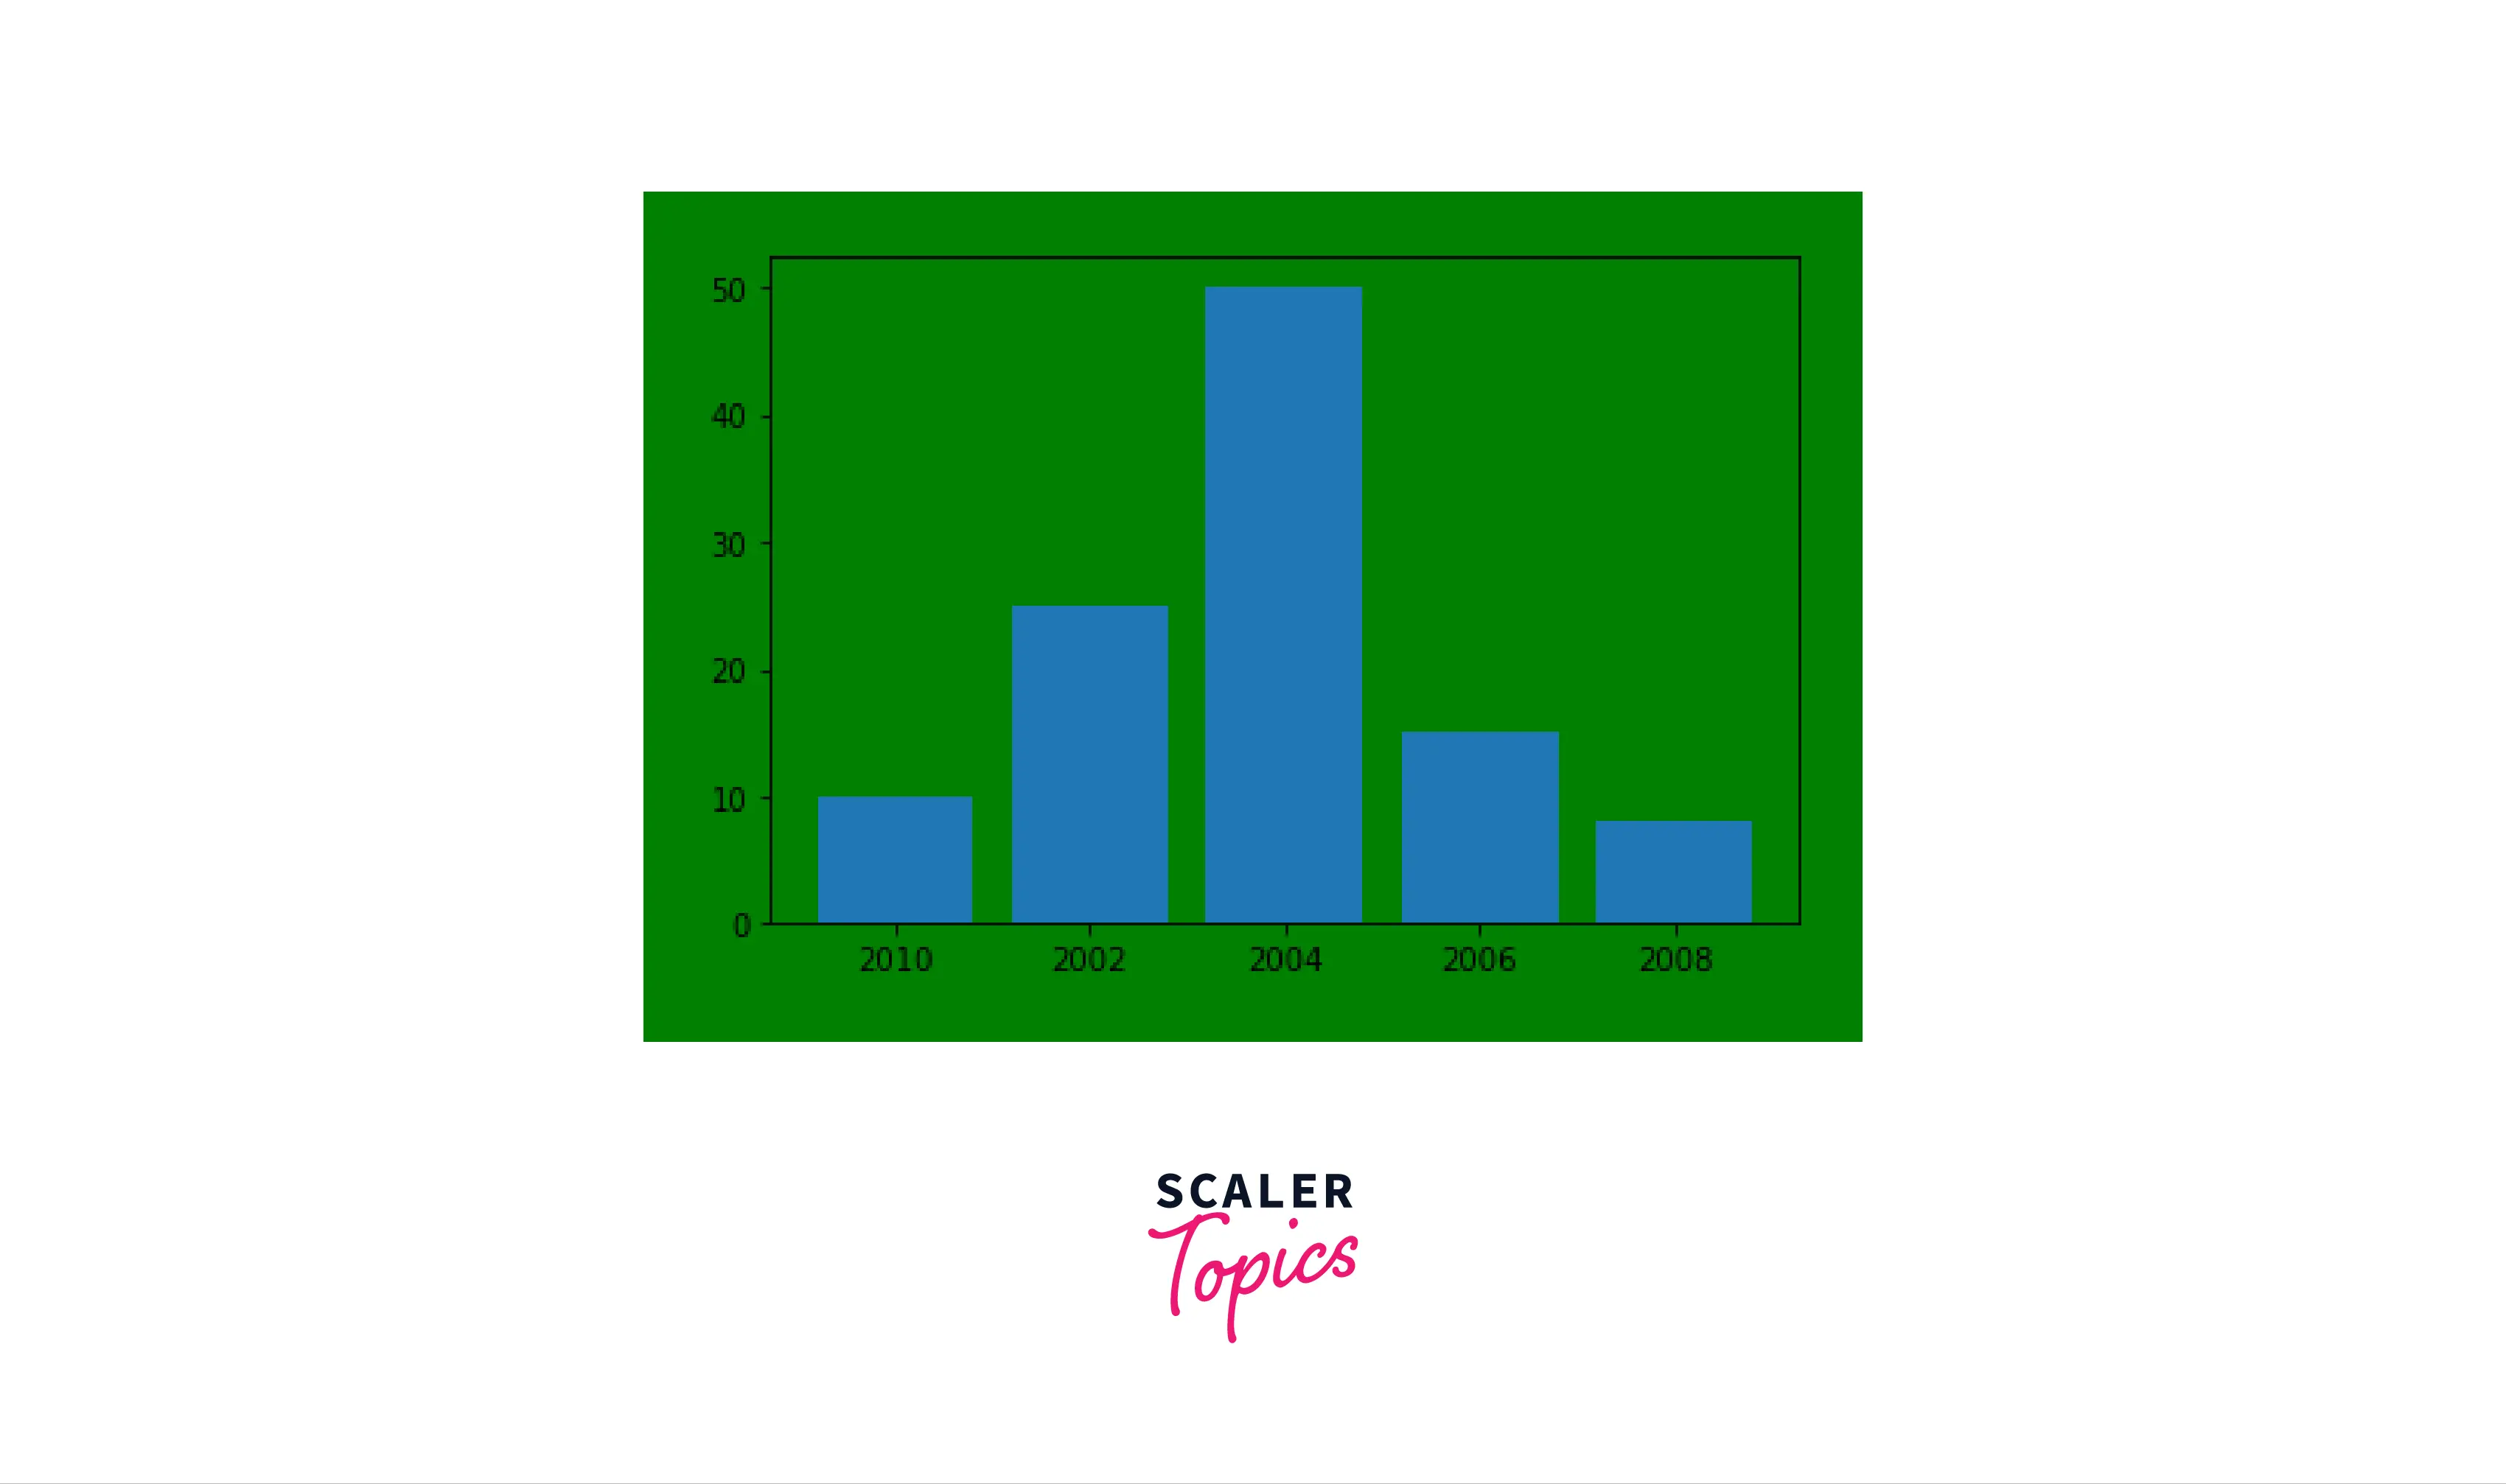
We plot a standard bar graph by taking two data points (x, y). After that, we used the .savefig() function to save the matplotlib figure as .PNG file. In the following line, we have put some additional parameters like facecolor, bbox_inches so enhance the features of the plot.

Output:
-
Output-1:

-
Output-2:
Now, we will use the .imread() function to save our matplotlib figures:
Explanation:
In this code snippet, we will try to read a plot from disk and use the .imsave() function to save that plot again. The imageio library helps us to manage reading files from disk. After that, we load the image in a new variable image_new and display it.
Output:

Examples
In this section, we will review some examples of saving matplotlib figure in PNG format.
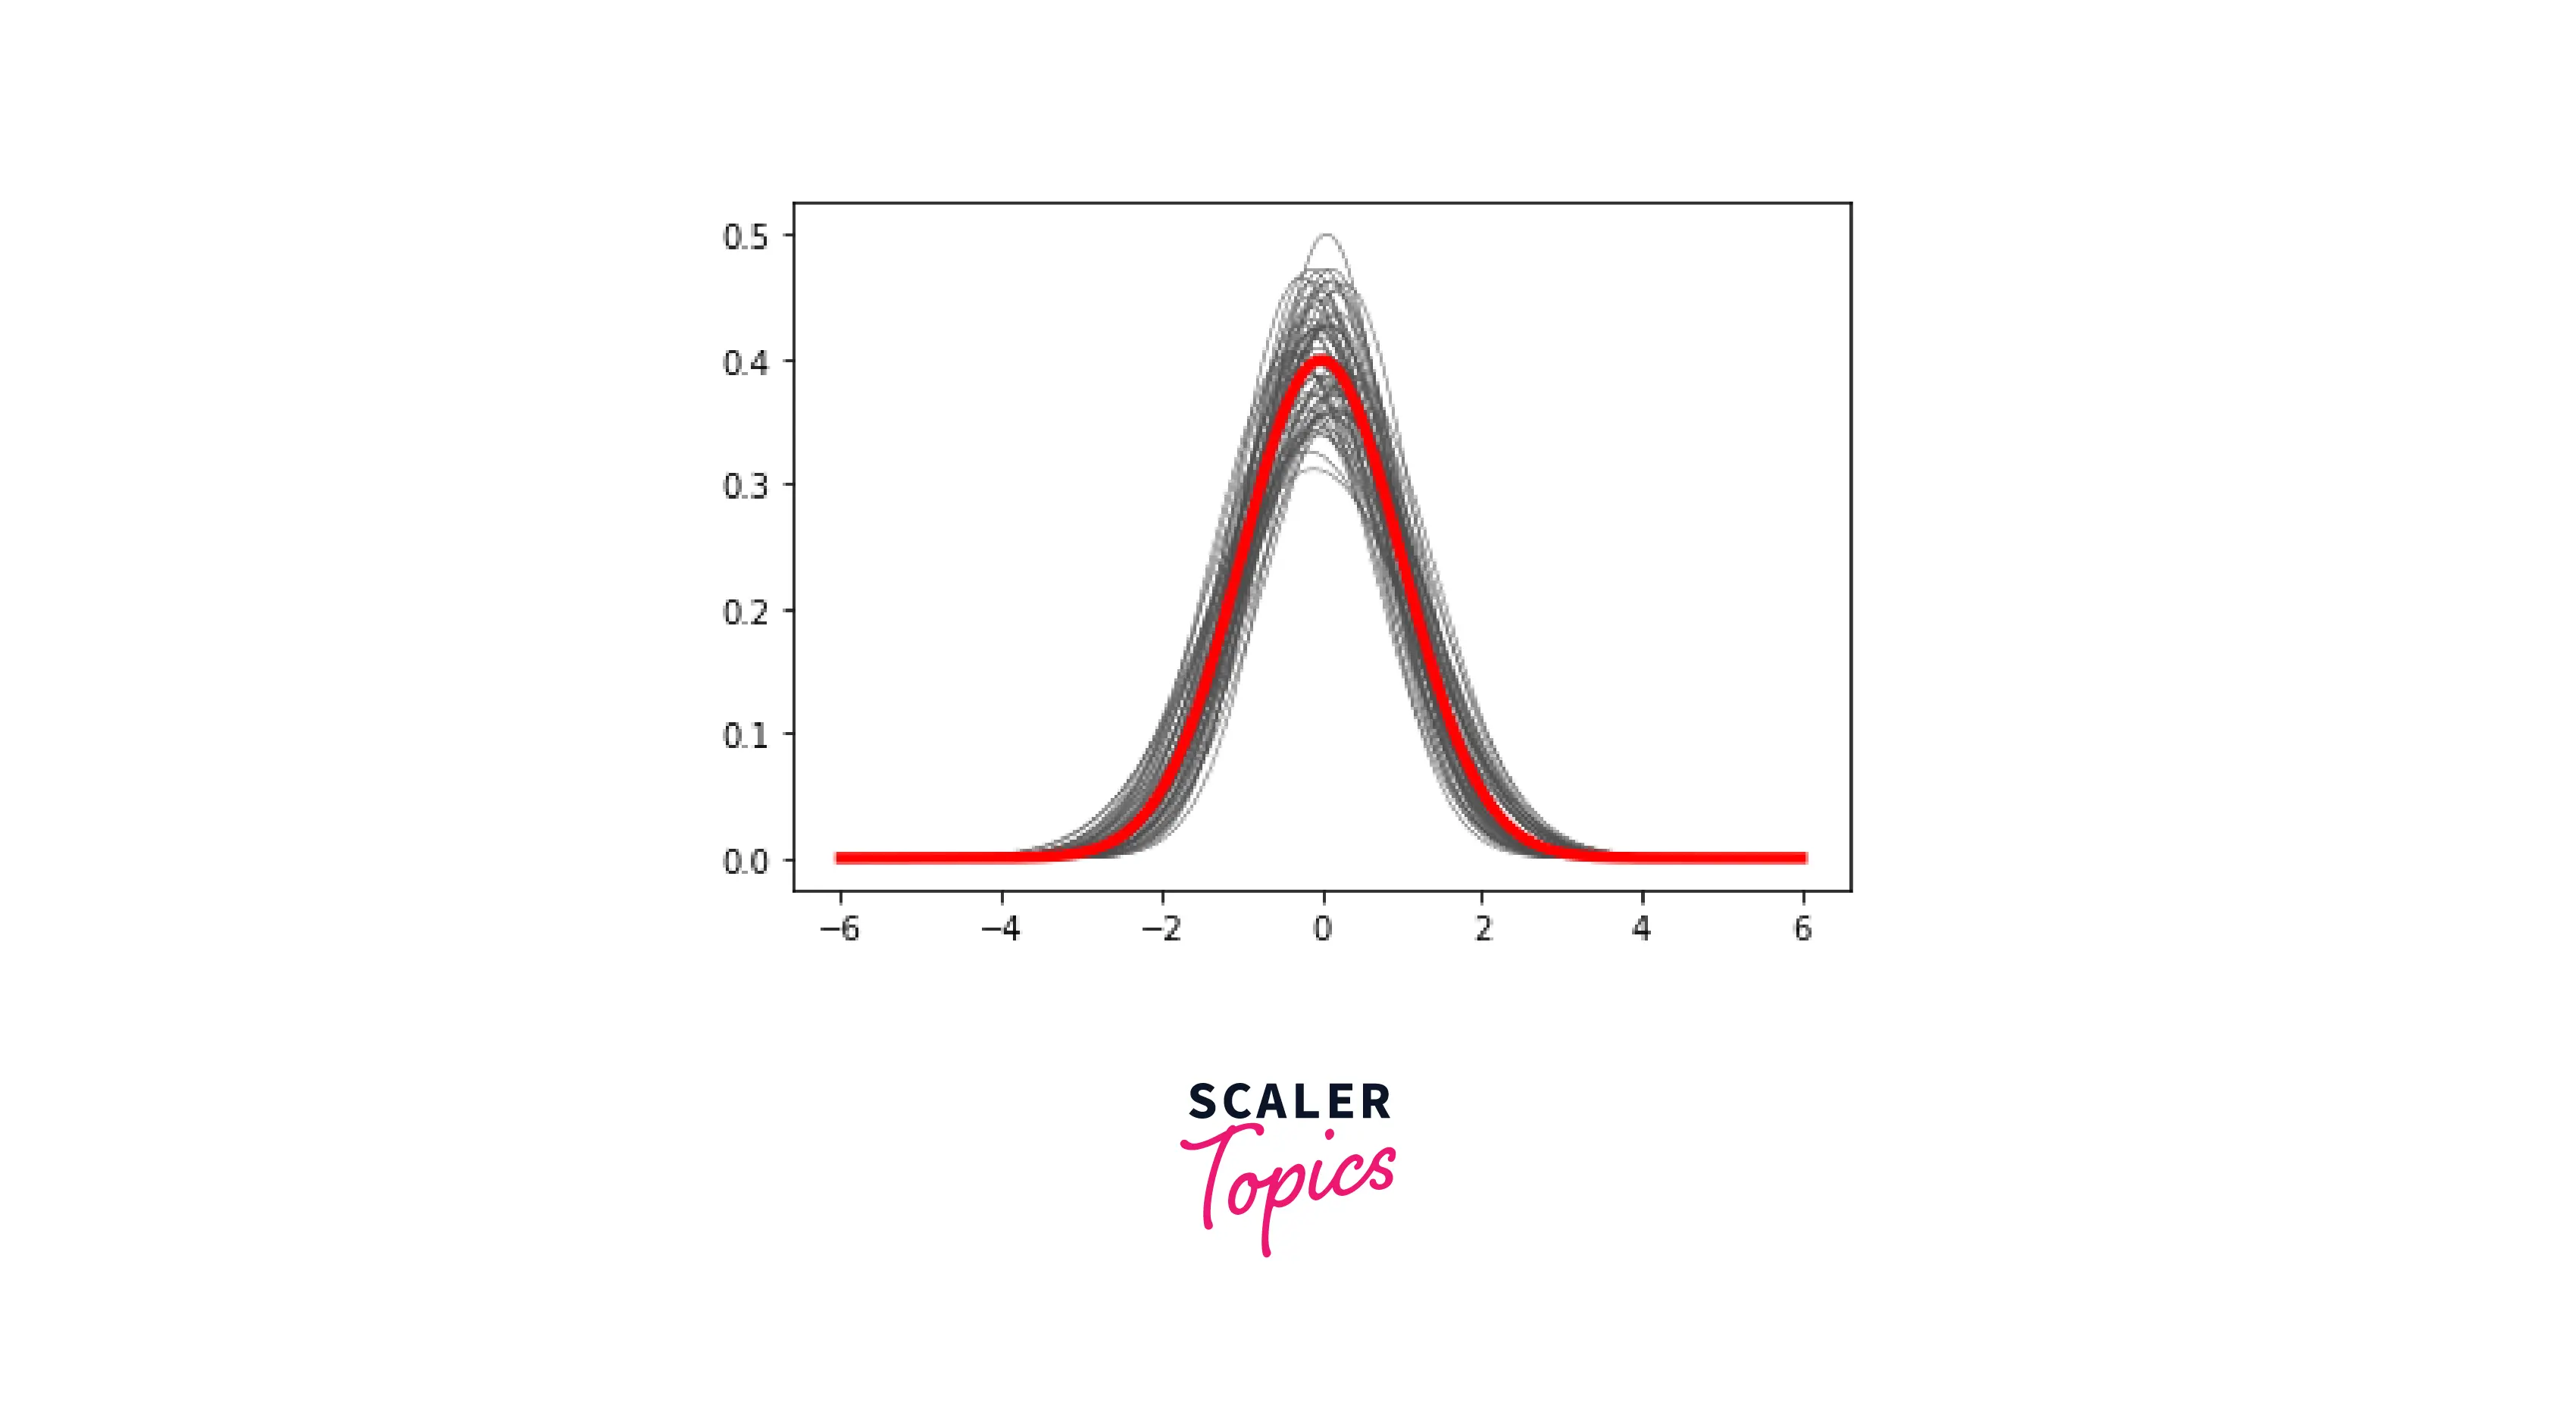
- Saving a Gaussian Distribution plot as a .PNG file:
Explanation
In this snippet, we plot a Gaussian distribution using NumPy and matplotlib. After that, we save it locally using the .savefig() function. This will help us save the matplotlib figure as .PNG file.

Output:
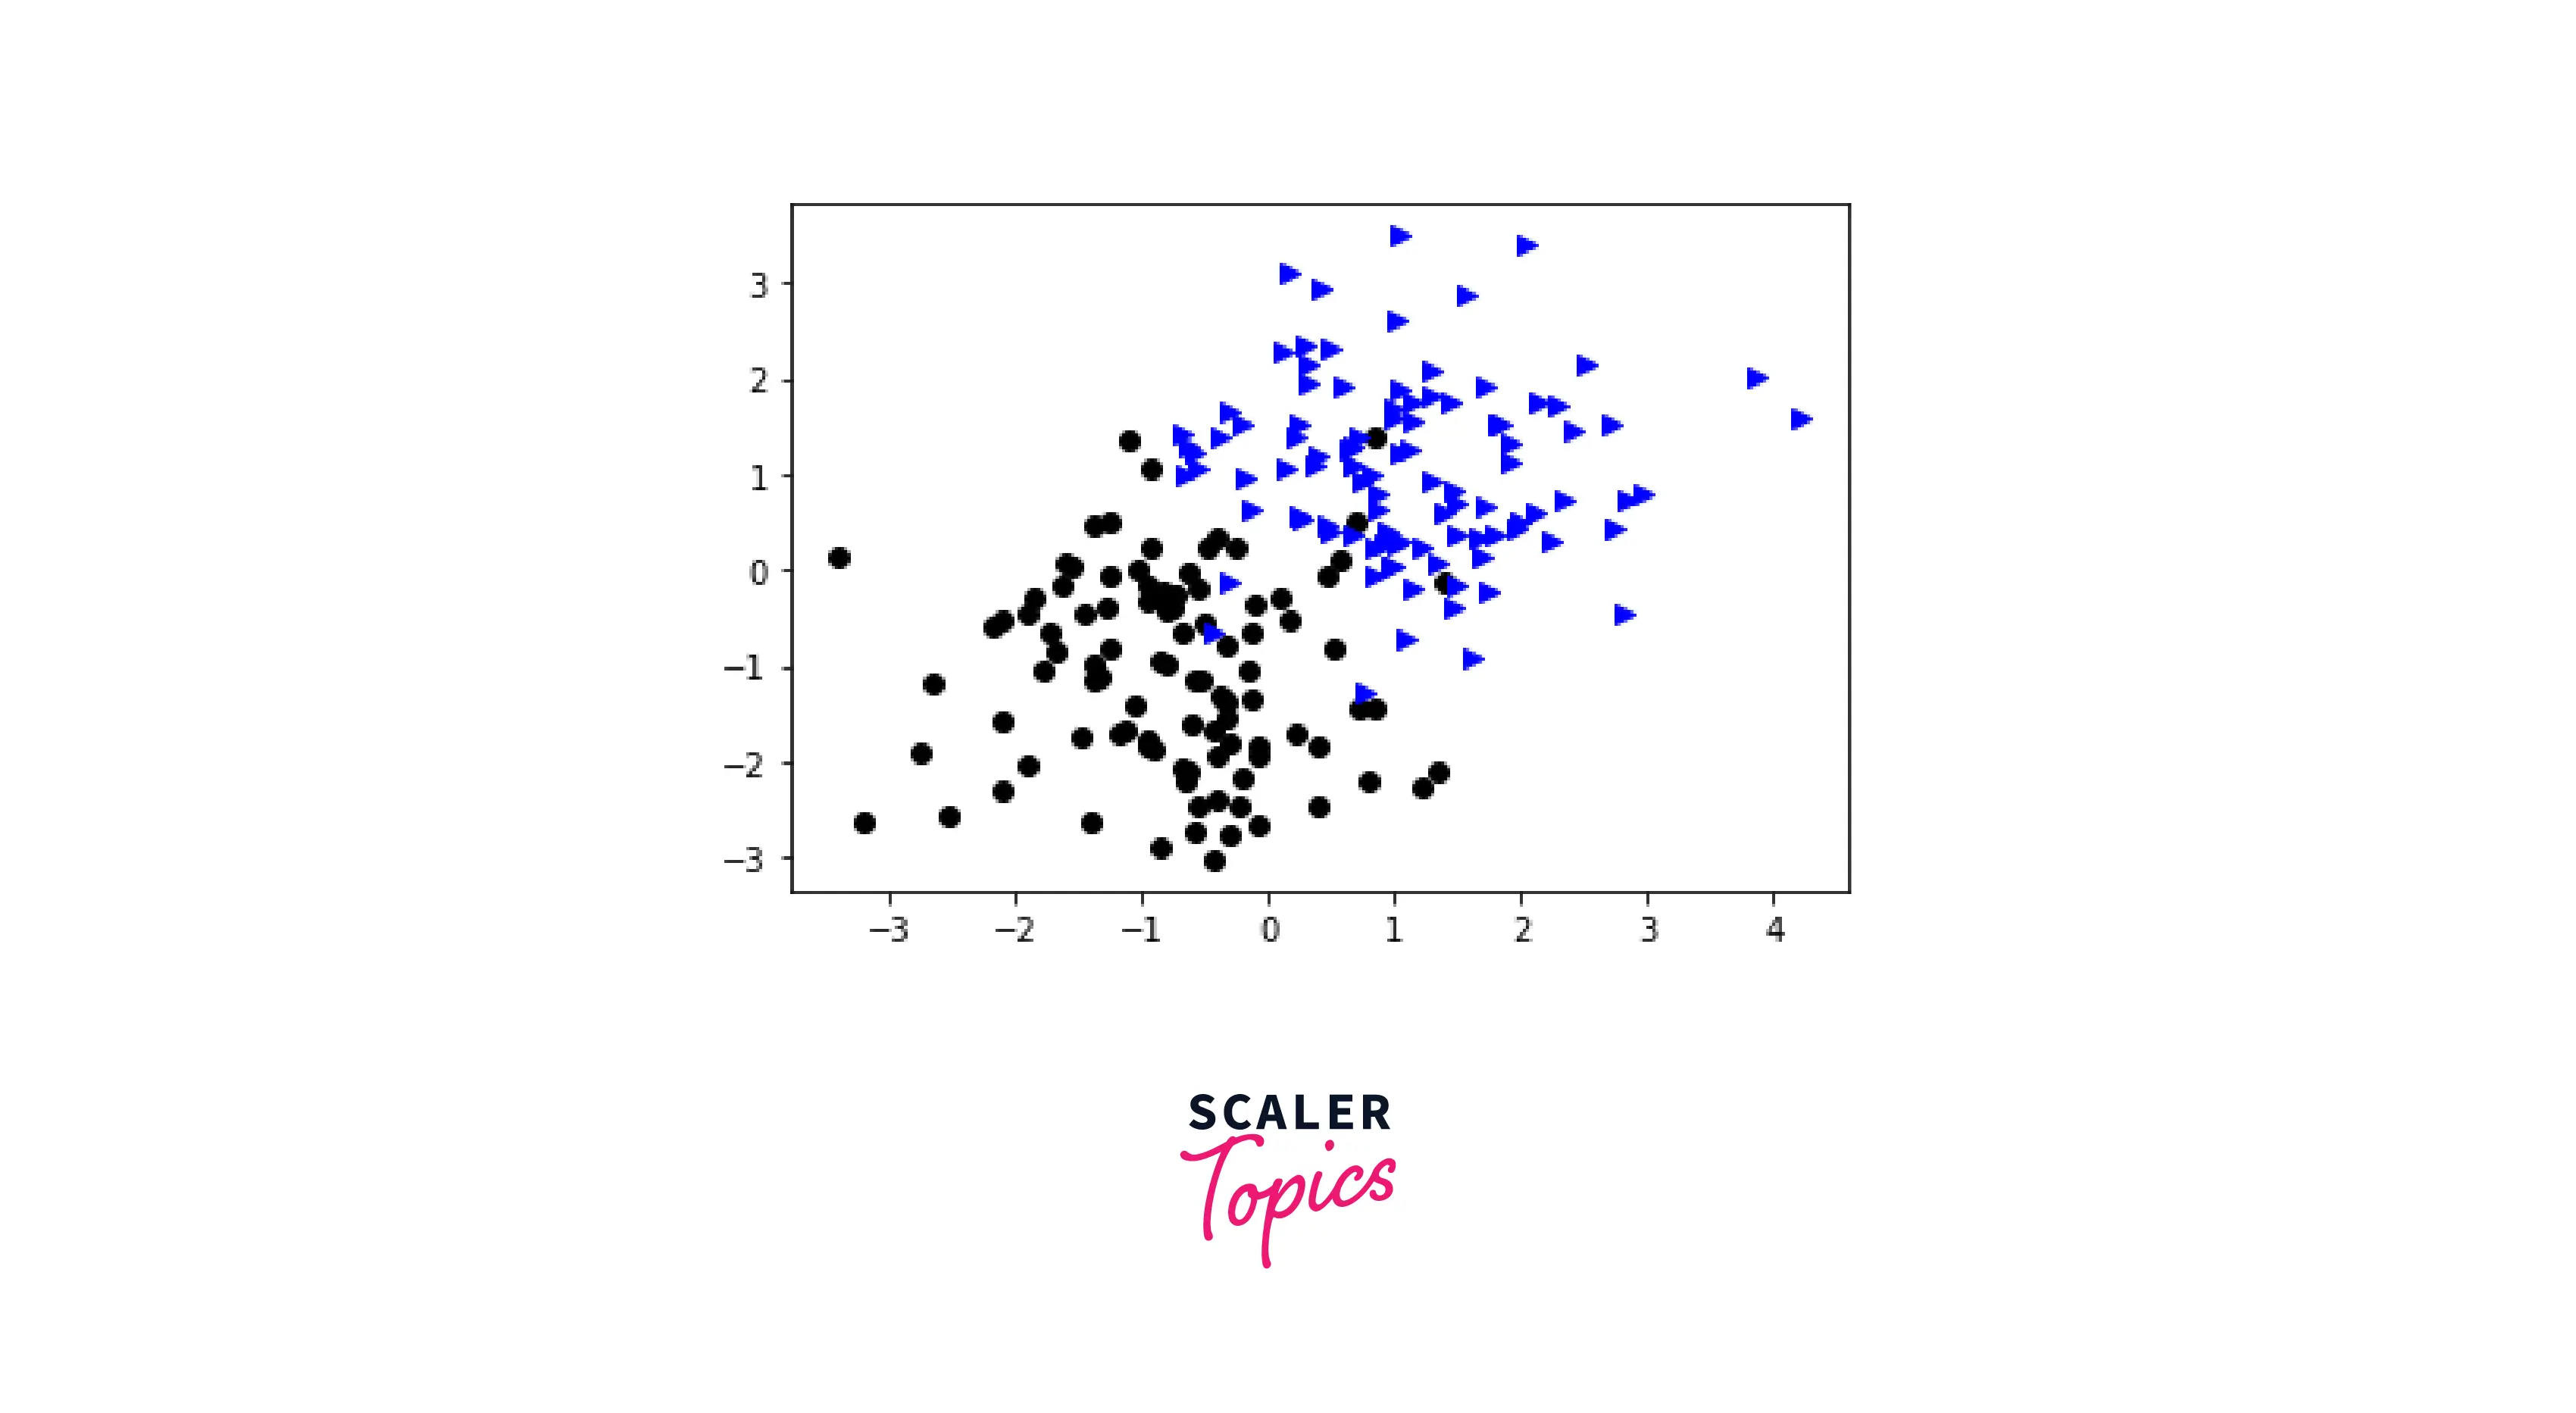
- Saving a scatter plot as a .PNG file
Explanation We created a sample scatter plot using random data points in this snippet. After creating the plot, we save it locally on our disk using the .savefig() function.

Output:
Check Out This Best Data Science Course that Takes You Beyond the Basics Explored in This Blog. Enroll Now and Fuel Your Passion for Learning.
Conclusion
To recap this article:
- We need to save our matplotlib figures as .PNG files, because they are not automatically saved on our disks.
- To save matplotlib figures as .PNG files, we have two functions; .savefig() and .imsave().
- We covered savefig(), the function used to convert our matplotlib figures as .png files, that will be saved in our local disk. We also covered it's parameters, like file-name and dpi(dots per inches).
- Apart from that, we also covered .imsave() function, another function that helps us convert inline plots to .png files. These files get stored in the local memory. Its parameters were also covered in-depth.