Visualizing a 2D Scalar Field
Overview
When it comes to data analytics, visualization is an essential part of it. Matplotlib is a library in Python that allows us to visualize a lot of data with state-of-the-art plots, shapes, and fields. From business insights to Physics visualizations, everything can be done in Matplotlib. This article will cover various ways of visualizing 2D Scalar Fields in Matplotlib.
Transform Your Career
Choose from our industry-leading programs designed for career success
Modern Software and AI Engineering Program
Master full-stack development with AI integration

Modern Data Science and ML with specialisation in AI
Advanced data science techniques with AI specialization
Advanced AIML with Specialisation in Agentic AI
Deep dive into AIML with focus on Agentic systems
DevOps, Cloud & AI Platform Engineering
Build and manage AI-powered cloud infrastructure
AI Engineering Advanced Certification by IIT-Roorkee
Premier AI engineering certification from IIT-Roorkee
Introduction
As discussed earlier, we can visualize a lot of things using Matplotlib. In this article, we will understand how to visualize scalar fields. The scalar field is a very popular and sought-after topic in Computational Physics.
Simply put, a scalar field is a region of space where each point has a unique numerical value. Every point in a scalar field has a scalar value.
Scaler Placement Report and Statistics
Scaler learners achieved 2.5x salary growth with average post-Scaler CTC reaching ₹23L.
How to Visualize a 2D Scalar Field
Matplotlib and Numpy offer interesting mechanisms that help us visualize 2d scaler fields. In this section, we will learn how to plot a 2d scalar field using NumPy and Matplotlib.
We will generate some sample data to create our 2d field based on the sample data. To generate samples of a 2D field, we use the meshgrid() function offered by NumPy.
Syntax
Turn Learning into Career Growth
Parameters
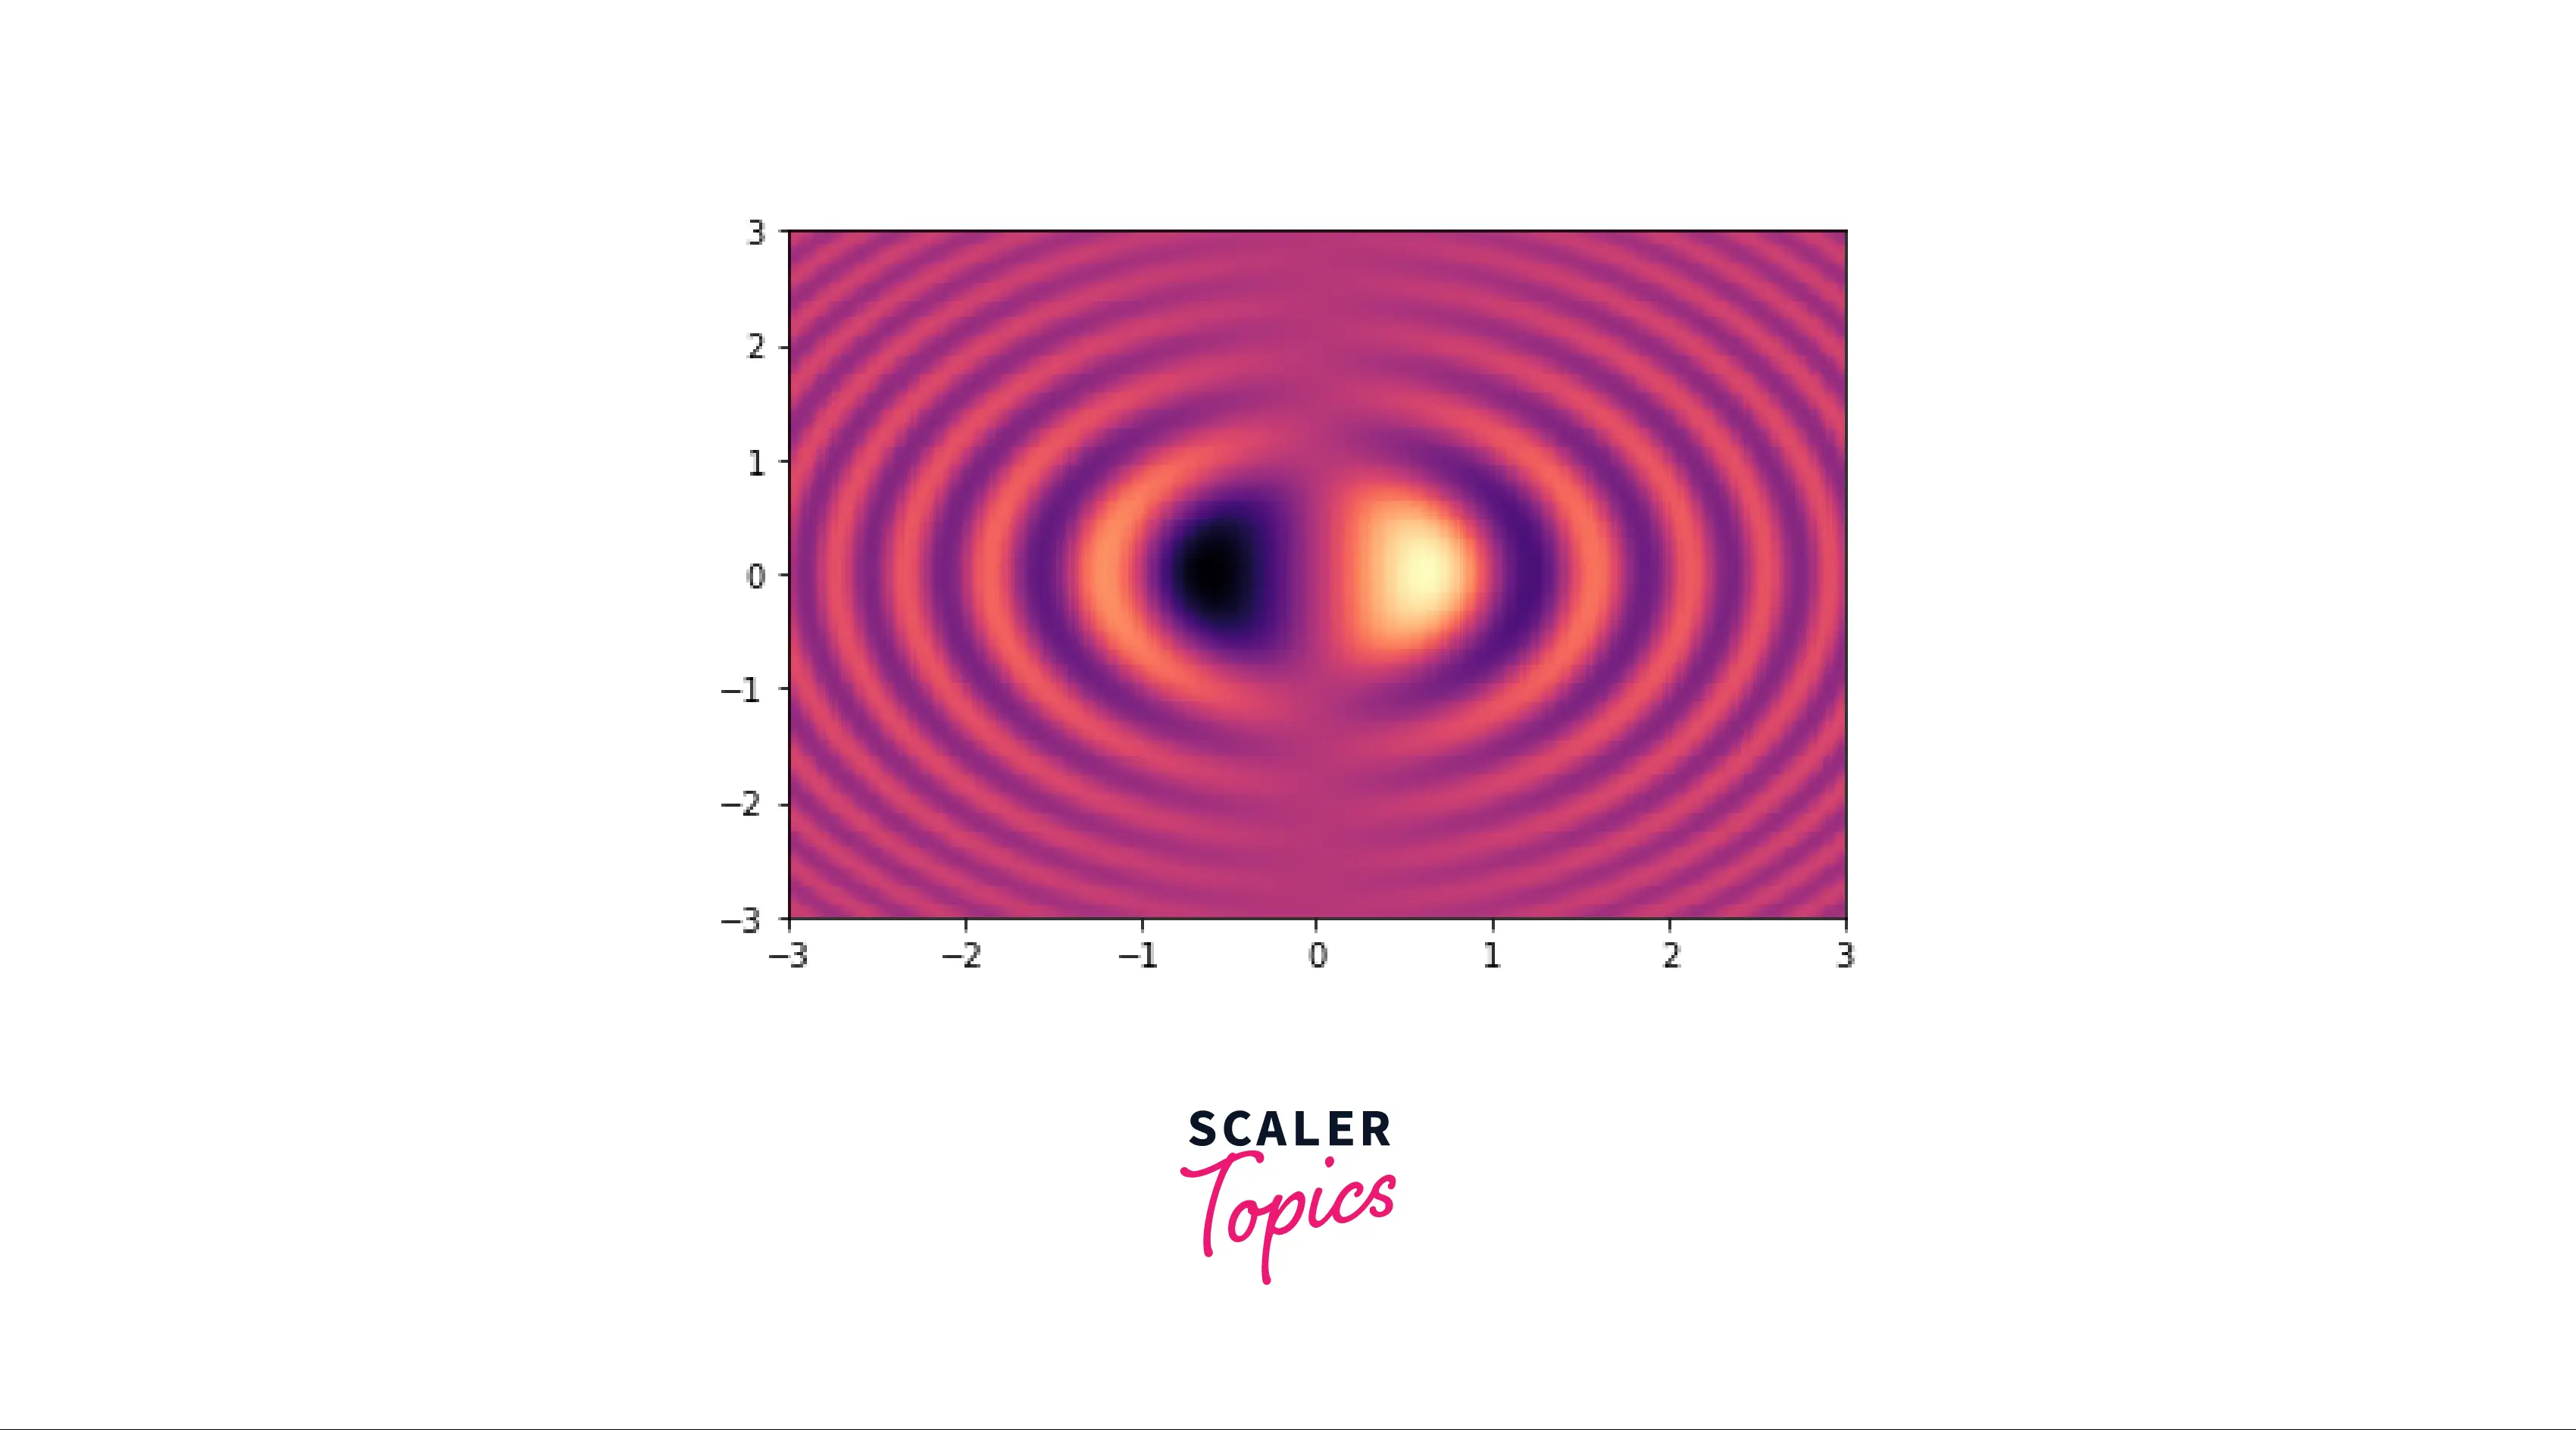
X: The x-coordinate of the mesh grid. Y: The y-coordinate of the mesh grid. After we generate the mesh grid, we have to create a third array Z, which will help to convert our two fields to a scalar field. To render and display our 2D scalar field, we will use the pcolormesh() function available in Matplotlib.
Output:
Examples
We will cover more examples to solidify your knowledge in plotting 2D scalar fields using Matplotlib!
Plotting a Vector Field
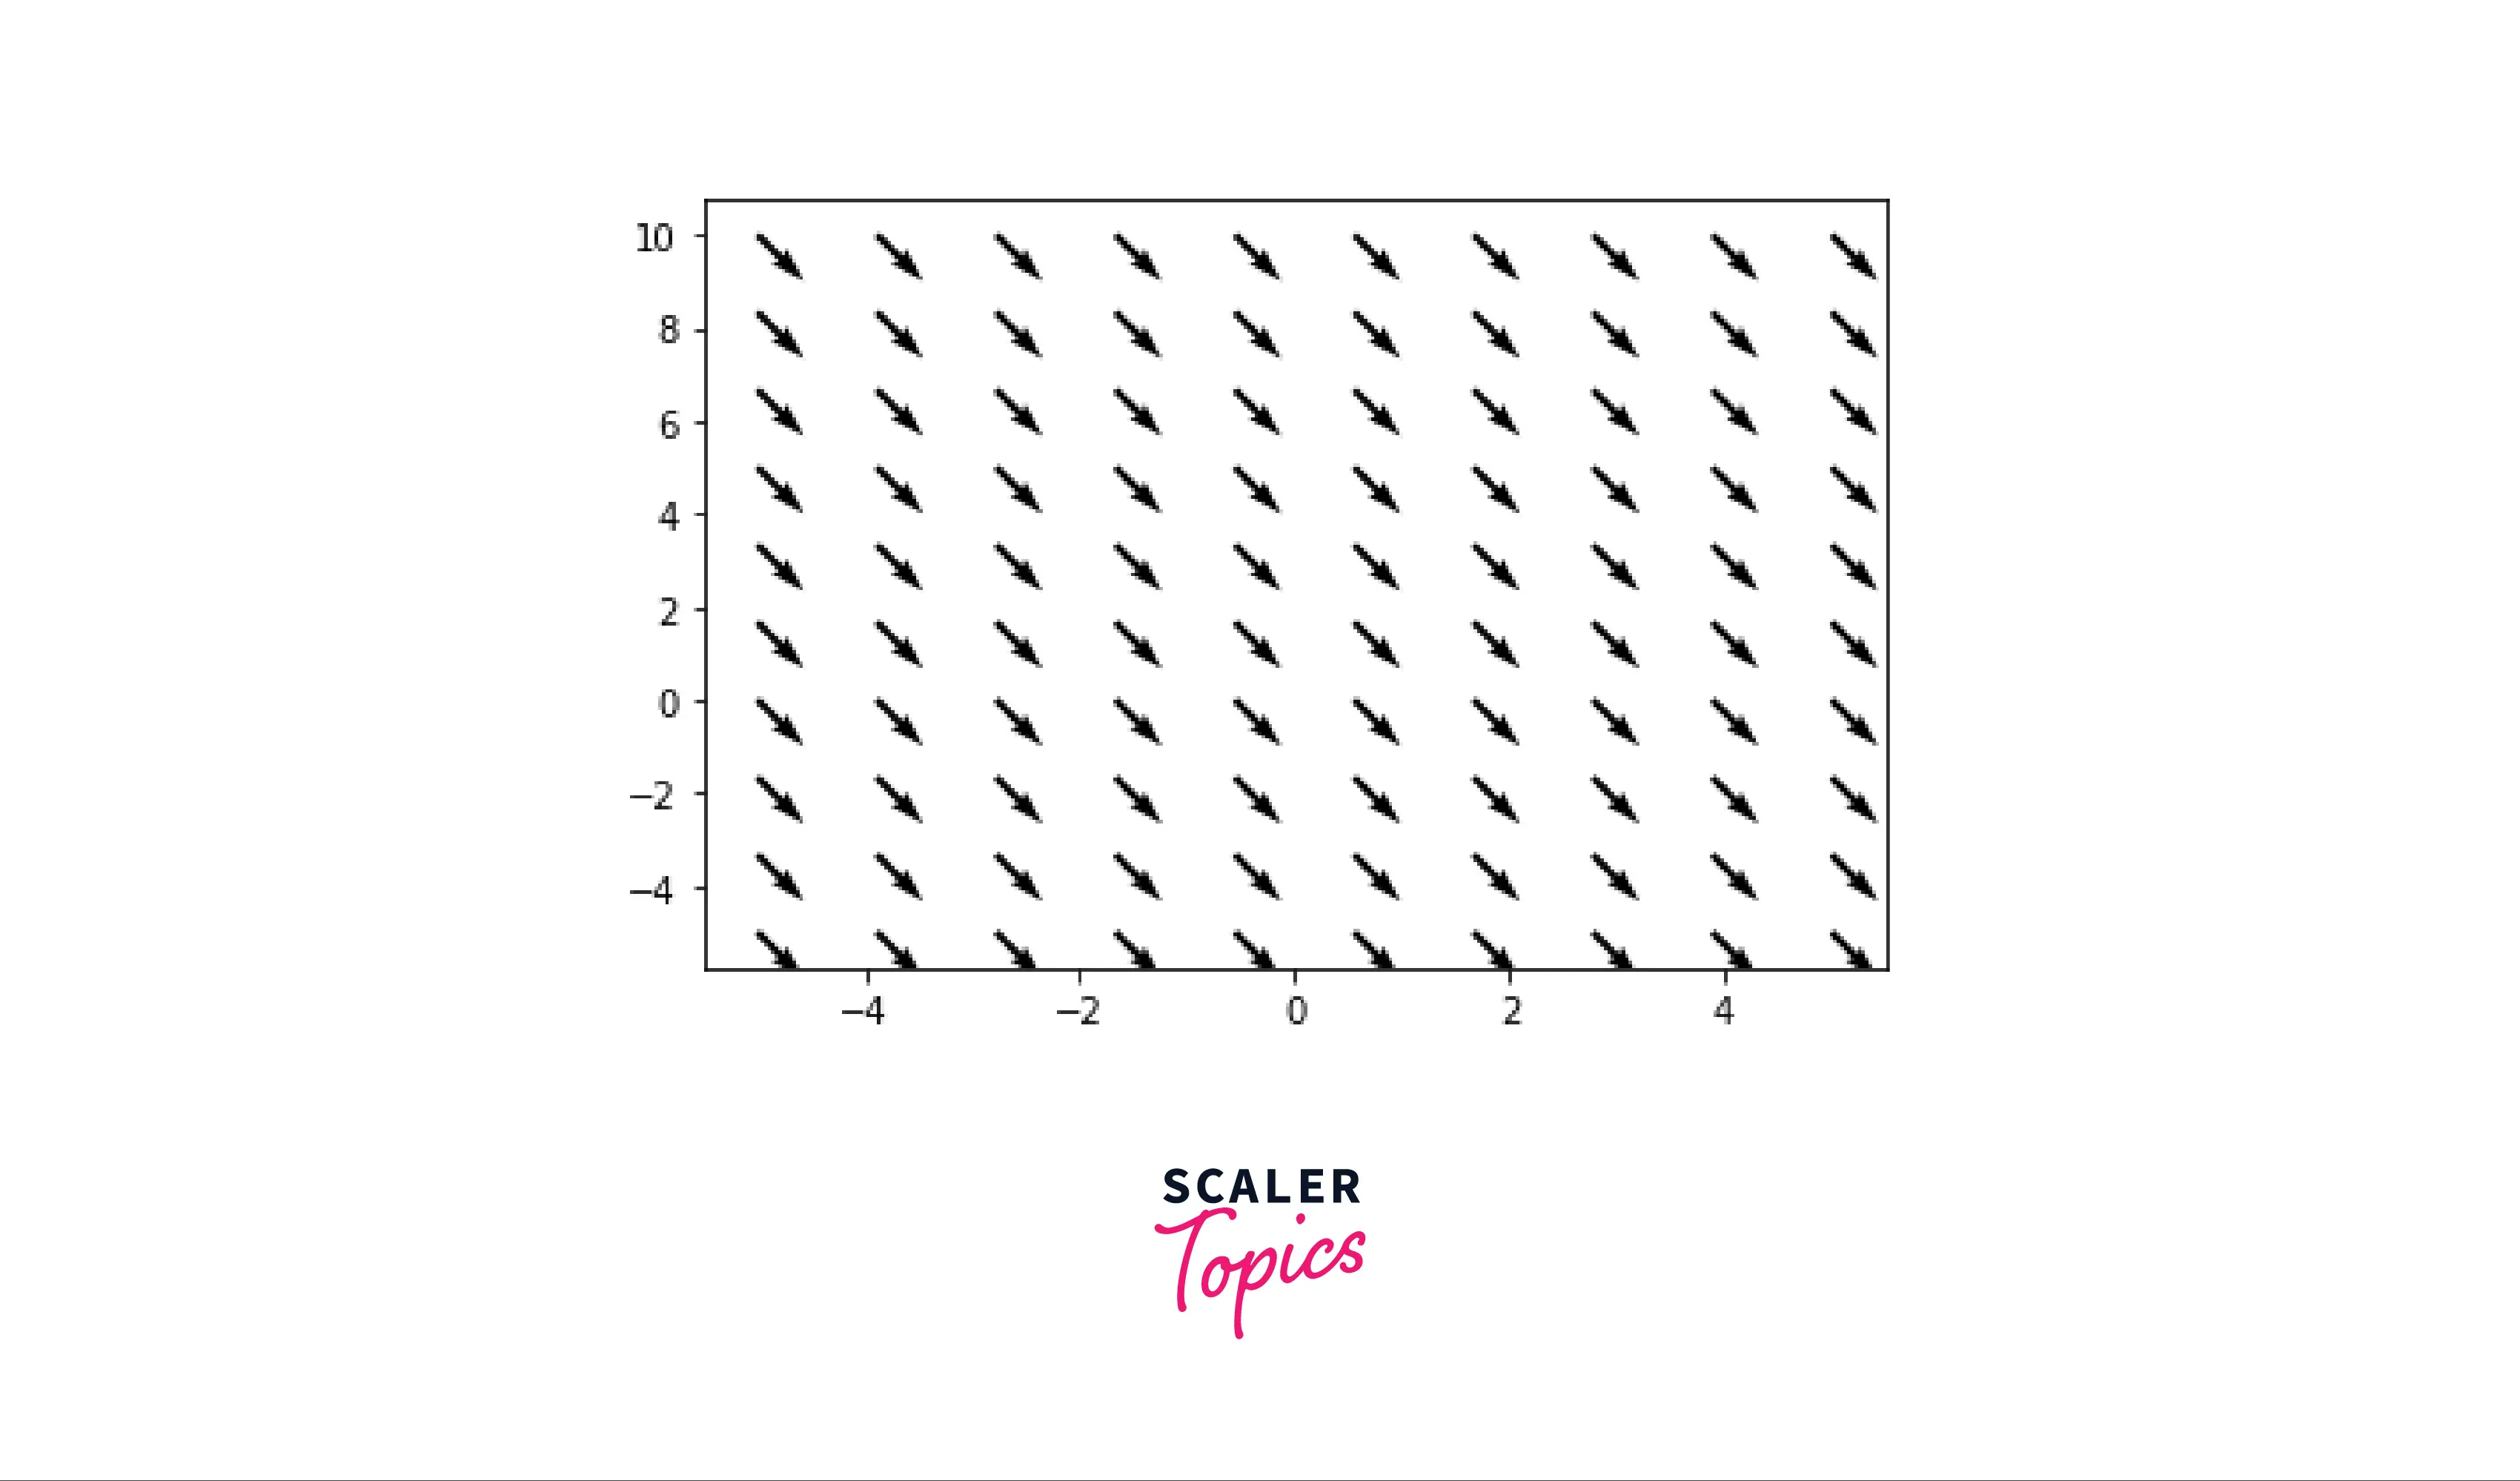
A vector field is the allocation of a vector to each point in a subset of space in the fields of vector calculus and physics. For example, we can consider a field in a plane with a collection of arrows with a given magnitude and direction to visualize a vector field.
These fields are usually utilized to model concepts like the speed and direction of fluid throughout space or the direction and magnitude of magnetic or gravitational forces etc.
Output:
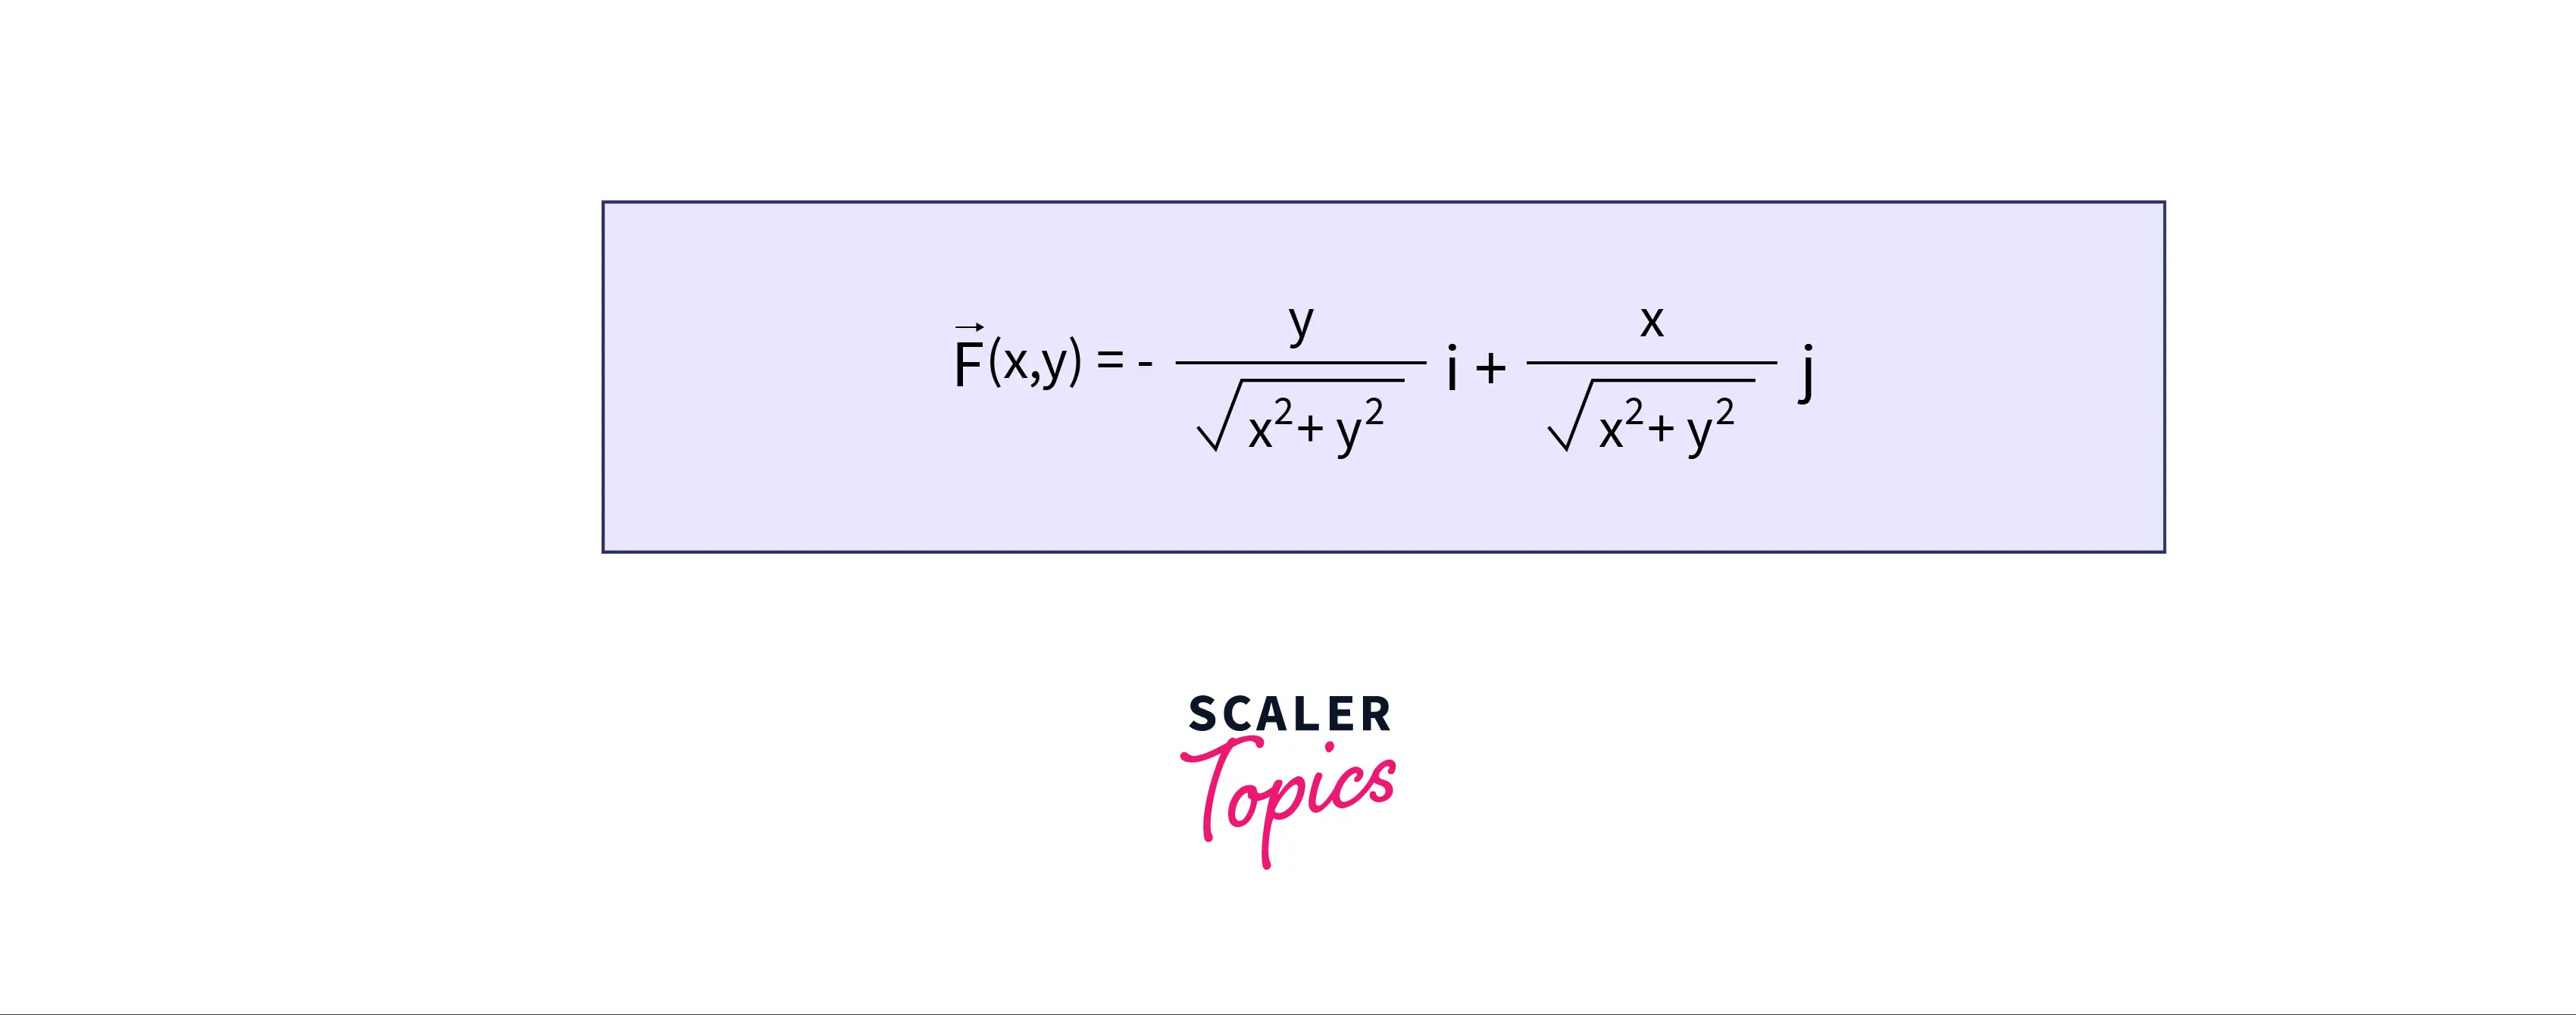
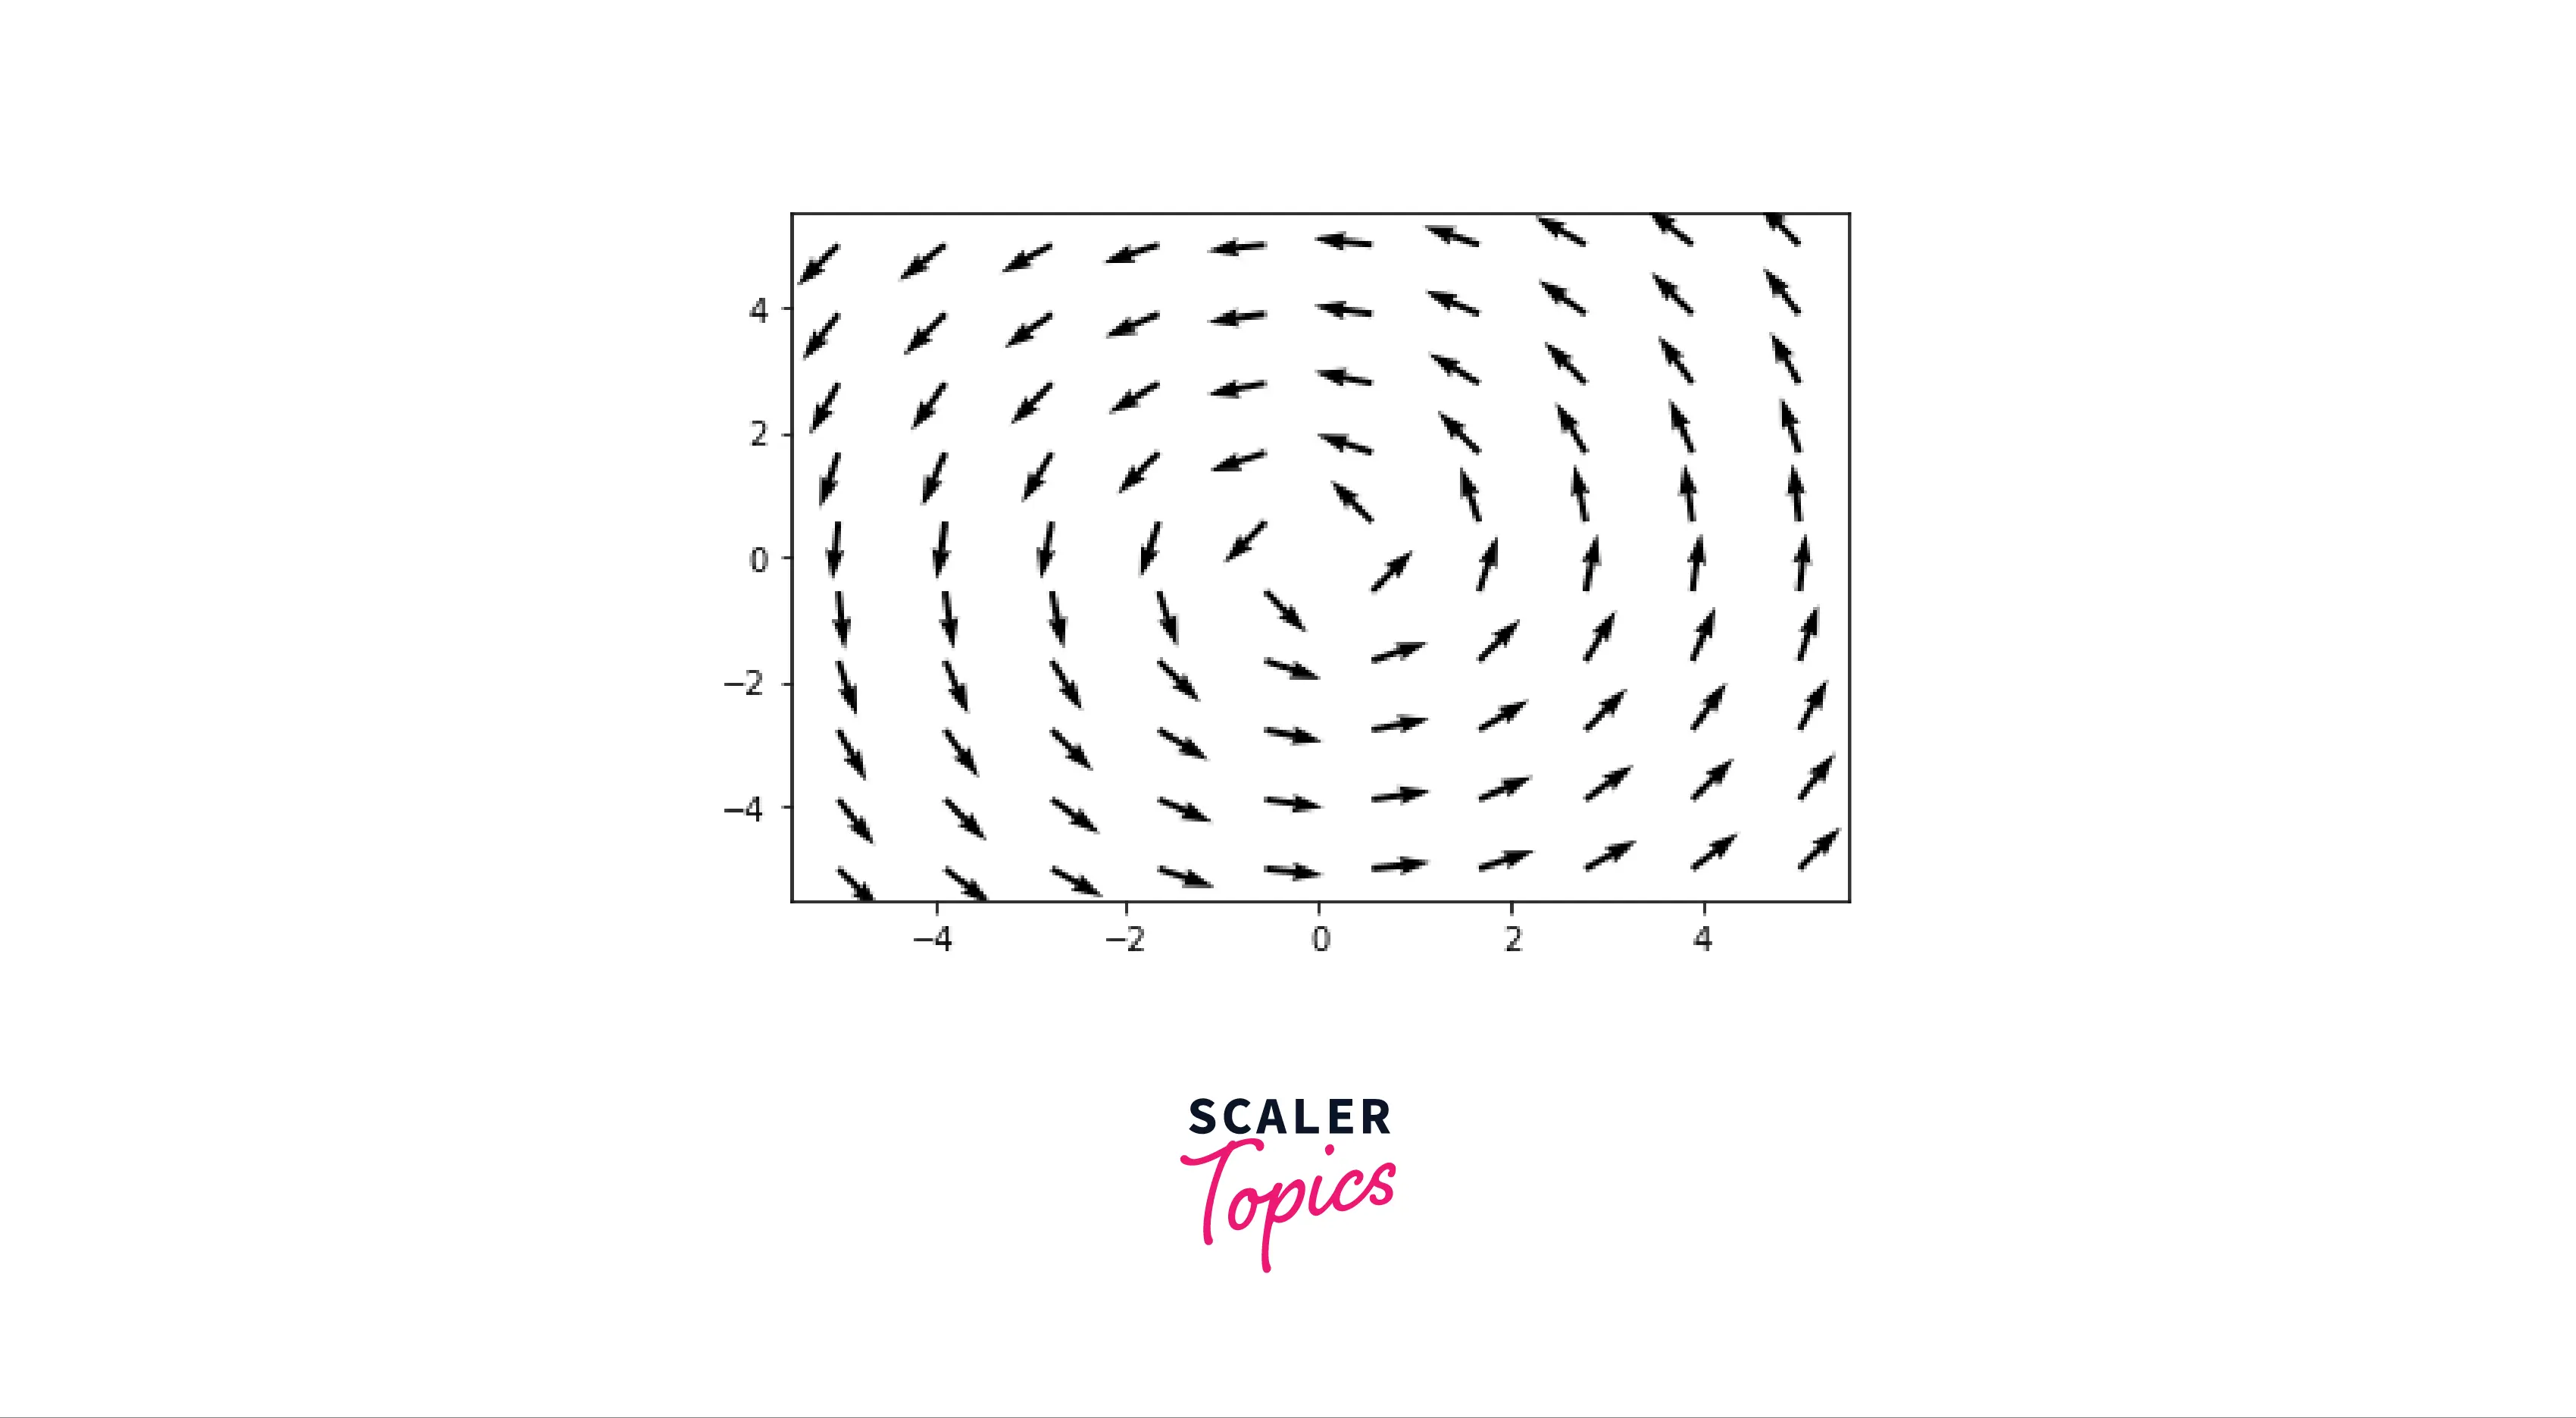
In the next example, we will try to plot a vector field of the following equation:
Output:
Conclusion
- This article covered the basics of fields and their application in Computational Physics.
- We understood what a Scalar Field is; a region of space where each point has a unique numerical value.
- Apart from this, we also covered creating a 2D scalar field in Matplotlib using meshgrid() and pcolormesh().
- To conclude, we were able to plot some vector fields using the concepts we learned in this article.