Important Pandas Functions for Exploratory Data Analysis
Overview
The pandas library offers numerous intuitive methods that can be successfully applied for exploratory data analysis. EDA is an important step in any data science project. It helps grasp the size and structure of the data, identify the critical variables and potential issues with them, explore the statistics of the data, find the correlation between different columns, and discover hidden patterns in the data for further investigation. EDA in pandas allows running a few lines of simple code to efficiently solve all these tasks and more.
Introduction to Exploratory Data Analysis
Exploratory data analysis (EDA) is a vital initial step of any data analysis or machine learning project. It is necessary for:
- getting an overall understanding of the data, including first insights
- identifying the size of the dataset, its structure, and the features that are crucial for the project goal
- gathering fundamental statistics of the data
- detecting potential issues to fix (such as missing values, duplicates, or outliers)
The pandas library is the most popular Python package for conducting data wrangling and data analysis. It offers a vast spectrum of analytical tools and methods to explore the data from all angles. Performing EDA in pandas is an easy task because of the intuitive names and syntaxes of its functions, their flexibility, and comprehensive library documentation.
EDA Functions in Pandas
Let us take a look at the essential methods that allow for conducting fast and efficient EDA in pandas. Note that some of those functions are applicable only for data frames, others – only for series, and others – for both. In the context of EDA in pandas, we usually talk about a series object as an individual column of a dataframe.
head() and tail()
By default, the head() method returns the first five and tail() – the last five rows of a dataframe or a series. To return the number of rows different from five, we need to pass in that number.
sample()
By default, it returns a random row of a dataframe or a series. To return a certain number of random rows, we need to pass in that number.
shape
For a dataframe, it returns a tuple with the number of rows and columns. For a series, it returns a one-element tuple with the number of rows.
size
Returns the number of elements in a dataframe or a series. For a series object, it makes more sense to use size rather than shape. The obtained information is the same in both cases, but size returns it in a more handy form – as an integer rather than a one-element tuple.
Transform Your Career
Choose from our industry-leading programs designed for career success
Modern Software and AI Engineering Program
Master full-stack development with AI integration

Modern Data Science and ML with specialisation in AI
Advanced data science techniques with AI specialization
Advanced AIML with Specialisation in Agentic AI
Deep dive into AIML with focus on Agentic systems
DevOps, Cloud & AI Platform Engineering
Build and manage AI-powered cloud infrastructure
AI Engineering Advanced Certification by IIT-Roorkee
Premier AI engineering certification from IIT-Roorkee
info()
Returns overall information about a dataframe, including the index data type, the number of rows and columns, column names, indices, and data types, the number of non-null values by column, and memory usage.
describe()
Returns the major statistics of a dataframe or a series, including the number of non-null values, the minimum, maximum, and mean values, and percentiles. For a dataframe, it returns the information by column, and by default, only for numeric columns. To include the statistics for the columns of an object type as well, we need to pass in include='all'. For object columns, the method returns the number of non-null values, the number of unique values, the most frequent value, and the number of times it is encountered in the corresponding column.
dtypes
Returns the data types of a dataframe by column. If a column contains mixed data types or if all its values are None, the returned data type of that column will be an object. This also includes a special case of a column containing booleans and null (NaN) or None values.
For a series, we can interchangeably use either dtypes or dtype for EDA in pandas.
select_dtypes()
Returns a subset of the columns of a dataframe based on the provided column data type (or types). We have to specify the data type (or types) either to include into the subset (using the include parameter) or exclude from it (exclude).
Some typical data types are number, int, float, object, bool, category, and datetime. To specify several data types to include or exclude, we pass in a list of those data types.
Scaler Placement Report and Statistics
Scaler learners achieved 2.5x salary growth with average post-Scaler CTC reaching ₹23L.
columns
Returns the column names of a dataframe.
count()
Returns the count of non-null values in a dataframe or a series. For a dataframe, by default, returns the results by column. Passing in axis=1 or axis='columns' will give the results by row.
unique() and nunique()
The unique() method returns the unique values of a series, while nunique() – the number of unique values in a dataframe or a series.
For a dataframe, nunique(), by default, returns the results by column. Otherwise, passing in axis=1 or axis='columns' will give the results by row.
is_unique
Returns True if all the values in a series are unique.
Turn Learning into Career Growth
isnull() and isna()
Both methods return a boolean same-sized object showing which values are null (True) and which are not (False). These functions apply to both series and dataframes.
isnull() and isna() work best when chained with sum() (e.g., df.isnull().sum()) returning the number of null values by column for a dataframe or their total number for a series. For a dataframe, the method chaining df.isnull().sum().sum() gives the total number of null values.
Scaler Placement Report and Statistics
Scaler learners achieved 2.5x salary growth with average post-Scaler CTC reaching ₹23L.
hasnans
Returns if a series contains at least one null value.
value_counts()
Returns the count of each unique value in a series. By default, the outputs are not normalized, or sorted in descending order, and the null values are not considered. To override the defaults, we can set the optional parameters normalize, ascending, and dropna accordingly.
nsmallest() and nlargest()
By default, nsmallest() returns the five smallest while nlargest() – the five largest values of a series together with their indices. To return the number of values different from five, we need to pass in that number.
is_monotonic_increasing and is_monotonic_decreasing
The first method returns True if the values of a series are monotonically increasing, and the second – if they are decreasing.
corr()
This method of EDA in pandas applies both to dataframes and series, but in a slightly different way. For a dataframe (df.corr()), it returns column pairwise correlation, excluding null values. For a series (Series1.corr(Series2)), this method returns the correlation of that series with another one, excluding null values.
plot()
Allows the creation of simple plots of various kinds for a data frame or a series. The main parameters are x, y, and kind. The popular types of supported plots are line, bar, barh, hist, box, area, density, pie, and scatter.
In general, pandas are not the best choice for creating compelling visualizations in Python. However, for the purposes of EDA in pandas, the plot() method works just fine.
Examples
To see how EDA in pandas works in real life, let's put some of the above functions into practice and use them on a dataset from Kaggle – Data Science Job Salaries.
Code:
Output:
Code:
Output:
Code:
Output:
Code:
Output:
Code:
Output:
Code:
Output:
Code:
Output:
Code:
Output:
Code:
Output:
Code:
Output:
Code:
Output:
Code:
Output:
Code:
Output:
Code:
Output:
Code:
Output:
Let us collect the most interesting insights from EDA in pandas that we conducted above:
- There are 607 rows and 11 columns in the dataframe.
- No missing values.
- All the columns are valid and relevant for investigating data science job salaries and their major influencing factors.
- The columns are of two data types: object and integer. It may be unexpected to see that the company_size column is of an object type. However, checking the unique values of the company_size column, we see the explanation: the companies are S, M, and L, meaning small, medium, and large.
- The data is related to 2020-2022. The years in the dataset are given in order.
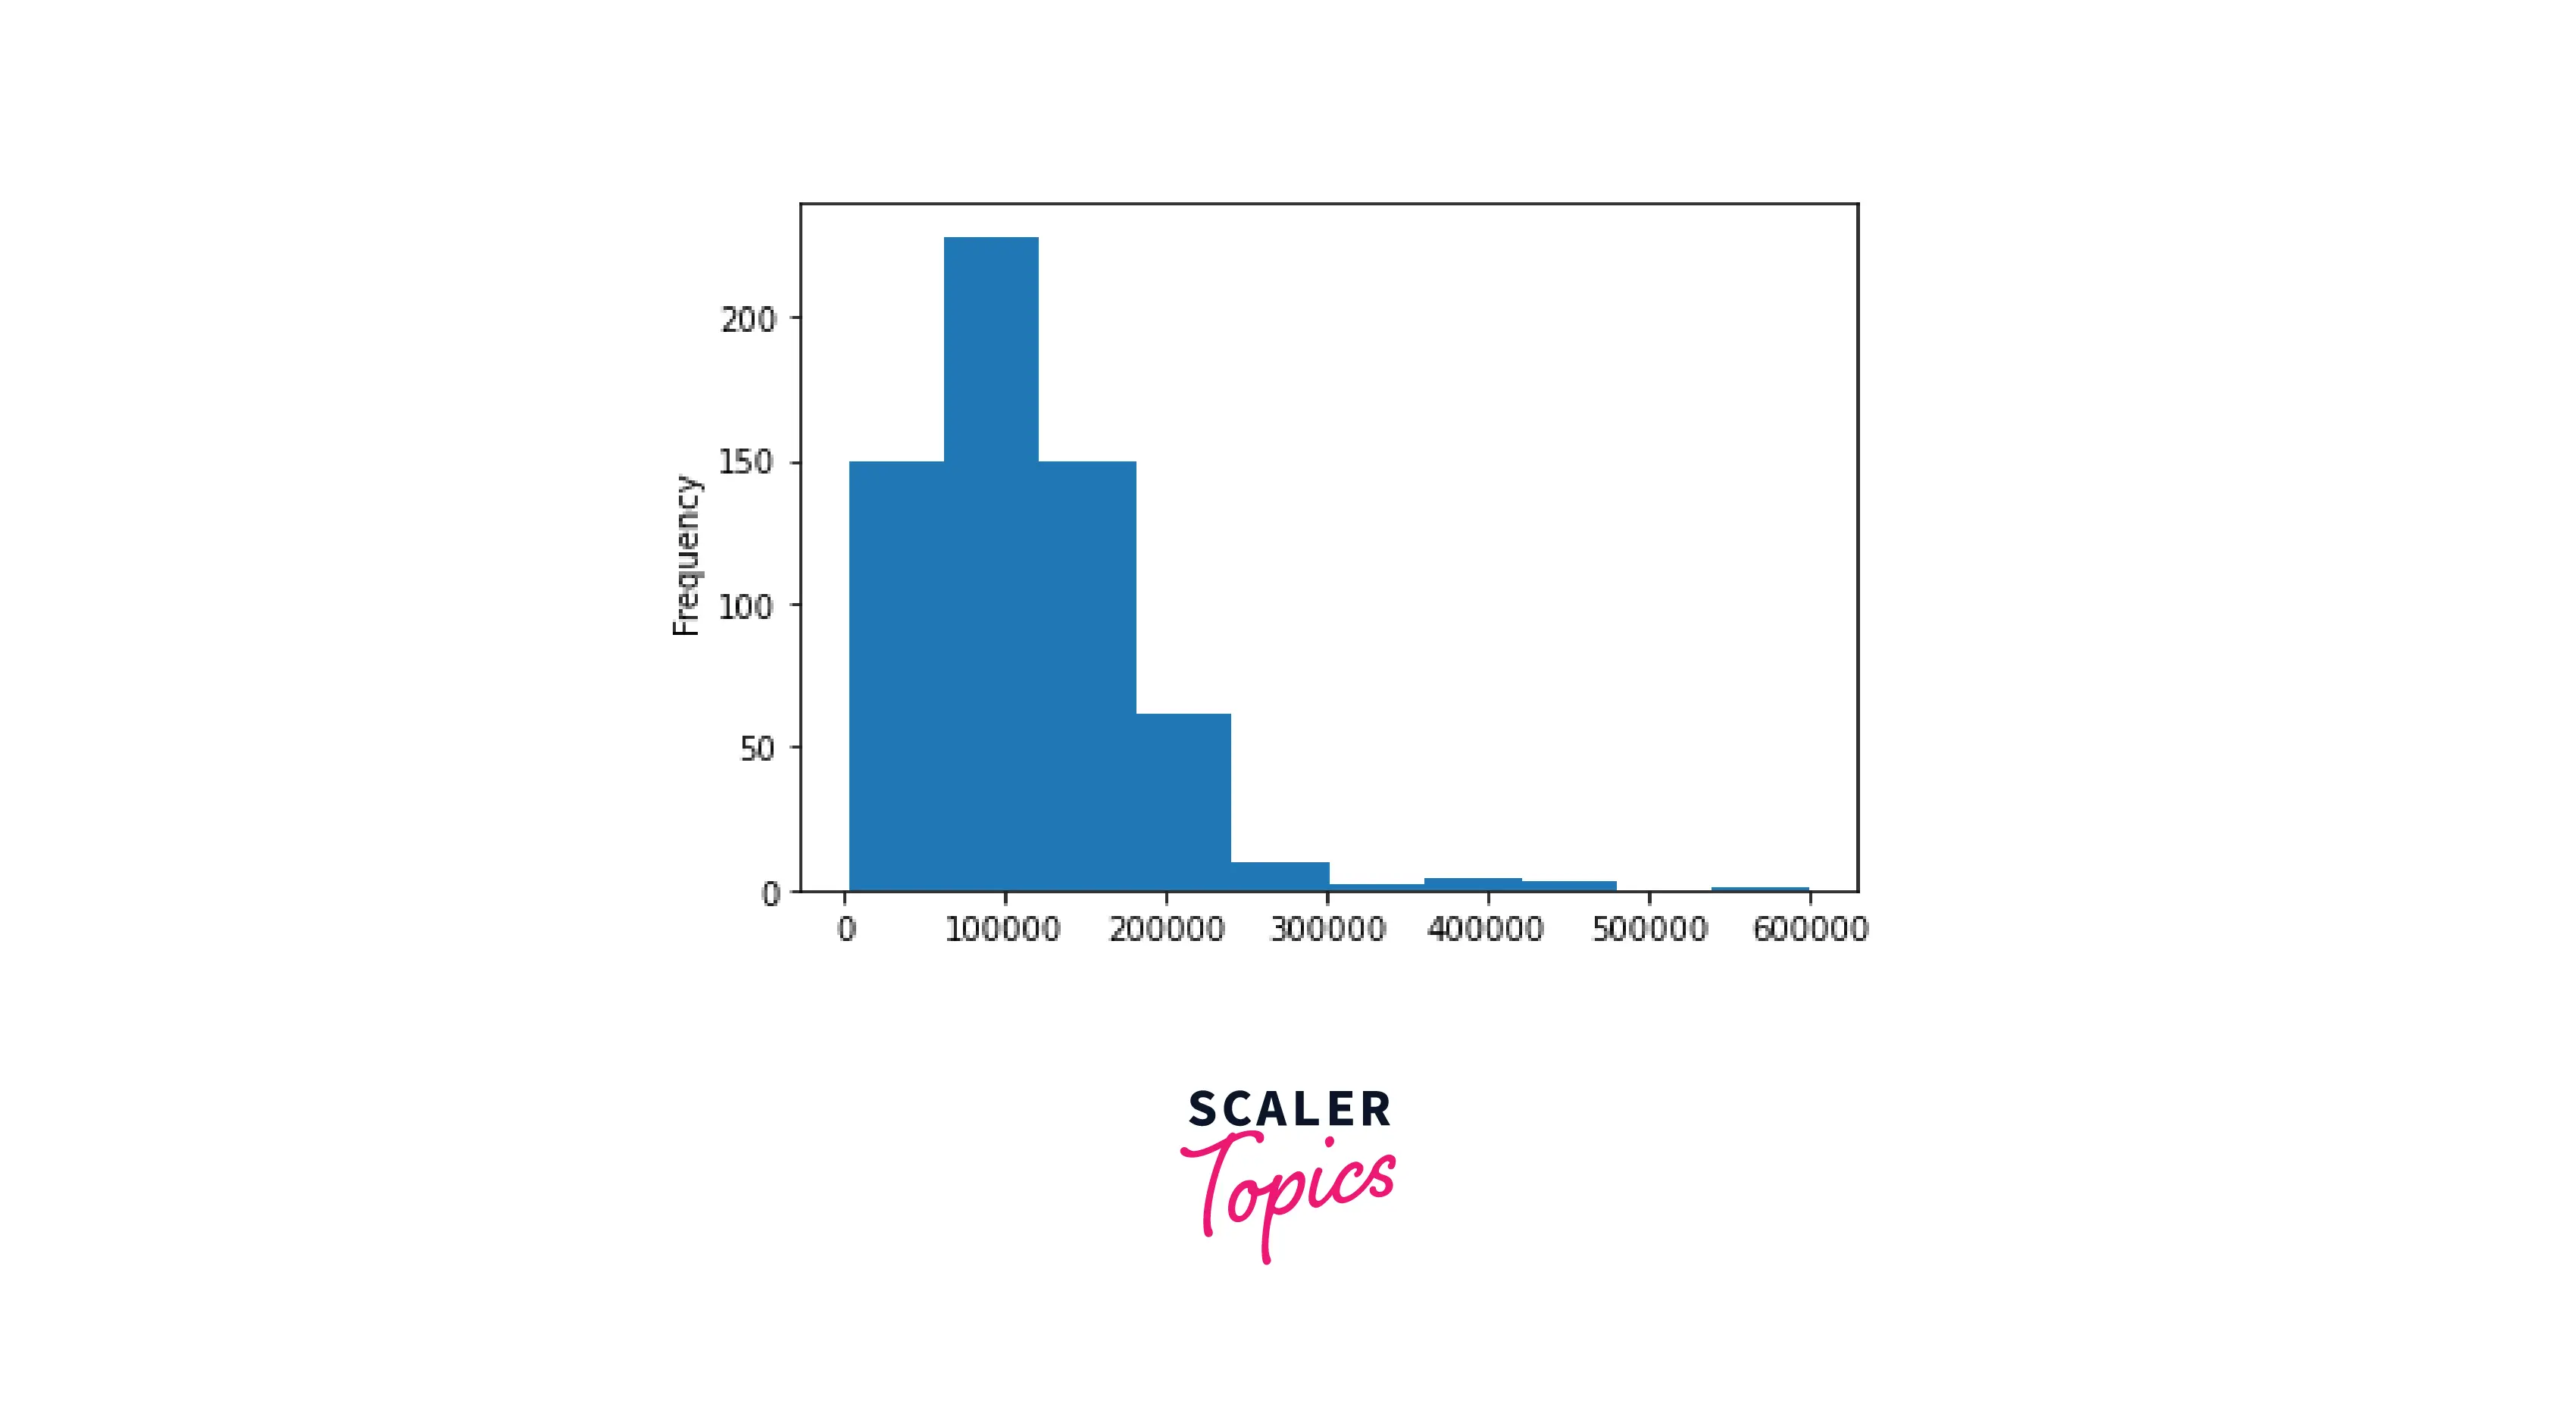
- The mean salary in USD is 112,298. The distribution seems to be rather skewed, though, ranging from 2,859 to 600,000.
- There are 50 unique data science job titles in the table.
- The most typical employment type for data science jobs is full-time employment (97%), and the least typical – is freelance.
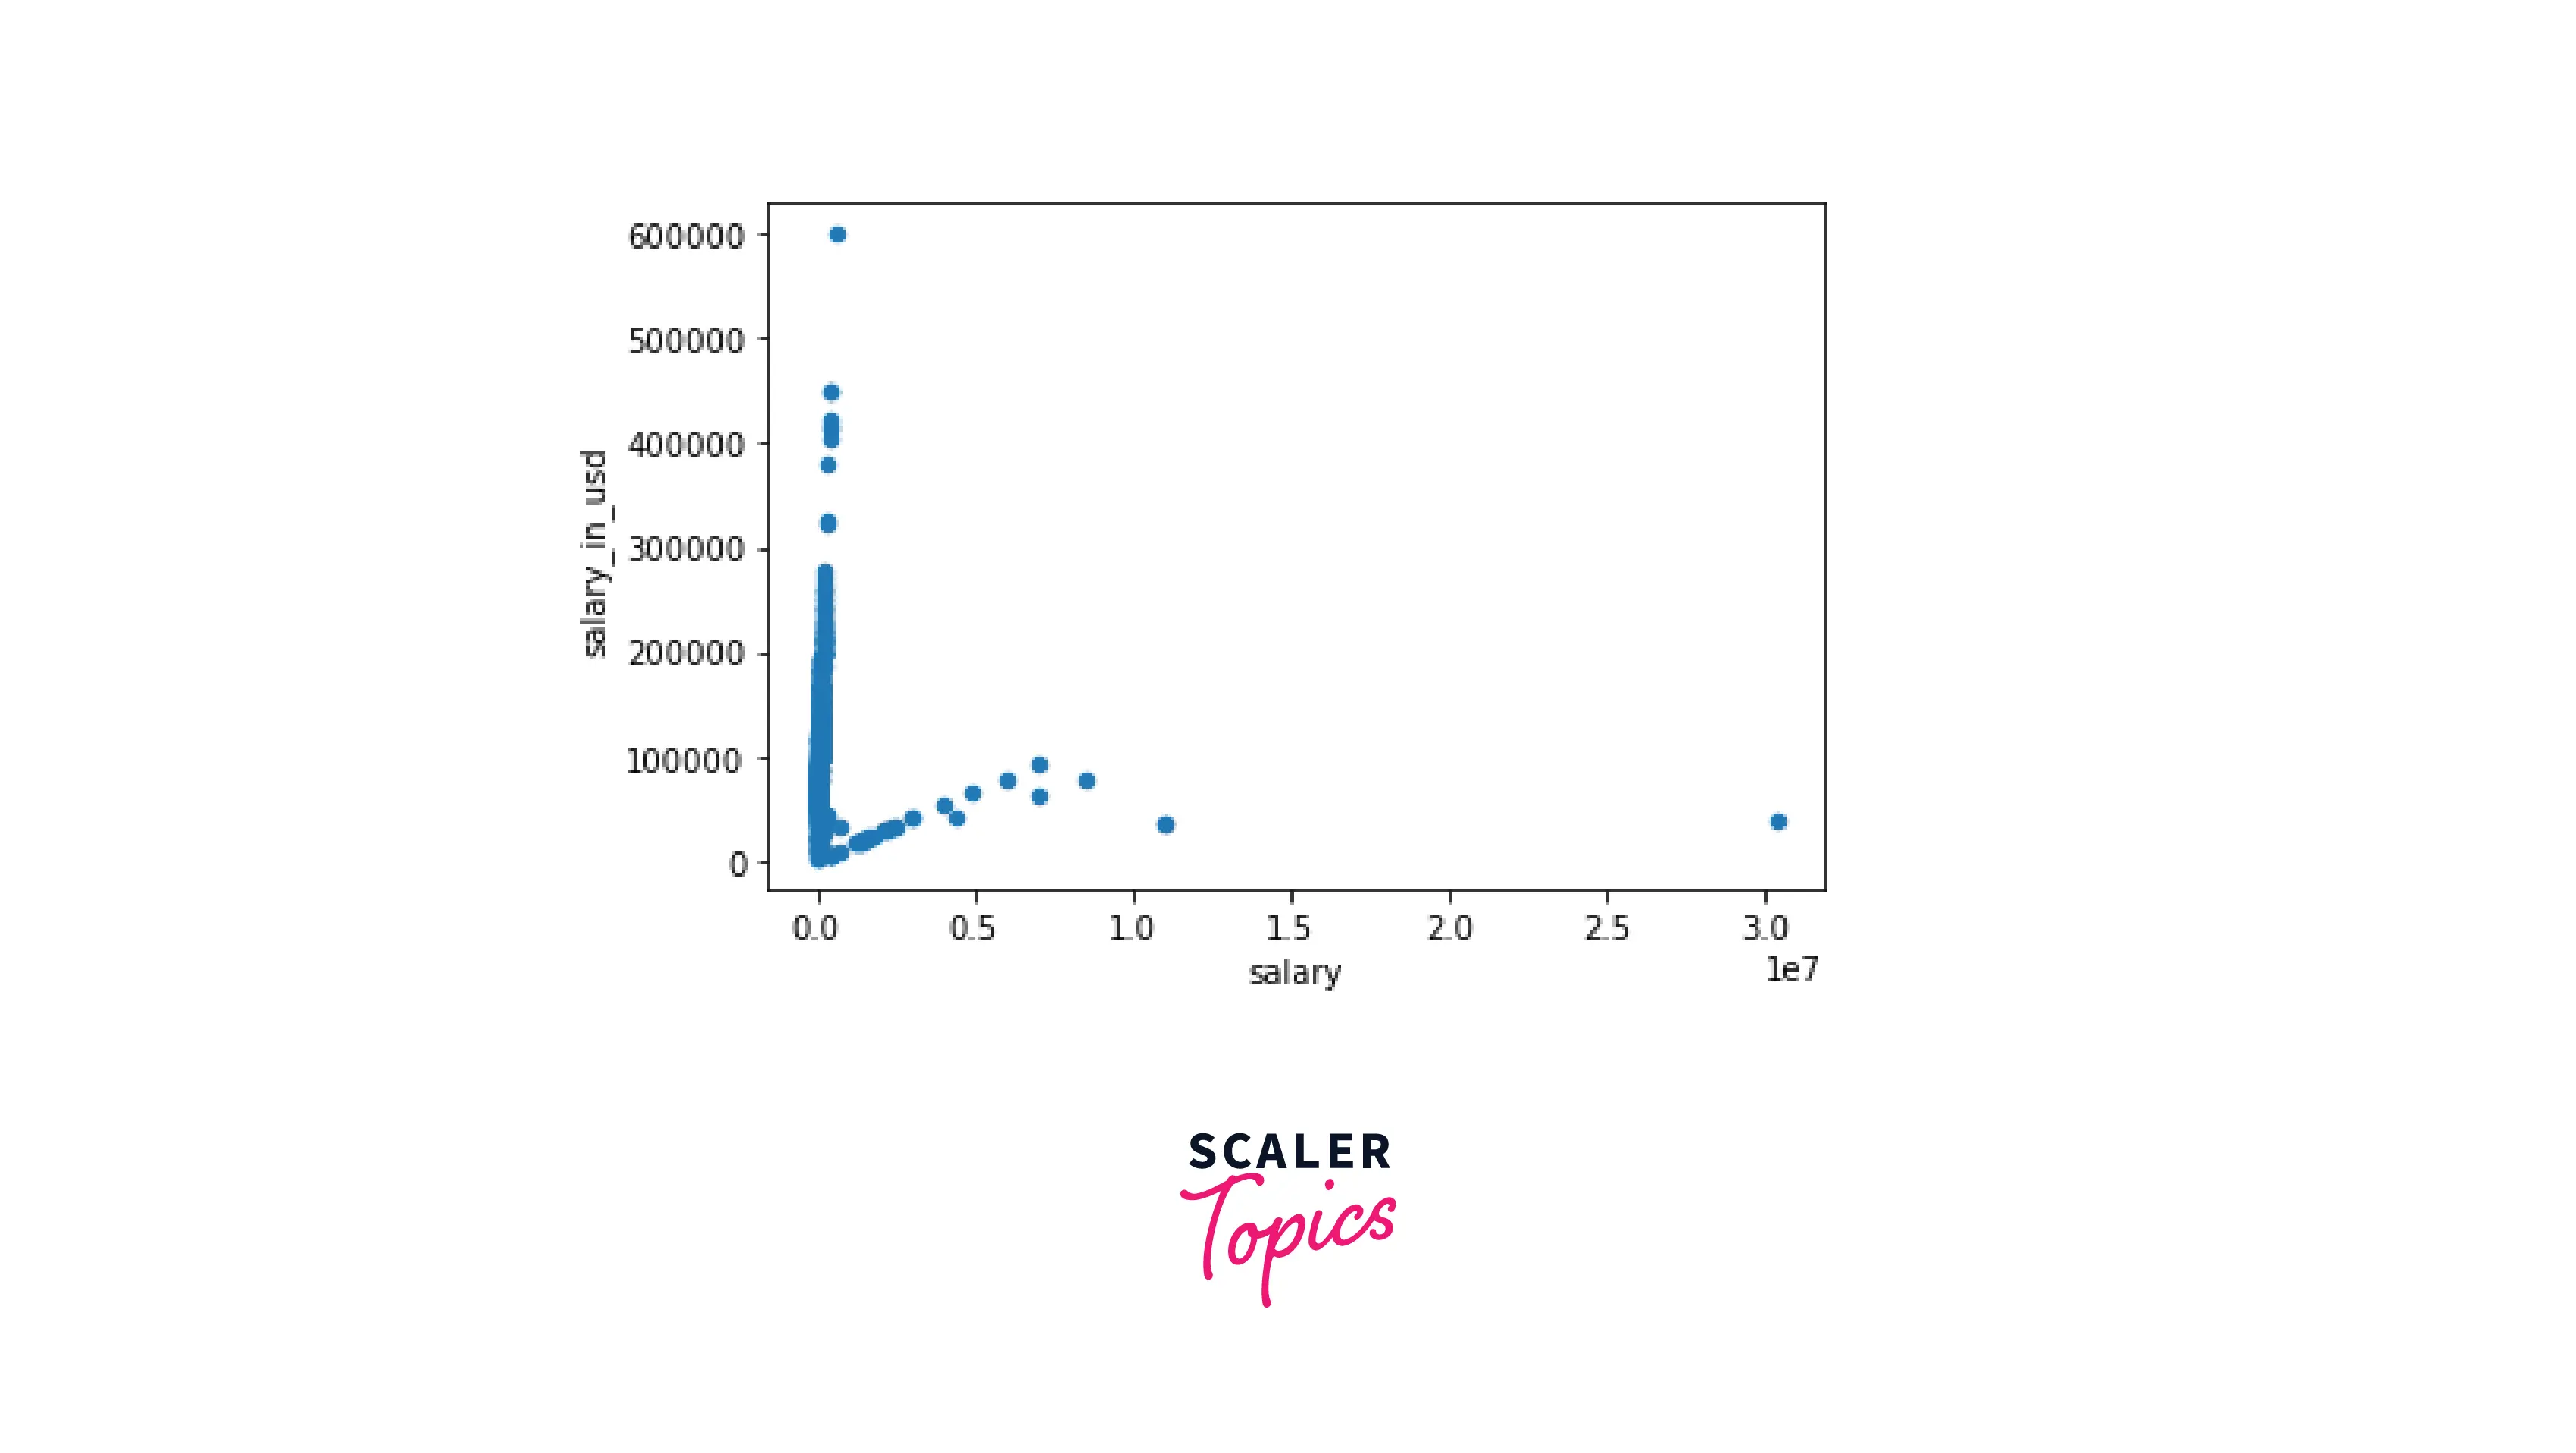
- There is a big difference between the first and second largest salaries in USD, which can indicate a potential outlier.
- There is almost no correlation between any of the numeric columns. This may look weird since we could expect some correlation between salary and salary_in_usd. On the scatter plot, we see the explanation: the data represent two strong trends and cannot be analyzed altogether.
- The scatter plot and histogram confirm our hypothesis above there is an outlier for the salaries in USD, and in general, the distribution for this column is strongly right-skewed.
- Another curious insight from the scatter plot: there is an obvious outlier for the salary column. This means that the ratio of that currency to USD is extremely high. Running the following piece of code:
gives us the currency and the country, and explains everything. It is Chilean peso, Chile (1 USD = 931.54, as of September 2022).
Applications of EDA
Performing EDA before diving into the main part of data analysis or starting to apply machine learning techniques is very helpful in numerous ways. Below are the most important applications of EDA:
- Grasping the overall size and structure of the data.
- Getting familiar with the available variables (columns) and deciding which of them would be potentially useful for solving the main problem of the project. In a real-world context, we do not analyze the data for the sake of the analysis itself. Instead, our goal is to answer a particular business question stated by the company.
- Identifying among the selected columns those with eventual issues. Such issues can be missing values, wrong data types, incorrect data representation, predominant values, duplicates, outliers, etc.
- Detecting the unique values of the columns in interest, determining their meaning (especially if the dataset documentation does not provide enough information), and exploring their distribution.
- Figuring out the ways of dealing with the identified issues through data gathering, data cleaning, and data transformation.
- Exploring the statistics for the columns in interest and checking their distribution forms.
- Analyzing the correlation between various columns and validating their presence or absence.
- Creating simple visualizations and getting from them the first insights for further investigation.
Importance of Pandas in EDA
In the section on Code Example, if to ignore loading the data, importing the library, and printing outputs, we virtually ran only 15 lines of very simple code for EDA in pandas, as follows:
As a result, we obtained a lot of useful information about the dataset which can serve as a solid basis for further data wrangling, data analysis, and machine learning. Let us, therefore, emphasize the benefits of using pandas in EDA:
- A big choice of helpful, well-documented methods for conducting EDA in pandas, including basic visualizations.
- Intuitive names of pandas functions, their parameters, and possible values.
- Easy-to-read syntax and code output.
- The methods of EDA in pandas often work fine without passing in any arguments (the default values are usually good enough for many cases). At the same time, these functions are very flexible and can be easily tuned if necessary.
Conclusion
- EDA is a vital initial step of any data science project.
- Some of the essential applications of EDA are grasping the size and structure of the data, identifying crucial features and potential issues with them, gathering fundamental statistics, analyzing data correlation, creating basic visualizations, and extracting first insights.
- Performing EDA in pandas allows running a few lines of simple code to efficiently solve all the above tasks and prepare a solid basis for further data wrangling, data analysis, and machine learning.
- Pandas offers a wide range of well-documented, intuitively understandable, flexible analytical tools for EDA that often work fine with the default arguments but can be easily tuned if necessary.