Getting Familiar with Pandas Dataframe
Overview
Pandas objects can be regarded as upgraded forms of NumPy structured arrays, with rows and columns identifiable by labels rather than plain integer indices. Pandas provides a plethora of helpful features, methods, and functionality on top of the fundamental data structure, but practically everything that follows will need a comprehension of this data structure. So, before we proceed any deeper, let's go through the Pandas data structures: the DataFrame. The Pandas DataFrame may be viewed as either a generalization of a NumPy array or a subset of a Python dictionary.
What is a DataFrame?
So, just what is a DataFrame? A DataFrame is a data structure that, like a spreadsheet, arranges information into a 2-dimensional table of rows and columns. Because they provide a versatile and easy manner of storing and interacting with data, DataFrames are among the most often utilized data structures in modern data analytics.
Understanding DataFrame is critical not just because it is one of the fundamental data structures, but additionally since it is the foundation of an Index, which is a 3-dimensional labeled data structure. In a word, Pandas DataFrame is a Python equivalent of Excel, containing tables, rows, and columns, as well as several functions that make it an excellent framework for processing, data examination, and modification.
Now that we've defined what we meant by a DataFrame, let's look at some of its features before going ahead.
Features of Pandas DataFrame
Some of the common functionalities provided by Pandas DataFrame are as follows:
- Pandas DataFrame has a number of adjustable features and parameters. They're great productivity enhancers since they allow you to completely customize your Pandas DataFrame environment.
- Each column in a Pandas DataFrame must include data of the same type, although separate columns might contain data of different types.
- Pandas DataFrame is value mutable and size mutable; mutable in this context refers to the column number.
- There are two axes in a Pandas DataFrame object: "axis 0" and "axis 1." Rows are represented by "axis 0," while columns are represented by "axis 1."
- We can execute mathematical operations on the rows and columns of a Pandas DataFrame.
- We can stack two separate DataFrames horizontally or vertically.
- Our DataFrame may be reshaped, merged, and transposed.
Let us now examine the structure of a DataFrame after we have examined the essential features of Pandas DataFrame.
Structure of Pandas DataFrame
A Pandas DataFrame is a two-dimensional data structure made up of rows and columns, similar to an Excel or a Database table ( Like SQL ). A Pandas DataFrame column is a pandas Series. These columns should all be the same length, although they may be of distinct data types, such as float, int, or bool. DataFrames can change their values as well as their size. It thus allows us to change the values stored in the DataFrame or add/remove columns from the Pandas DataFrame.
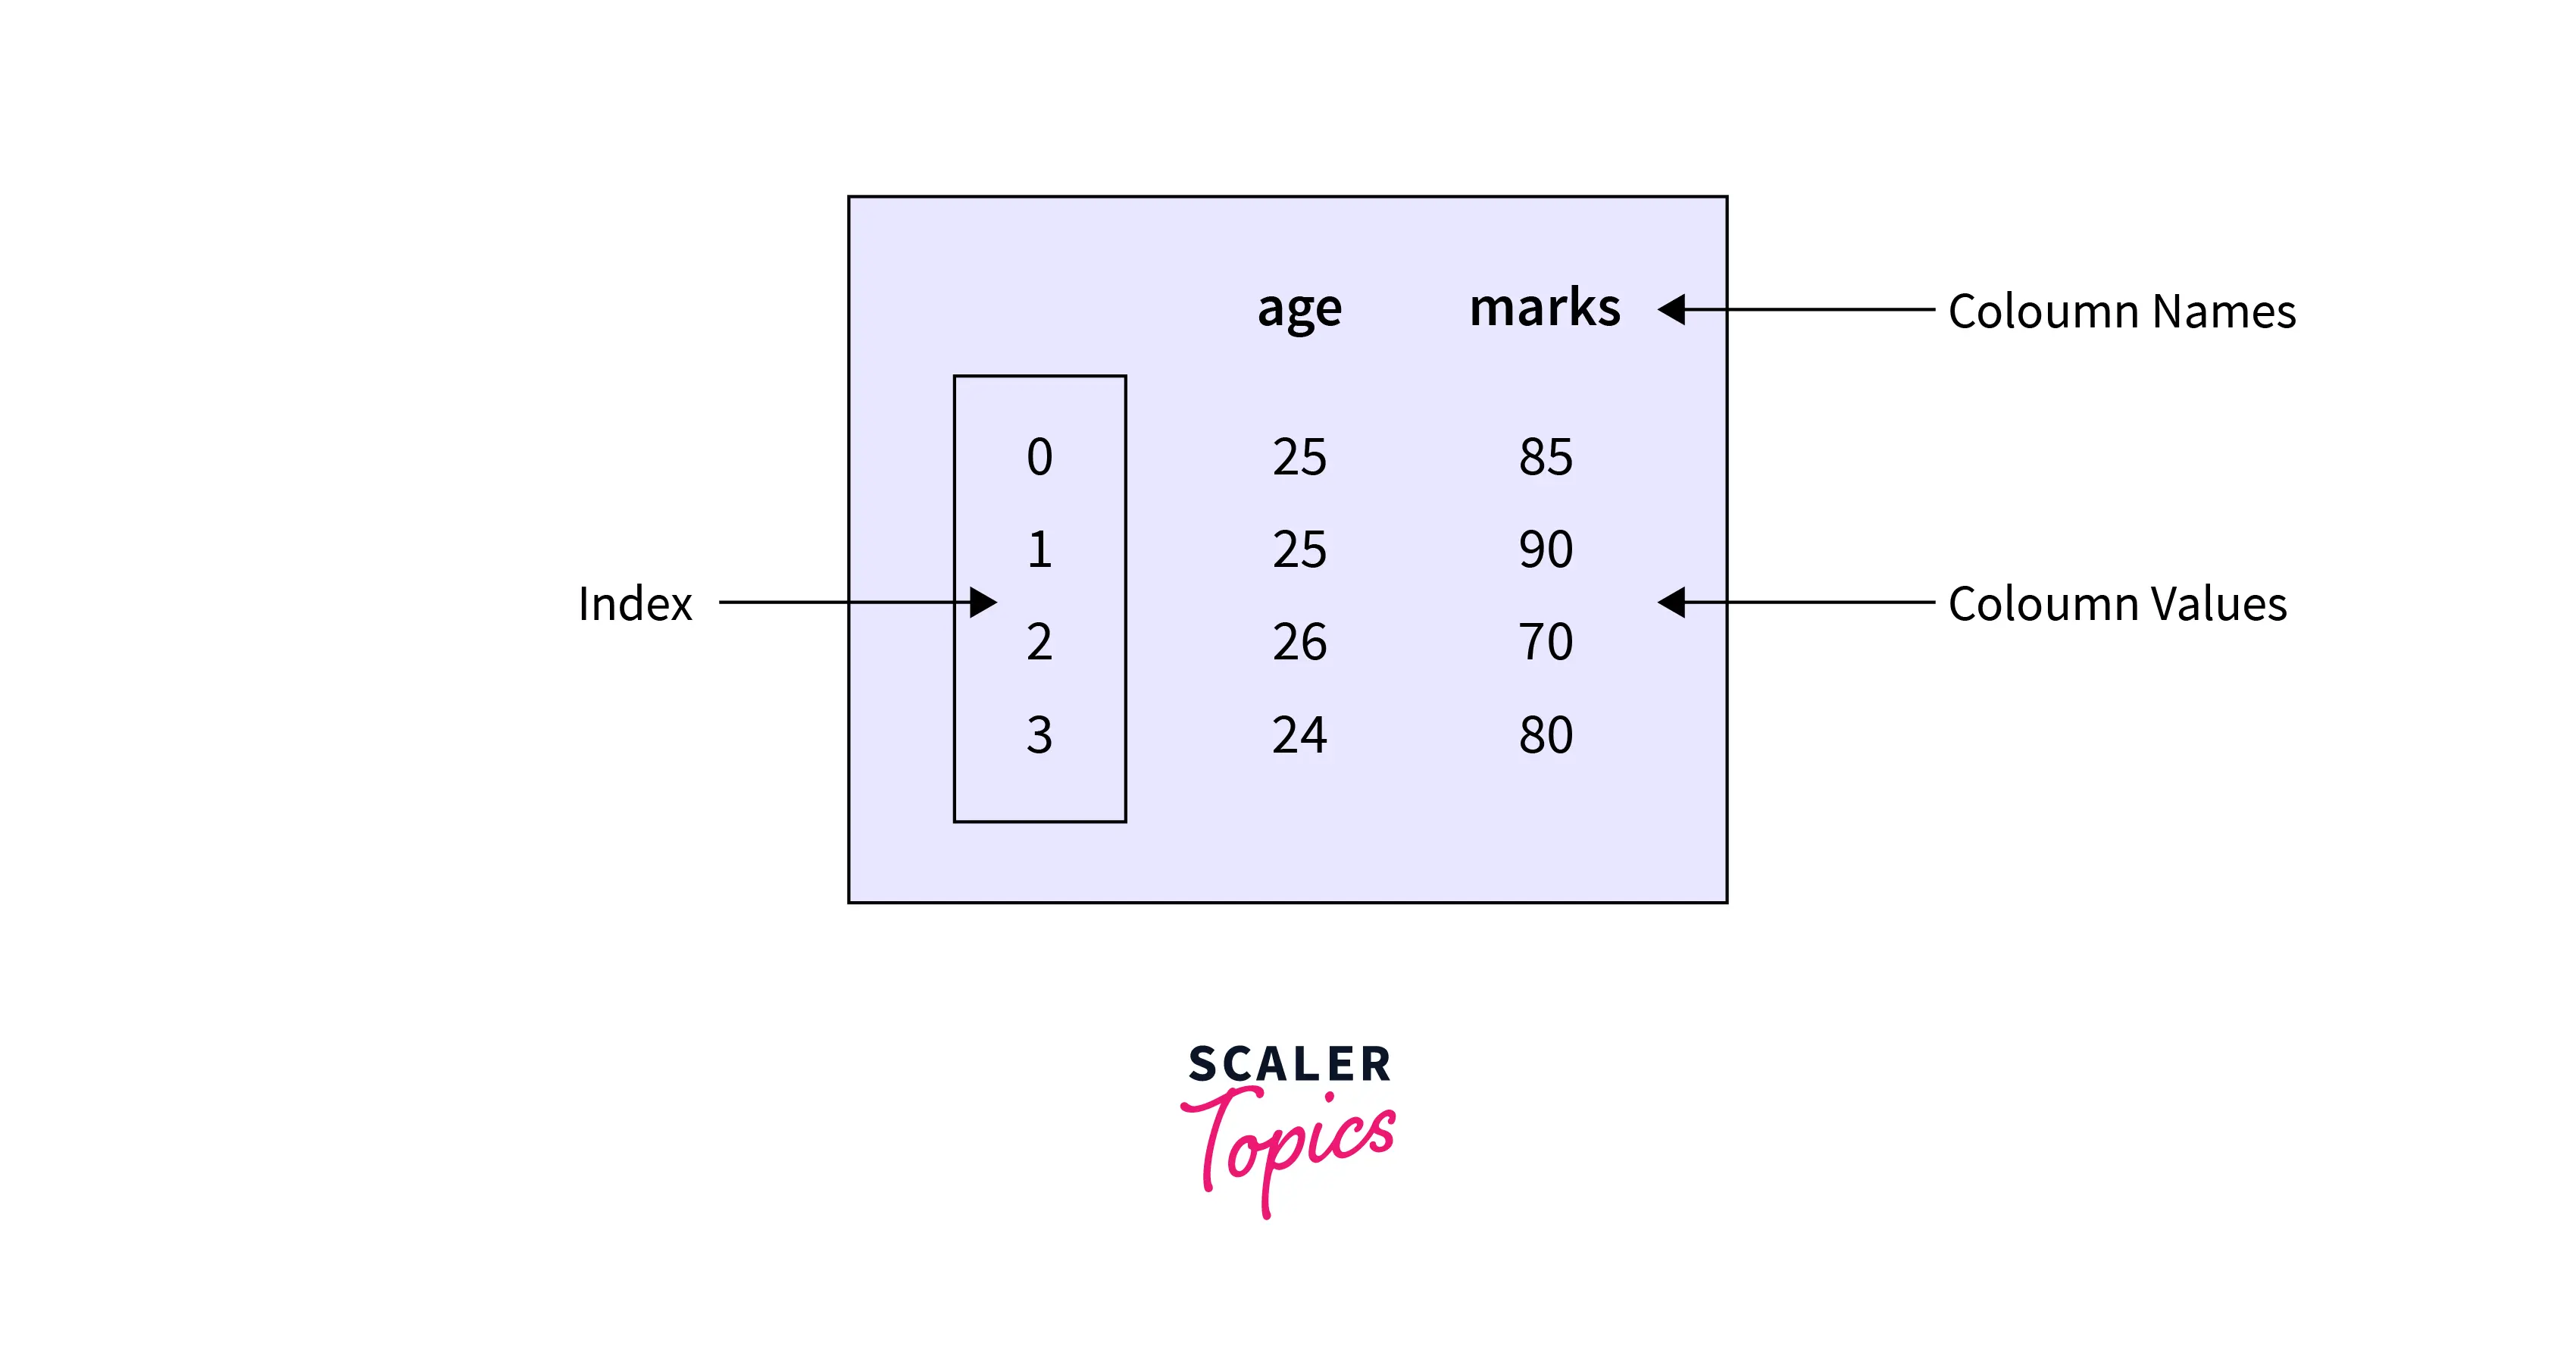
Pandas DataFrames are typically made up of Values, a row index, and a column index. There are two index arrays in the DataFrame. The functions of the first index array are substantially similar to those of the index array in series. In reality, each label corresponds to every value in the row. The second array has a sequence of labels, each connected with a certain column. A Pandas DataFrame object has two axes: "axis 0" and "axis 1." The "axis 0" indicates rows, whereas the "axis 1" indicates columns.
Syntax and Parameter
The syntax for the DataFrame() method, which is used to construct pandas DataFrame objects, is as follows:
Syntax :
pandas.DataFrame(data=None, index=None, columns=None, dtype=None, copy=None)
Parameter List
It requires the following set of parameters:
| Sr. NO. | Parameter Name | Parameter description |
|---|---|---|
| 1 | data | Contains data that will be saved in Dataframe. It might be an ndarray, an iterable, a dictionary, or a DataFrame. |
| 2 | index | Index values must have the same length as data and be hashable. If no index value is specified, values ranging from 0, 1, 2,..., n-1 are used as the default. |
| 3 | columns | It is used to supply column labels that will be employed for column selection. |
| 4 | dtype | It is used to specify the data type of the data |
| 5 | copy | It takes a Boolean value as input and has a default value of None. It is used to assess whether or not the input data should be replicated. The default of None for dict data acts similarly to copy=True. The default of None for DataFrame or 2d ndarray input is equivalent to copy=False. |
It's time to put our theory into practice now that we've mastered the DataFrame() function. Let's start with something simple. Let's start with an empty Pandas DataFrame object.
Create an Empty Pandas DataFrame
An Empty Pandas DataFrame is a type of basic DataFrame that can be formed. To further understand it, look at the code below.
Code:
Output:
As you can see, it created an empty DataFrame and will add entries later. The columns parameter is a collection of strings that have now been converted into DataFrame columns.
Let us now change gears a little.
Transform Your Career
Choose from our industry-leading programs designed for career success
Modern Software and AI Engineering Program
Master full-stack development with AI integration

Modern Data Science and ML with specialisation in AI
Advanced data science techniques with AI specialization
Advanced AIML with Specialisation in Agentic AI
Deep dive into AIML with focus on Agentic systems
DevOps, Cloud & AI Platform Engineering
Build and manage AI-powered cloud infrastructure
AI Engineering Advanced Certification by IIT-Roorkee
Premier AI engineering certification from IIT-Roorkee
Creating a Pandas DataFrame
There are several methods for constructing a Data Frame. Let's begin with lists.
Create a Pandas DataFrame Using ndarrays / List
We may produce a DataFrame object using a numpy array or list in the DataFrame() method. Consider the following code example to better understand it:
Code:
Output:
In the preceding code example, we supplied a 2D numpy array / list; each array corresponds to a row in the DataFrame and ought to be of equal length. If we additionally supply an index, it will have a similar length as the arrays.
Create a Pandas DataFrame from Dict of ndarray/Lists
To construct a Pandas DataFrame object, we could alternatively utilize a dictionary of NumPy arrays / Lists in the DataFrame function. Dictionary keys are converted into column labels in the DataFrame. Dictionary values are converted into column values. Column values are concatenated into a single row in the supplied order. All ndarrays or lists should be of equal length. If an index is provided, it must have the similar length as the NumPy arrays. Consider the following illustration :
Code:
Output:
Create a Pandas DataFrame from the List of Dicts
A list of dictionaries may also be used to generate a Pandas DataFrame:
Code:
Output:
As you might have witnessed in the previous example, the column labels are the dictionary keys, and the data values in the Pandas DataFrame are the dictionary values.
Create a Pandas DataFrame from Dict of Series
You may recall that in the Introduction to Series article, we discussed the series object employed to represent 1-d array objects. We may also construct a Pandas DataFrame using a dictionary of Pandas Series. To further comprehend it, consider the following example:
Code:
Output:
You may have seen in the preceding example that the resultant index is the union of the indices of the several Series. And also, the column labels are the dictionary keys, and the data values in the Pandas DataFrame are the dictionary values.
Create a Pandas DataFrame from a NumPy Structured Array
You may recall discussing structured arrays in NumPy's Structured Arrays article. A Pandas DataFrame is similar to a structured array in operation and may be built straight from one. Consider the following example to help comprehend it:
Code:
Output:
Create a Pandas DataFrame from a CSV or Excel File
CSV is an abbreviation for comma separated file. CSV is one of the most widely used file formats. We can make a Pandas DataFrame by importing a csv file, a simple Pandas procedure. Simply pass the file path to the read_csv() method. Consider the following illustration:
Assume we wish to read this specific csv file.
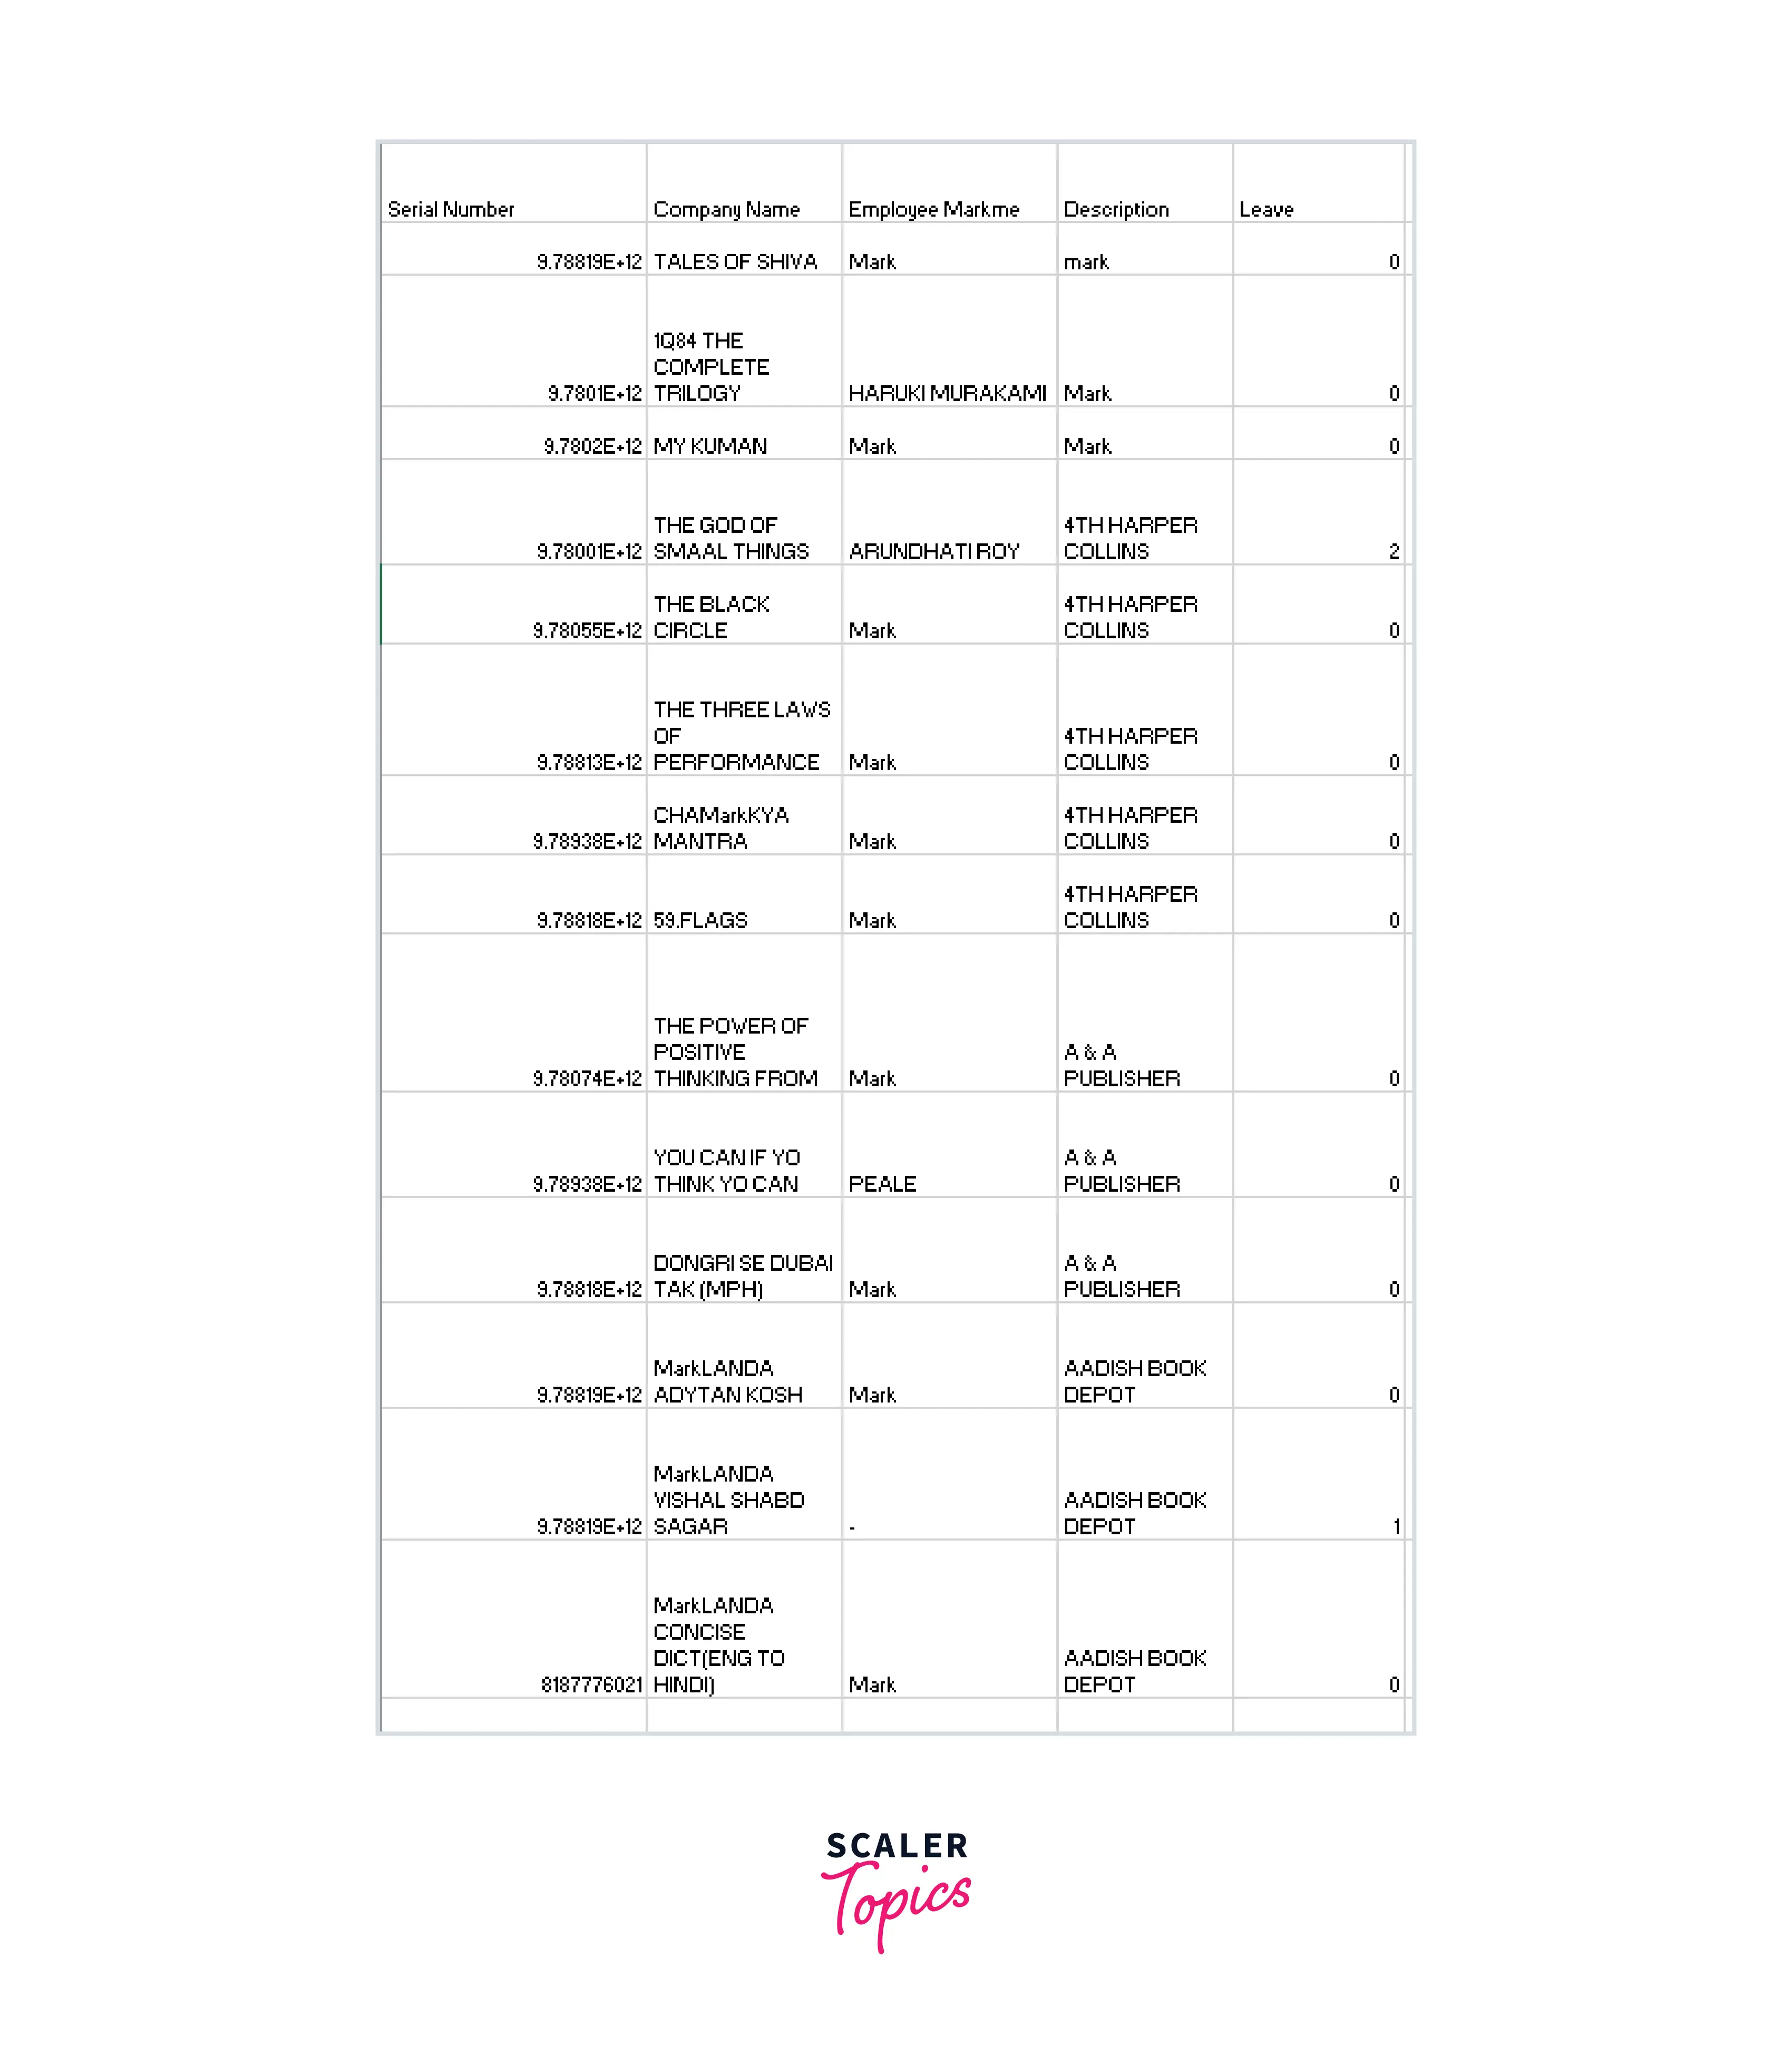
Code :
Output:
The read_csv() method is quite flexible. It offers numerous options that allow you to edit the csv file as it is being read. We may also read the file partially in terms of columns and rows. This will be covered in the article How to Load and Manipulate CSV Files with Pandas. In the Working with Excel in Pandas article, we also look at how to load data from an Excel file.
These are just a few examples of how Pandas DataFrame objects may be created. Next, let's look at some of the most significant Pandas DataFrame methods now that we've seen how to create DataFrame objects.
Important Pandas DataFrame Functions
Pandas DataFrame gives us a large range of functions to work with. Before we proceed, let's create a DataFrame object to interact with:
Code:
Turn Learning into Career Growth
Displaying Rows from a Pandas DataFrame Object
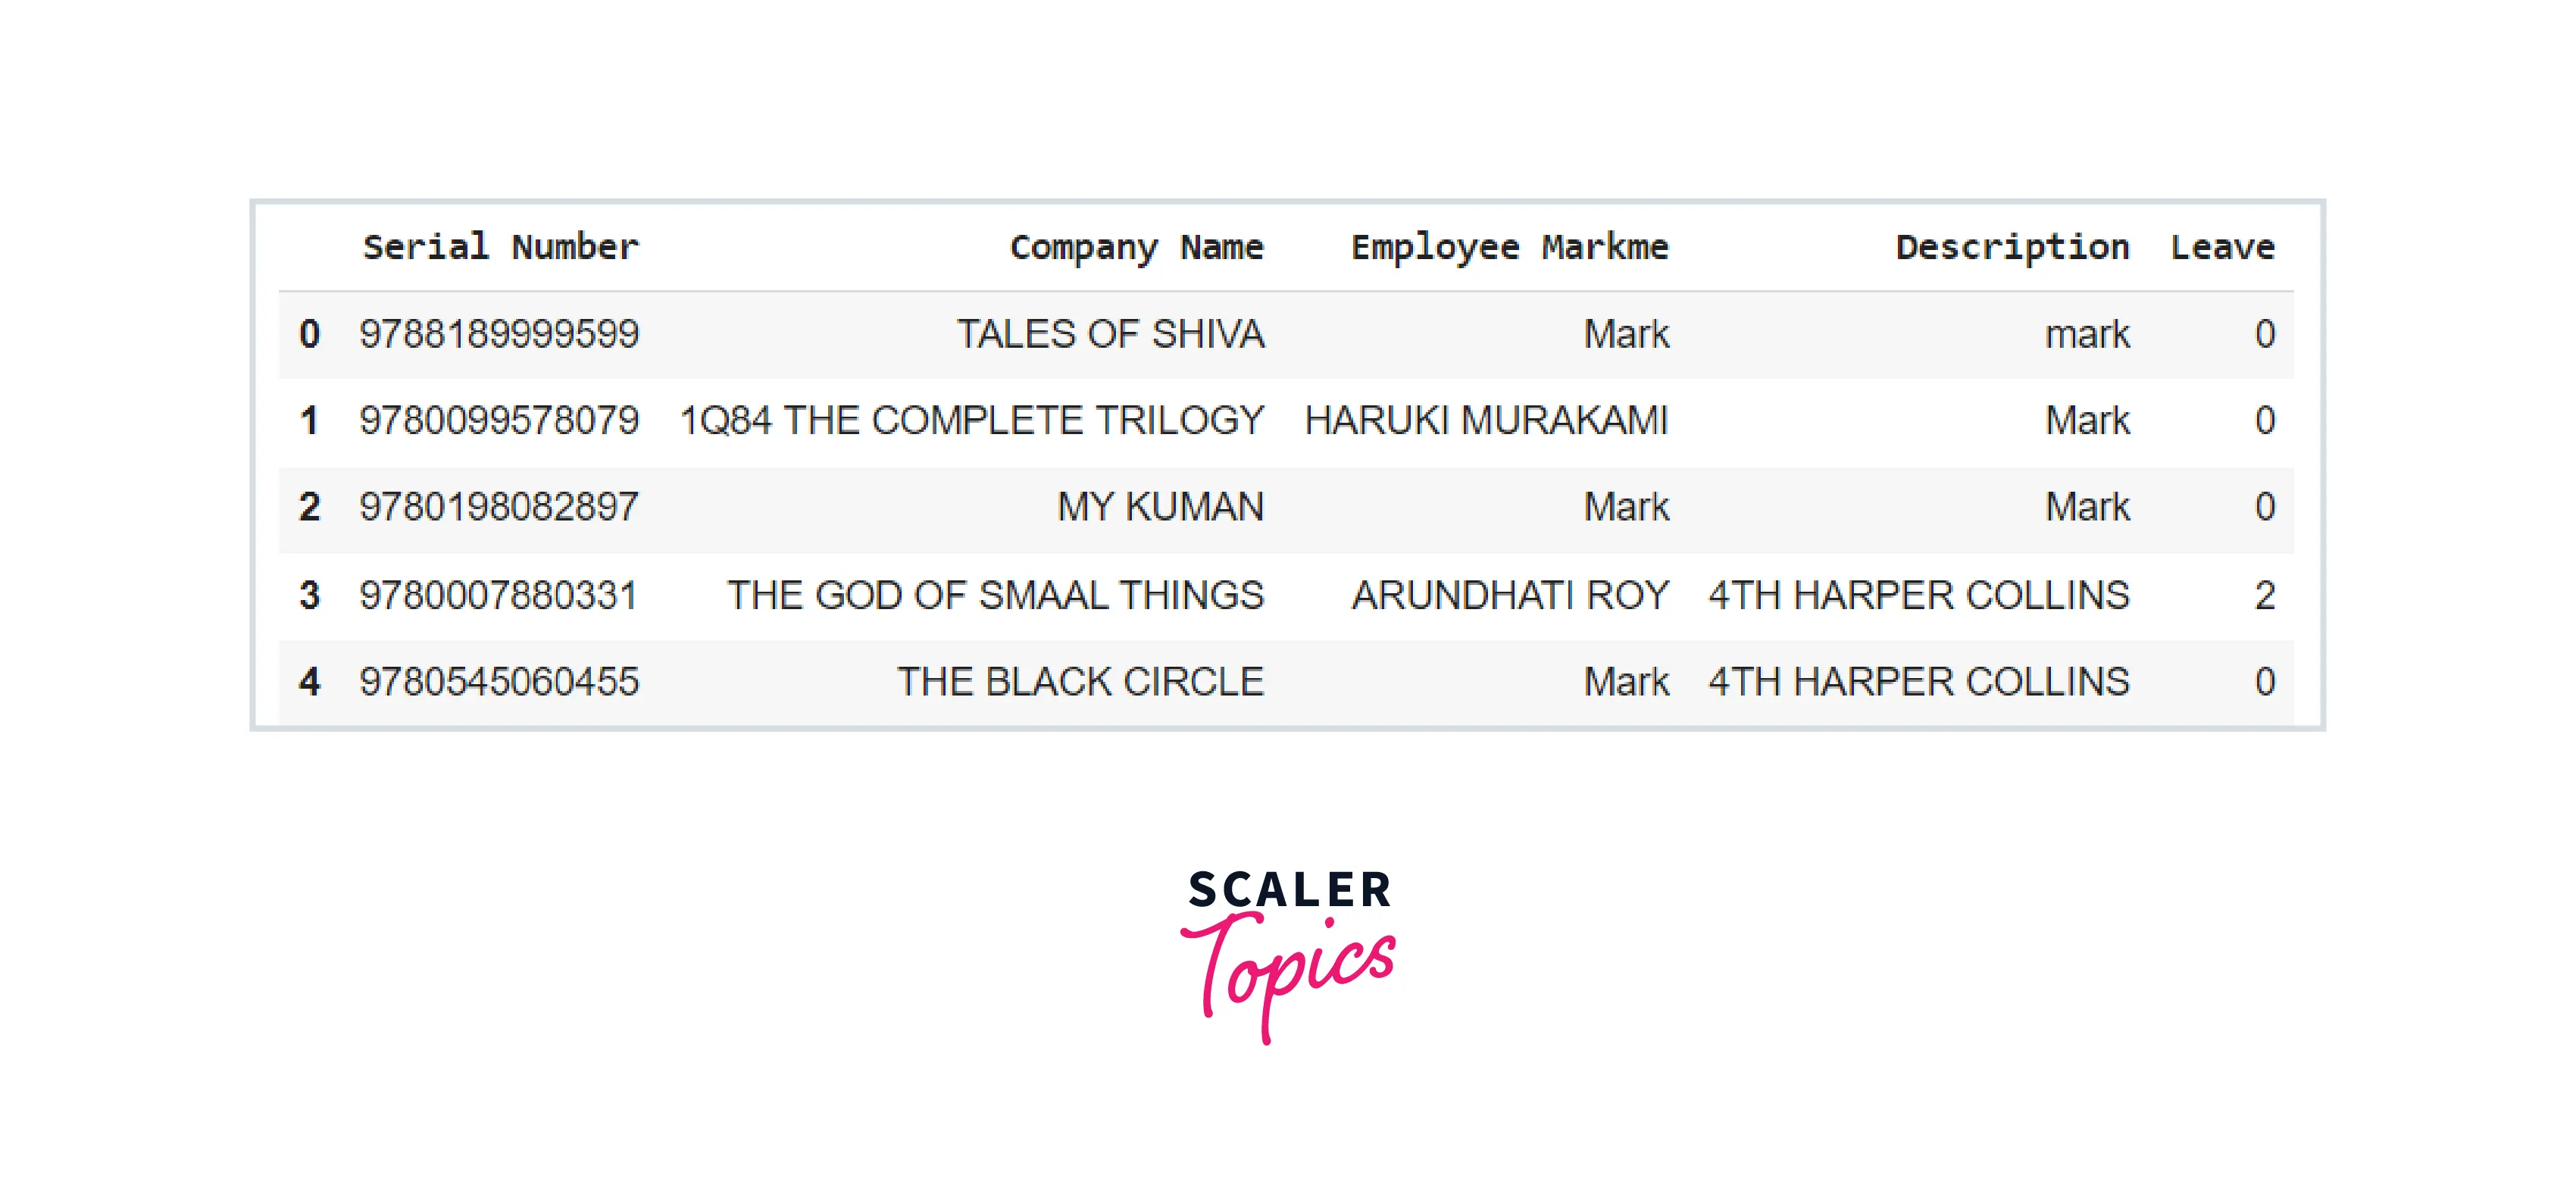
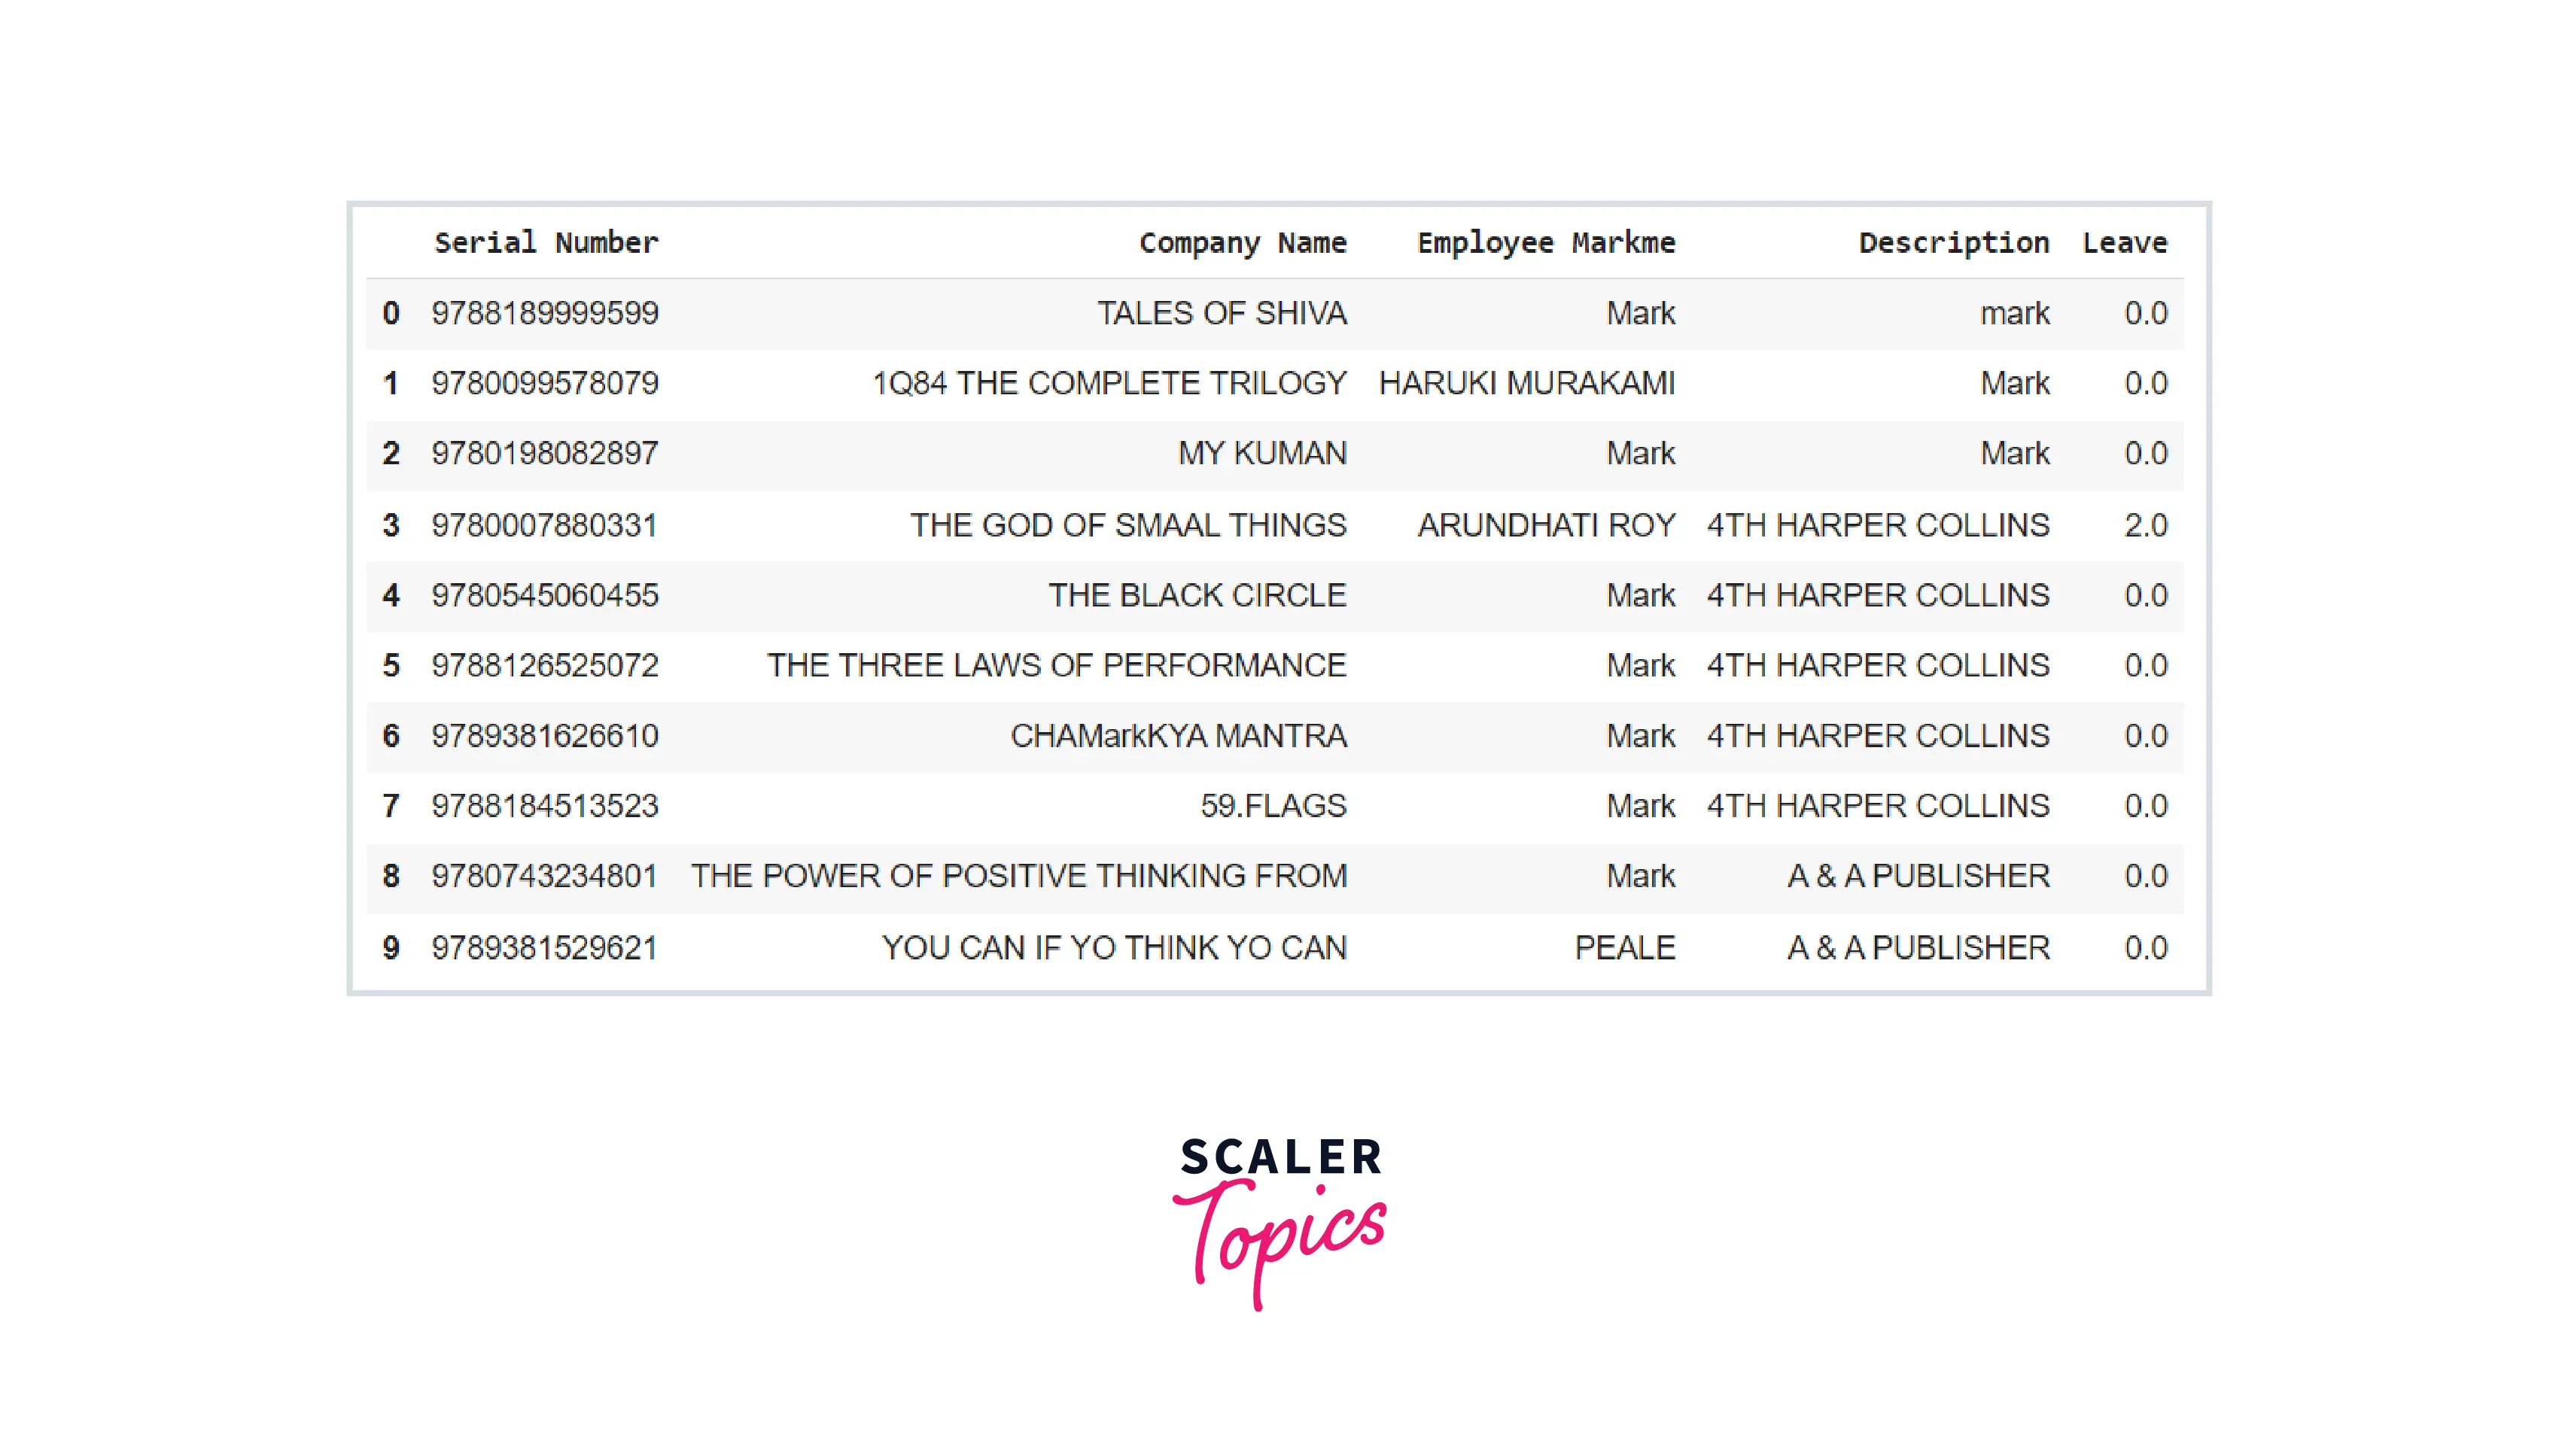
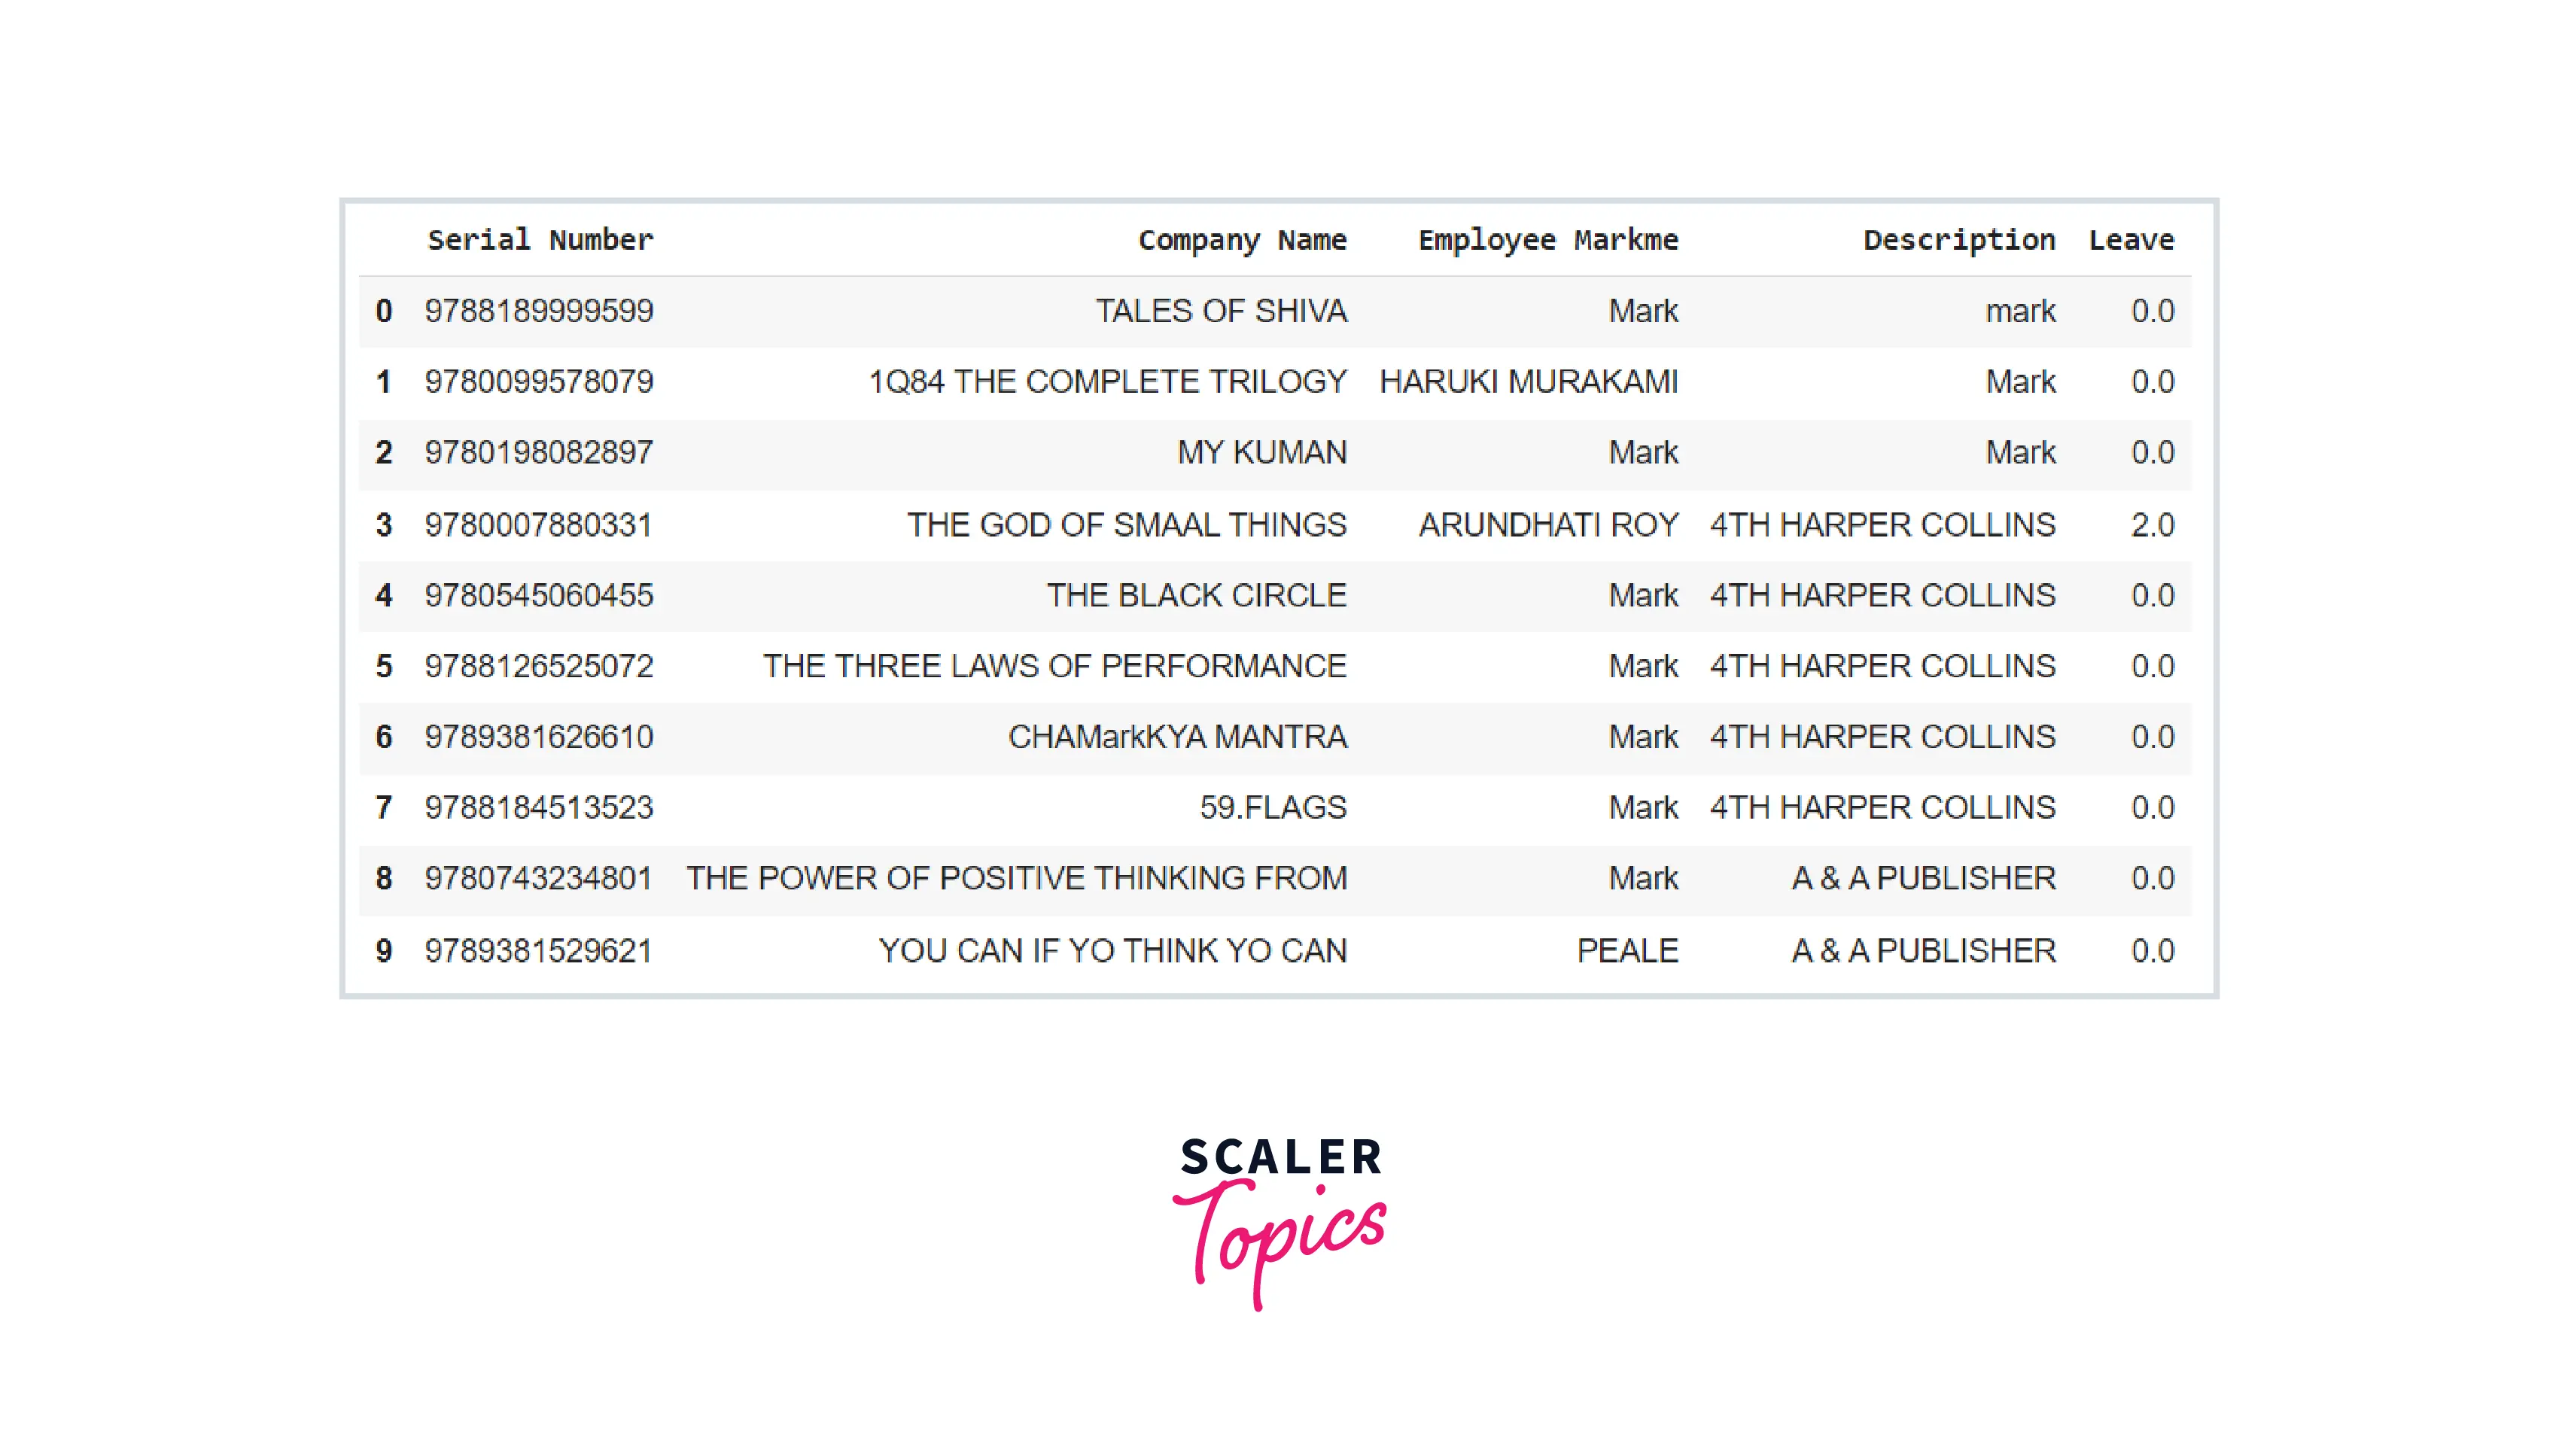
Head() and tail() functions retrieve the first and last n rows, respectively. If we don't specify a number for n, it defaults to 5. They are handy for swiftly verifying data, such as when we have a large amount of data.
Code:
Output:
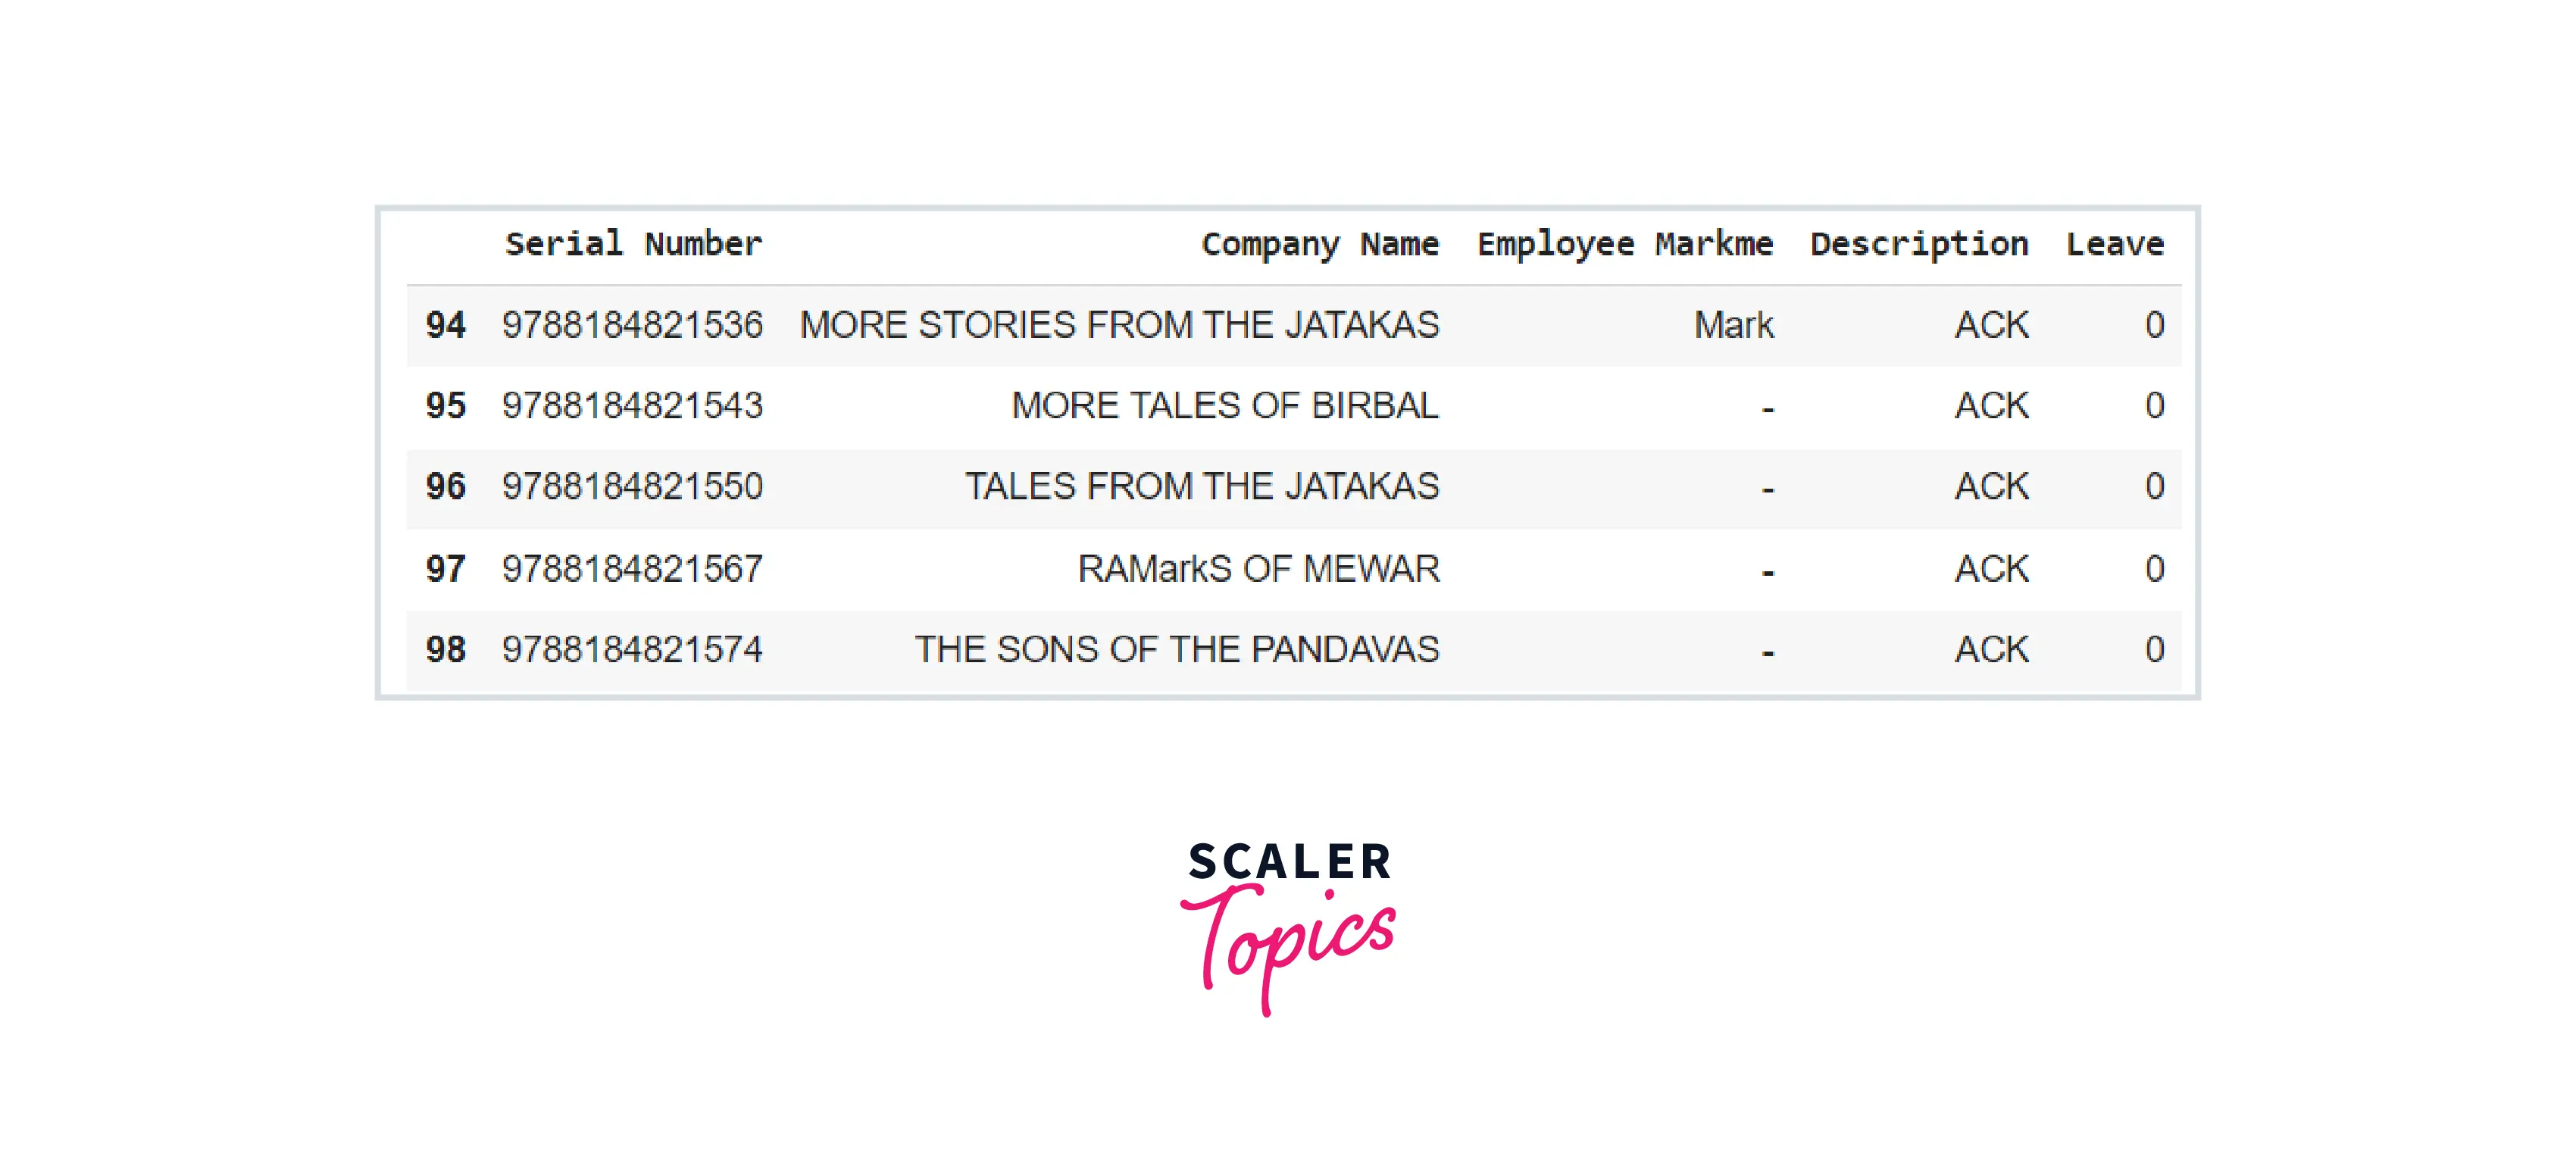
And
Code :
Output:
Scaler Placement Report and Statistics
Scaler learners achieved 2.5x salary growth with average post-Scaler CTC reaching ₹23L.
Get Descriptive Statistics of the Data in a Pandas DataFrame
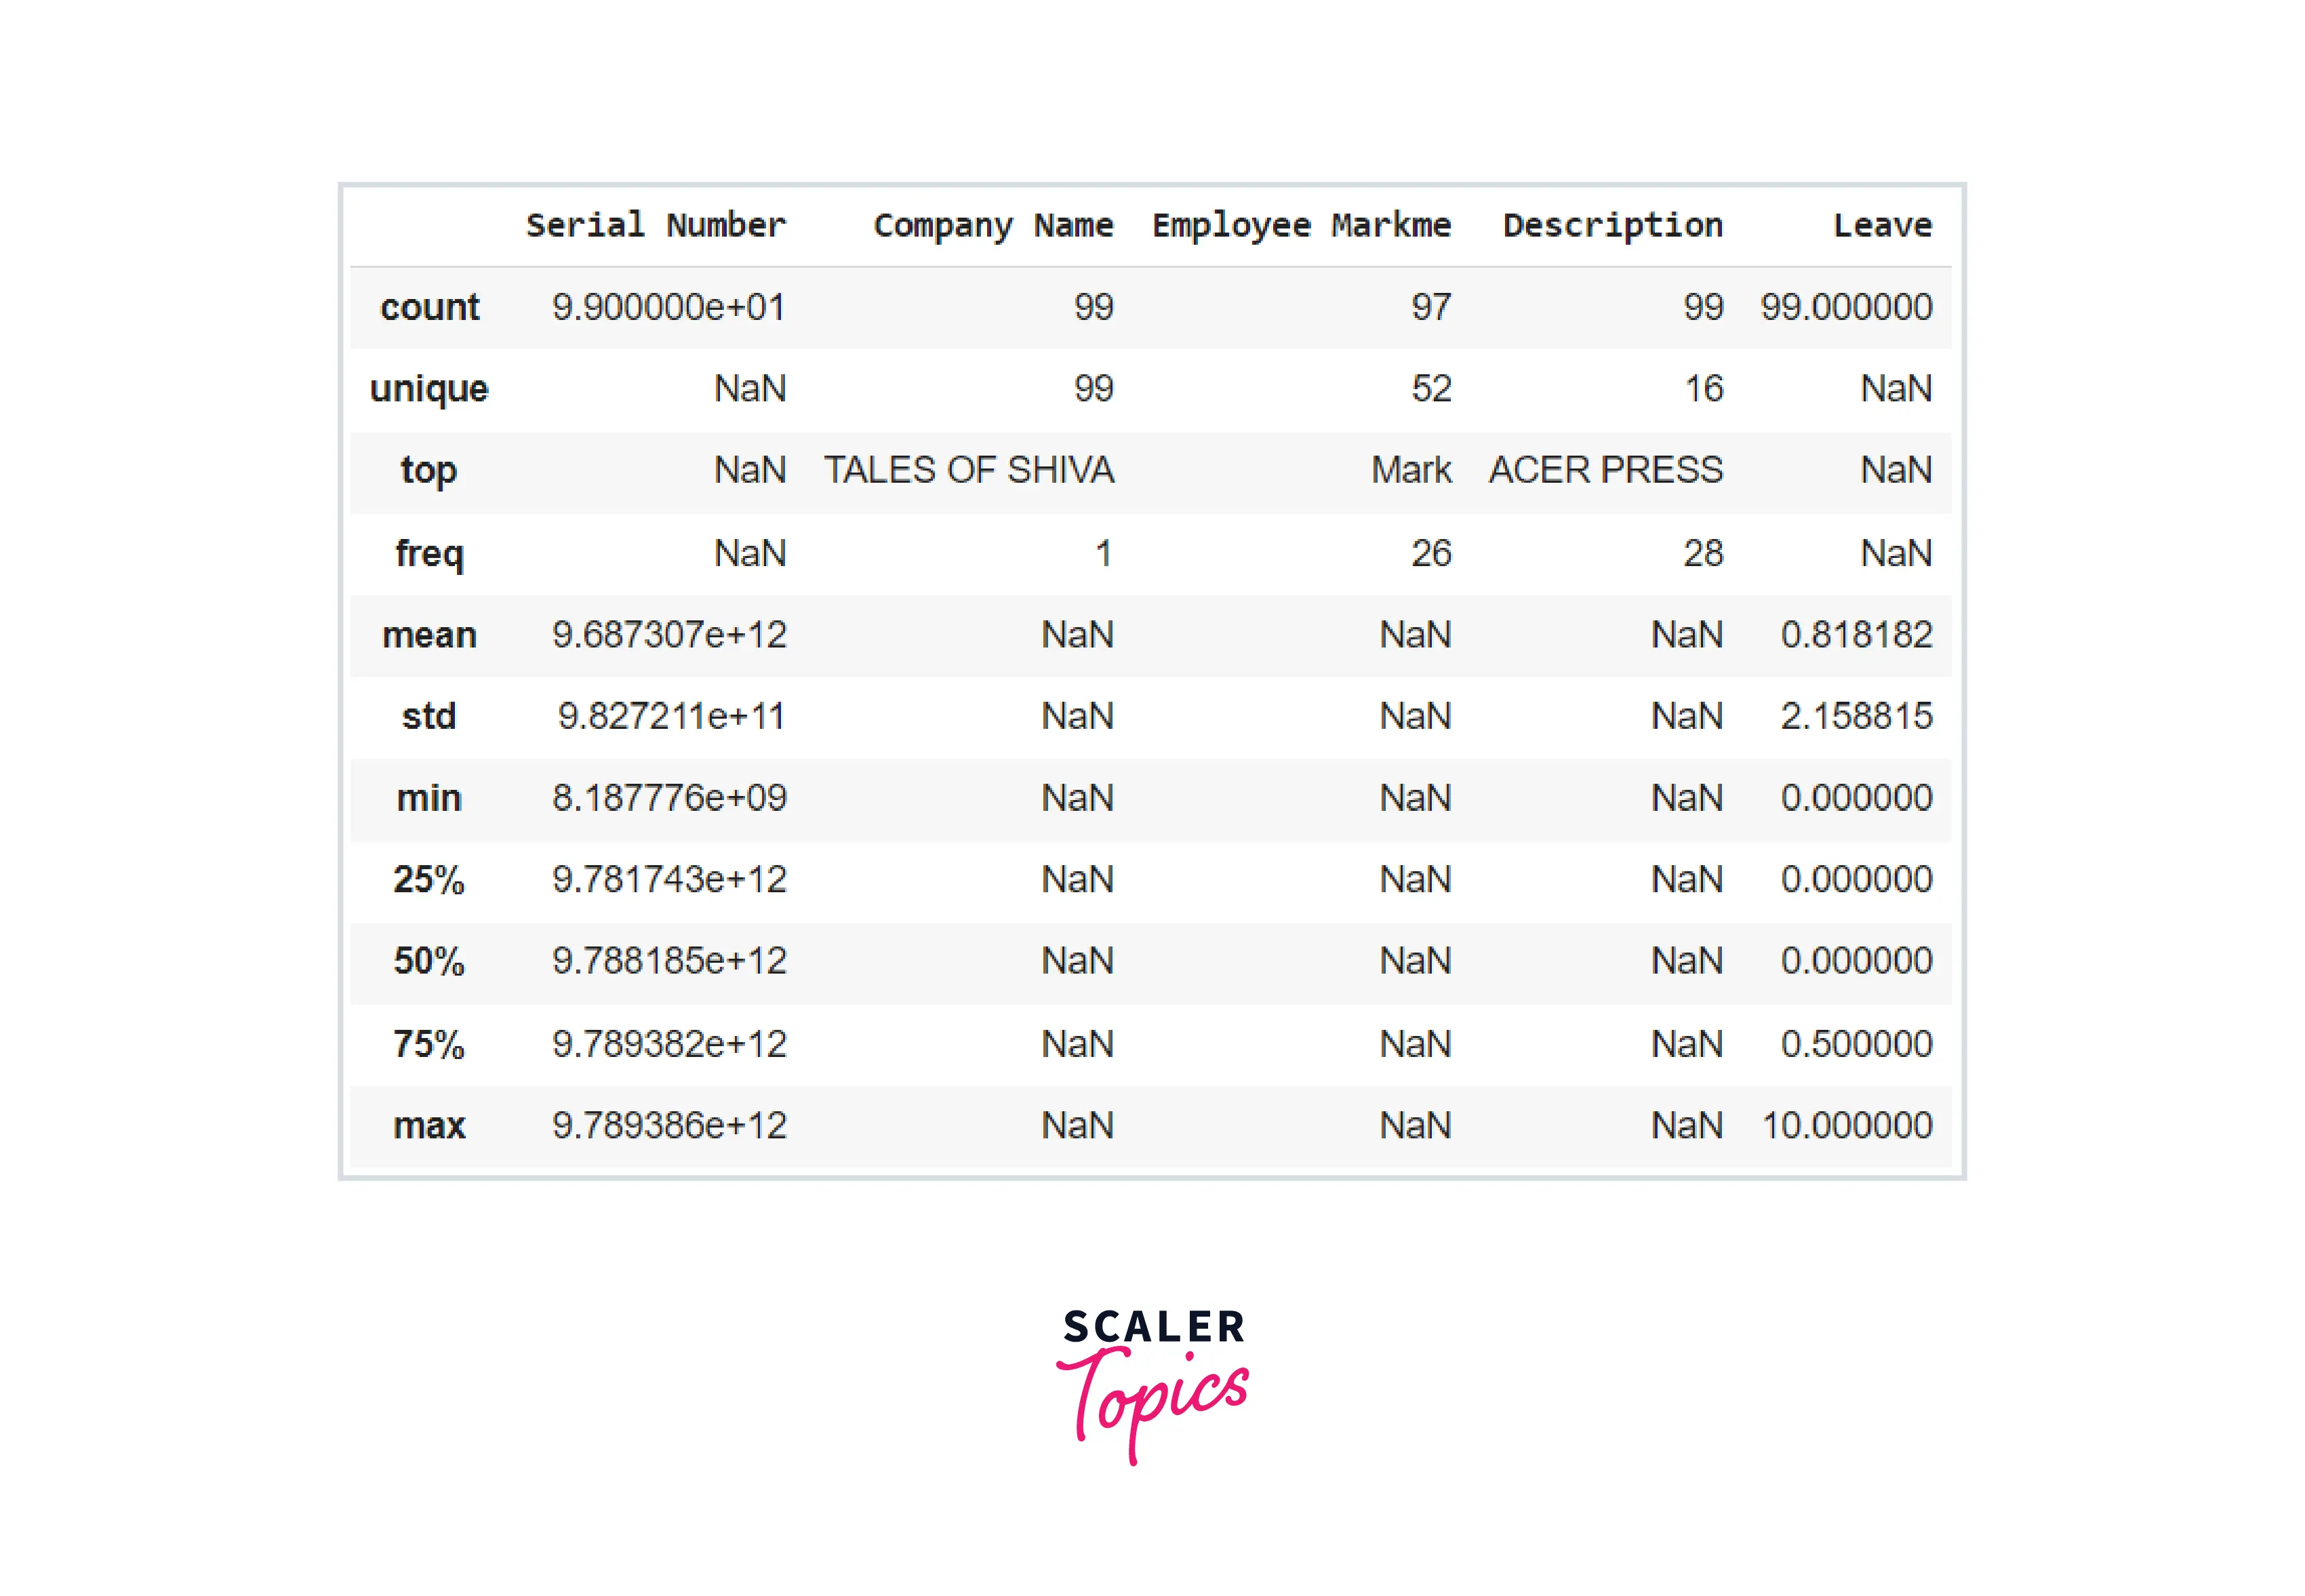
describe() generates descriptive statistics for information in a Pandas DataFrame that excludes NaN values. It describes the dataset's central tendency and dispersion. description() provides a summary of the dataset. To further comprehend it, consider the following example:
Code :
Output :
In the last code example, we observed that describe() returned a list of several descriptive statistical studies for each numerical column in our dataset. By setting the 'include' property to 'all,' we can force the description to incorporate all columns, even those with categorical data.
Code :
Output:
You may learn more about the describe() function by visiting the Official Pandas Documentation.
Get Memory Consumption for Every Column in a Pandas DataFrame
memory_usage() produces a Pandas Series containing the memory consumption (in bytes) of every column in a Pandas DataFrame. It requires two arguments, 'deep' and 'index,', both of which are set to False by default. We can find out how much space each column takes by setting the deep argument to True. By setting the 'index' argument to 'True,' we can additionally get the memory use of the DataFrame's index. Consider the following illustration:
Code:
Output:
Change the Data Type of a Column in a Pandas DataFrame
The astype() function is used to convert a Python object to a certain data type. It may be useful if your data is not saved in the proper format (data type). For example, if Python misunderstood floating point values as strings or objects, you may use astype() to change them back to floating point numbers. We can also use astype() to change an object data type to an int. Consider the following example:
Code:
Output:
Scaler Placement Report and Statistics
Scaler learners achieved 2.5x salary growth with average post-Scaler CTC reaching ₹23L.
Using .loc[] Access a Group of Rows and Columns in a Pandas DataFrame
The “.loc()” method makes obtaining data values from a pandas DataFrame object simple. We may retrieve the data values fitting in a group of rows and columns using the “.loc()” method depending on the index value given to the function. This method retrieves data by using the explicit index. It could also be employed to select data subsets. For example:
Code:
Output:
Using .iloc[] Access a Group of Rows and Columns in a Pandas DataFrame
Pandas' "DataFrame.iloc" property offers completely integer-location driven indexing for position selection over a particular DataFrame object. This method enables us to gather data based on its location. To accomplish so, we'll need to identify the locations of the data we desire. The "DataFrame.iloc" indexer is somewhat similar to "DataFrame.loc," except it only selects integer positions. Consider the following code example:
Code:
Output:
Count of Pandas DataFrame Object's Values
The value_counts() function outputs the count of times each unique value appears in a DataFrame. It is beneficial to get an understanding of the pandas DataFrame object's value distribution. Consider the following example:
Code:
Output:
Remove Duplicate Values from Pandas DataFrame
drop_duplicates() produces a Pandas DataFrame that is empty of duplicate entries. Even among duplicates, you may choose whether to maintain the first or final occurrence of the duplicate data. In addition, the inplace and ignore index attributes can be specified. The modifications are incorporated into the original dataset when the inplace option is set to True. We can see the differences by comparing the shapes of the original and updated datasets (after removing the duplicates). Examine the following code example to better understand it:
Code:
Output:
Sort Our Data in Pandas DataFrame
sort_values() is employed to sort columns in a Pandas DataFrame in either ascending or descending order by values. We may make a modification straightly in the original DataFrame by setting the inplace parameter to True. Consider the following example:
Code:
Output:
Fill NaN Values in Our Pandas DataFrame
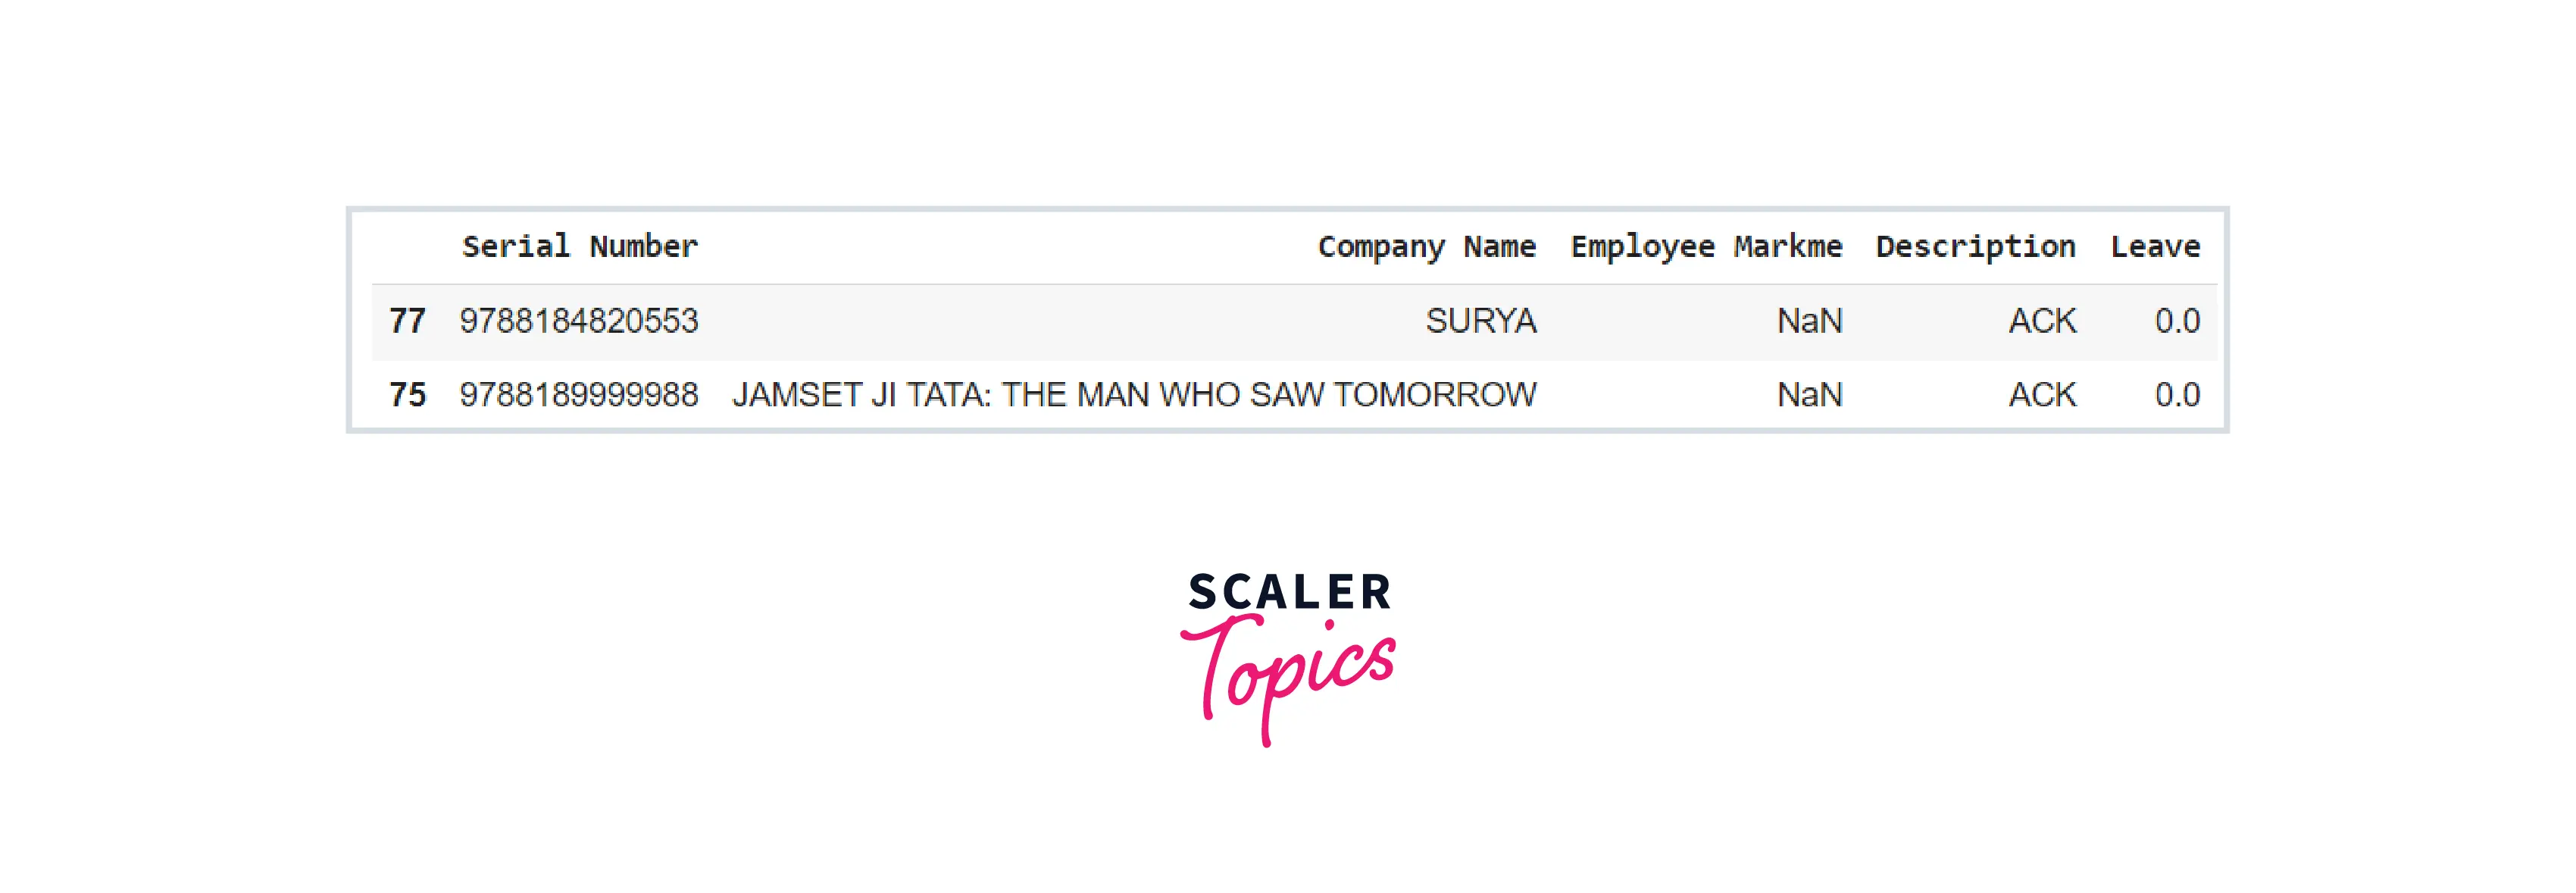
We may typically discover multiple records categorized NaN by Python in a huge dataset. NaN is an abbreviation for "not a number," and denotes items not filled out in the original database. Pandas ensures that the information in the DataFrame may be identified independently by the user while populating them. fillna() replaces all NaN values in a DataFrame by incorporating more suitable values in their stead. The mean, median, mode, or other constant number might be used to fill in the blanks. Consider the following code example to better understand it:
Code:
Output:
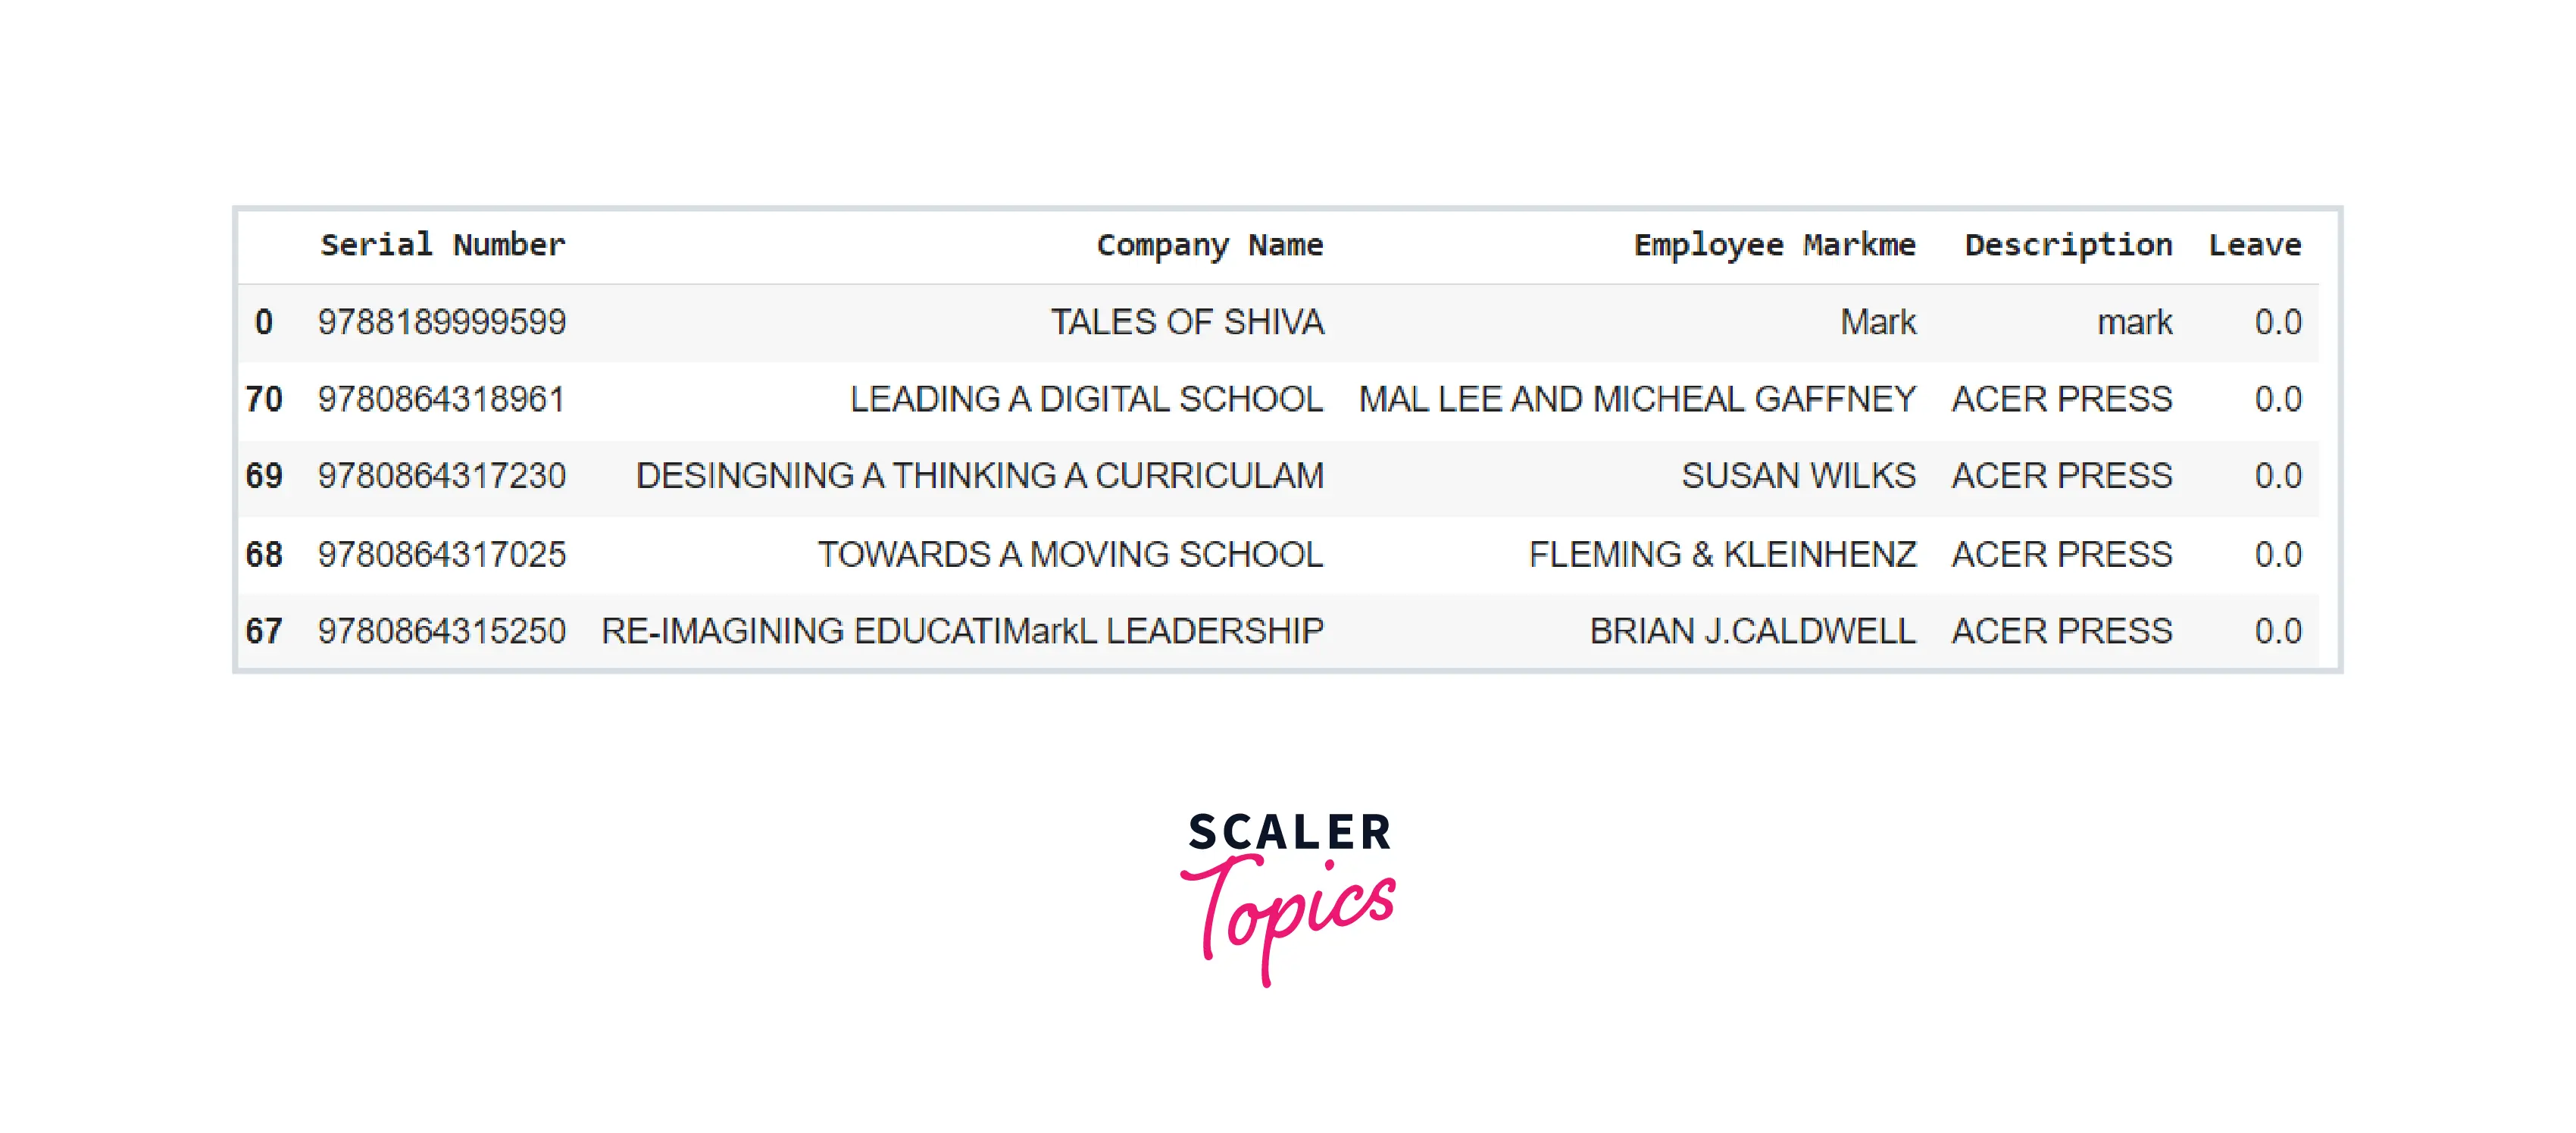
We discovered that two rows in Employee Markme are NAN, thus we will fill them with 'Mark.' Let's start by determining which two records include NAN.
Code:
Output:
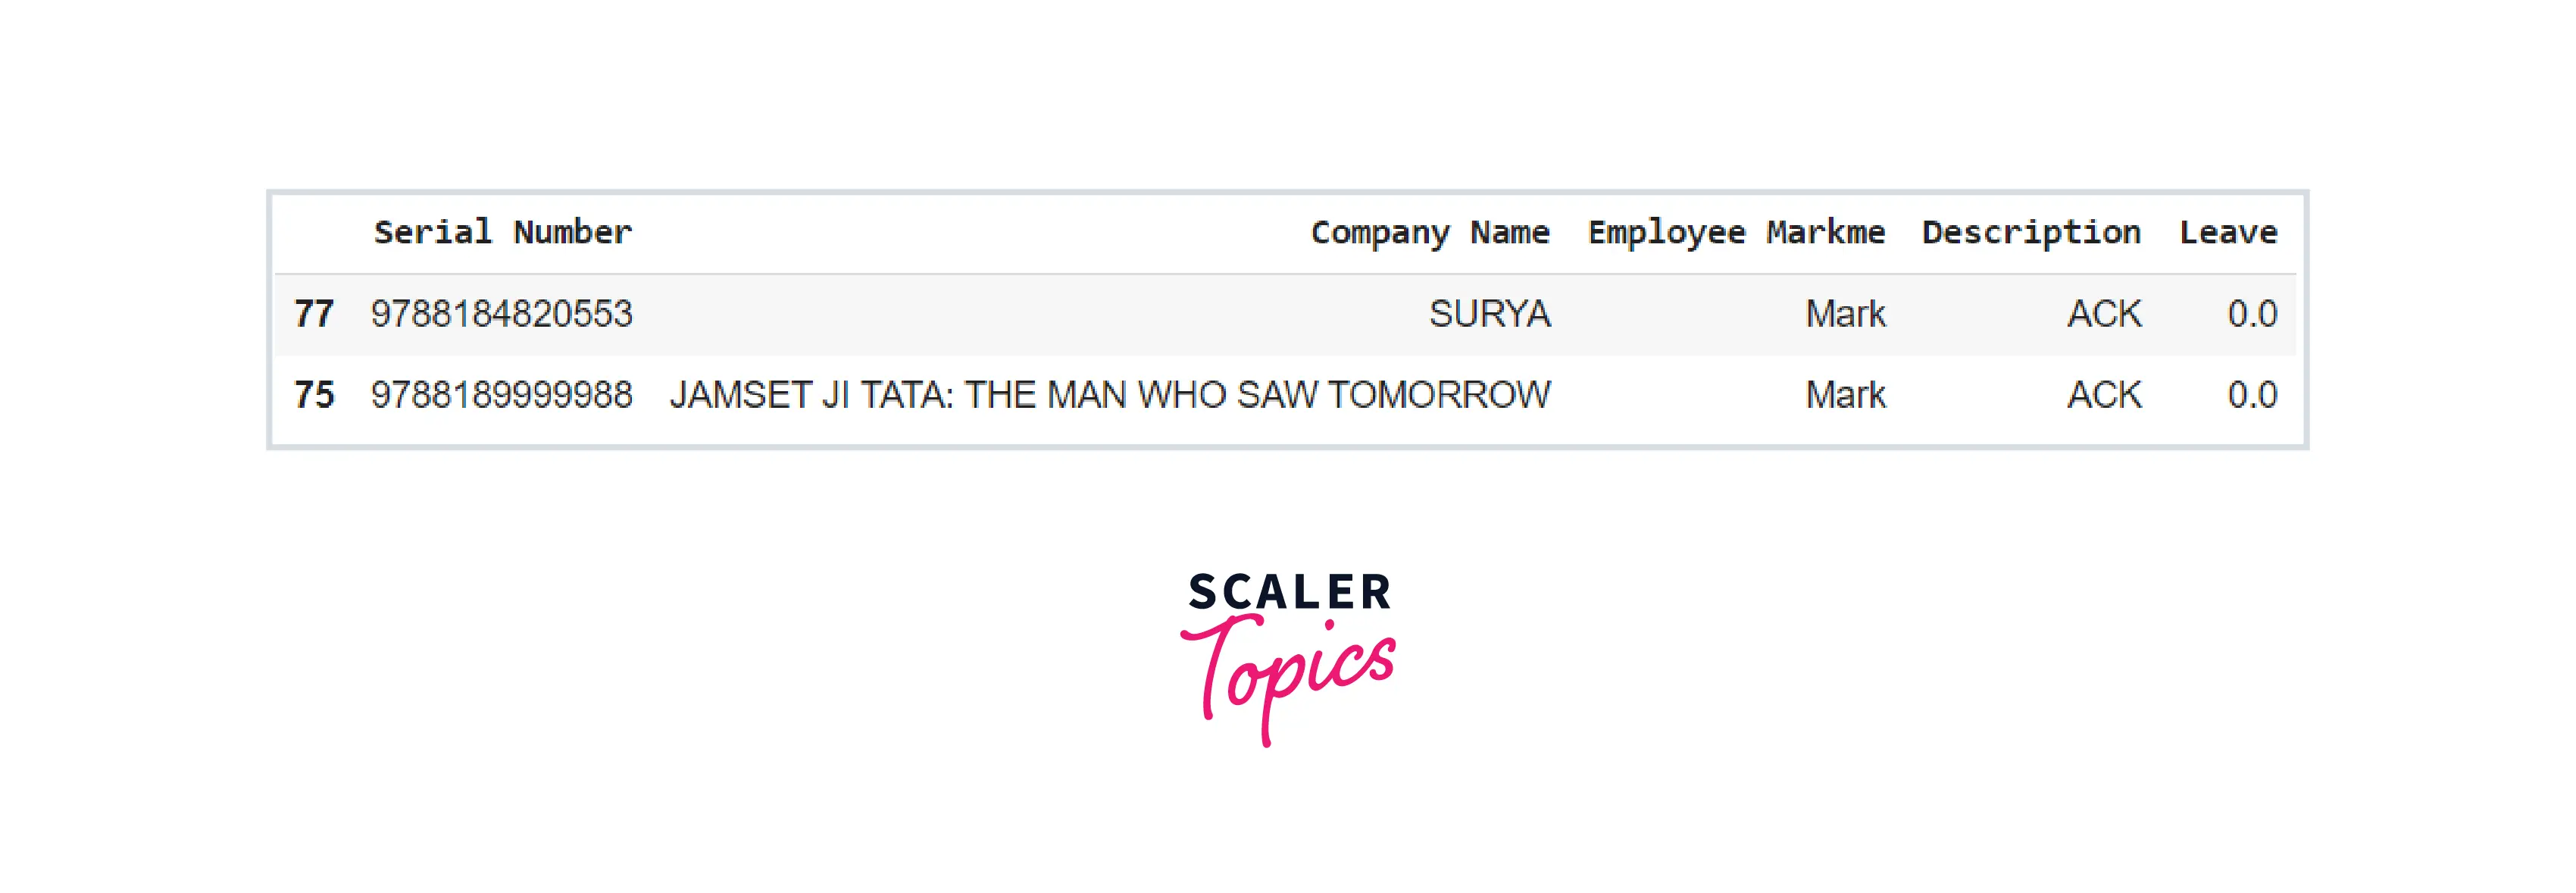
Now that we've identified the NAN entries in our data, let's populate them with 'Mark.'
Code:
Output:
When it comes to Pandas DataFrame methods, this is only the tip of the iceberg; you can visit the official Pandas Documentation to learn about all of the many functions available to a DataFrame object.
Applications of Pandas DataFrame.
Pandas DataFrame offers a plethora of real-world applications, some of which are:
- Data analysis is always in demand in economics. Economists must be able to analyze data to establish patterns and recognize trends in the way the economy in different areas is developing. DataFrames are extremely useful for accessing and altering data to achieve the intended outcome.
- One of the most significant uses of Pandas DataFrame is the generation of recommendation models. These models are often developed in Python, with Pandas DataFrame being the data handling framework of choice. Pandas DataFrames are well-known for their ability to manage massive volumes of data. And the recommendation system is only possible by learning and processing massive amounts of data. These systems are made feasible thanks to functions like groupBy and mapping.
- Pandas DataFrame's data manipulation skills have played a significant part in accumulating a large quantity of data that has assisted neuroscientists in comprehending patterns observed inside our bodies and the influence of various things on our complete nervous system.
- As Statistics works with a large amount of data, a data-handling framework such as Pandas DataFrame has come in handy in various ways. The functions mean, median and mode are simple and useful for statistical computations. There are many additional sophisticated operations linked with statistics, and pandas DataFrame plays a significant part in them to get flawless results.
- The usage of Pandas DataFrame has made analytics easier than before. Pandas DataFrame, with its incredible data processing and handling capabilities, can handle a website and platform analytics. In addition, Pandas DataFrame's `visualization capabilities are also important in this industry. It not only receives and displays data, but it also assists in applying a variety of functions to the data.
- Pandas DataFrame can also operate with Big Data, which is one of its applications.
Kudos :tada: ! You now have a strong grip on numerous Pandas DataFrame object concepts. You can now experiment with pandas DataFrame objects with ease.
Conclusion
This article taught us:
- A Pandas DataFrame is a two-dimensional data structure made up of rows and columns, similar to an Excel or a Database table
- DataFrame is one of the fundamental data structures, which is the foundation of an Index.
- Our Pandas DataFrame may be accessed, modified, added to, sorted, filtered, and deleted.
- Pandas DataFrame provides a way for dealing with missing values in our database.
- Pandas DataFrame has a wide range of real-world applications. Pandas DataFrame is mostly employed in data analytics. Pandas DataFrame has been chosen as the primary framework to deal with while handling or manipulating data. It is the most often used framework among data scientists.