Frequencies, Seasonality, and Trends| Pandas dataframe.shift()
Overview
In time series analysis we can predict by analyzing the past behavior of the data. Frequencies, Seasonality, and Trends are used in time series to make Predictions based on the analysis of previous data. Pandas shift() function is used to shift the data upward and backward which is helpful to analyze previous and future trends.
Introduction
Whenever we want to shift the data upward, downward, or by some intervals, we use the Pandas.shift() function of pandas. We have to specify the number of intervals by which data needs to shift. It has both optional and required parameters, which are used for shifting the data. Missing values can also be filled by using this function. When working with time-series data, this function is quite useful.
Transform Your Career
Choose from our industry-leading programs designed for career success
Modern Software and AI Engineering Program
Master full-stack development with AI integration

Modern Data Science and ML with specialisation in AI
Advanced data science techniques with AI specialization
Advanced AIML with Specialisation in Agentic AI
Deep dive into AIML with focus on Agentic systems
DevOps, Cloud & AI Platform Engineering
Build and manage AI-powered cloud infrastructure
AI Engineering Advanced Certification by IIT-Roorkee
Premier AI engineering certification from IIT-Roorkee
What is Pandas dataframe.shift()?
The Pandas.shift() function is used to shift the data forward or backward. It shifts the index by the specified number of intervals. The number of shifts across the desired axis to be made is represented by the scalar parameter called the period, which is a requirement for this function.
Syntax
The syntax of the Pandas.shift() function is given as:
Parameters
The Pandas.shift() function have some required and optional parameters, let's take a quick explanation of each parameter one by one:
Required Parameters:
-
periods:
- It is of int type
- It is the number of periods by which data is shifted. It can be positive or negative.
-
axis:
- 0 for rows or index and 1 represents columns. It is by default None.
- The direction in which data is shifted.
Optional Parameter:
-
freq:
- Frequency is represented by the freq parameter. It can be DateOffset or tseries.offsets, timedelta, or str.
- Offset can be used from the tseries module or time rule (e.g. ‘EOM’).
- The index values shift if freq is provided, but the data is not realigned. In other words, if you want to shift while extending the index while keeping the original data, then use freq.
-
fill_value:
- It can be of the object type.
- it is the scaler value that is used when introducing new missing values. The default value is determined by the self's dtype. np.nan is used for numerical data. NaT is used for datetime, timedelta, or other types of data. Self.dtype.na_value is used for extension dtypes.
Turn Learning into Career Growth
Examples:
Code#1:
Output:
Explanation:
In the above code example, Pandas is imported as pd and DataFrame df is created by the pd.DataFrame() function using the dictionary data.
- Shift an Entire Dataframe Using Pandas Shift
There may be situations where you want to move all the records in a Pandas Dataframe, either upward or downward. All of the records in a DataFrame are shifted when we use the .shift() function on the DataFrame itself.
The periods=option, which lets us send in an integer, is one of the arguments for Pandas .shift() function. The integer specifies how many periods the data should be shifted.
When positive, the integer passed into the periods=argument will cause the data to be shifted downward. The data are shifted upward if the argument is negative.
Let's try to use Pandas in the following examples to move our records down one row:
Code#2:
Output:
Explanation:
Here, the whole dataframe is shifted by the 1 period i.e. DataFrame is shifted one row down by setting the period argument 1 using the df.shift() function.
Code#3:
Output:
Explanation:
In the above code example, the data is shifted in the upward direction by setting the period argument negative i.e. -1.
Code#4:
Output:
Explanation:
In this example, the whole DataFrame is shifted by 3 rows in a downward direction as we set the value of the period argument 3.
- Shifting Dataframe Row Values with Pandas Shift
In Pandas, we can shift the row values of DataFrame by applying the pandas.shift() function to a pandas series (i.e., a column), instead of applying it to the whole DataFrame.
By using the examples below, let's see how to do this:
Code#5:
Output:
Explanation:
In the code example, a new column Shifted_Age is created. The Age column is shifted downward by the 1 period i.e by one step using pandas shift() function and after shifting the result is stored in a new column i.e. shifted_Age.
Code#6:
Output:
Explanation:
Here, the salary column is shifted downward by the 1 record, the same as the Age column is shifted in code#5. The result is stored in a new column i.e. Shifted_Salary.
Whenever we are shifting our data, we will find missing values in our DataFrame. Let's see how to fill in these missing values.
- Fill Missing Values When Using Pandas Shift
When the data is moved from some interval then pandas DataFrame contains some missing values. To remove the missing value we use the fill parameter of Pandas shift() function. We can pass any value inside the fill argument, with which we want to change or relocate our missing value.
Code#7:
Output:
Explanation:
In code#6, the Salary columns are shifted by one record. After shifting we get our DataFrame with missing or NaN value.
- Shifting Timeseries Data with Pandas Shift We can also shift the data which is based on time series using the pandas shift function. It allows us to do Complex shifting of data based on various periods.
Code#8:
Output:
Explanation:
In the above example, we are creating a DataFrame consisting of Date and Stocks_Amount with index as the date.
Code#9:
Output:
Explanation:
In this example, we set the value of frequency 3 days i.e freq=3d inside the pandas shift() function and we can see that there is the addition of 3 days in each of the Dates values. So, here the time series is shifted. We can also subtract days using the same parameter. For this, we only have to pass the negative value of frequency inside the shift() function.
- Shift Pandas Dataframe Columns with Pandas Shift.
In this section, we will learn how to shift the columns of the DataFrame using the pandas shift() function. As axis 1 represents the columns of the DataFrame so, we will use the axis argument to shift the columns. After shifting, all columns will get shifted by some steps(i.e by how many periods we want to shift data) the names of the columns remain the same.
Code#10:
Output:
Explanation:
In this example, We set the value of period=1 and also define the axis i.e axis=1, here 1 value of the axis represents the columns of the DataFrame. After using the pandas shift() function with these parameters, the whole DataFrame is shifted by one column. That mean's all the columns of the DataFrame get shifted by the no of steps assigned to the period argument, but the names of the columns are not changed.
- Calculate the Difference Between Consecutive Rows in Pandas Sometimes, we may want to calculate the difference between the adjacent rows of the Pandas DataFrame. Let's see how we can calculate the difference Between Consecutive Rows in Pandas with the help of the following examples:
Code#11:
Output:
Explanation:
Here, we are calculating the difference between the consecutive columns. In the above code, the Salary column is shifted by one record downward, and the missing value that we get after shifting is filled with 0 using fill_value, this Shifted_Salary get subtracted from the original Salary.
Frequencies in Time Series Data
When the data points of a time series are uniformly spaced in time (e.g., hourly, daily, monthly, etc.), the time series can be associated with a frequency in pandas.
Code#12:
Output:
Explanation:
In the above code example, after passing the starting and ending date with freq-D i.e. days frequency inside the date_range() method, the data of days created within these dates.
Code#13:
Output:
Explanation:
Here, we set the freq parameter as H i.e hours frequency with periods=10. As a result Data of 10 hours of the specified date is created.
Seasonality in Time Series Data
When data in a time series undergoes predictable changes regularly that repeat themselves every year, this is referred to as seasonality. Cycles that repeat consistently across time are known as seasonal variations or seasonality. Seasonal variation is the word used to describe recurring patterns within any given period, however, it is most commonly used to describe patterns that repeat within each year.
There are many different kinds of seasonality, such as:
- Date and Time.
- Daily.
- Weekly.
- Monthly.
- Yearly.
As a result, it is difficult to say for sure whether your time series problem contains a seasonality component. Plotting and reviewing your data, possibly using different scales and the insertion of trend lines, is the quickest way to determine whether there is a seasonal component.
The CSV file used in the below example is github link
Code#14:
Output:
Explanation:
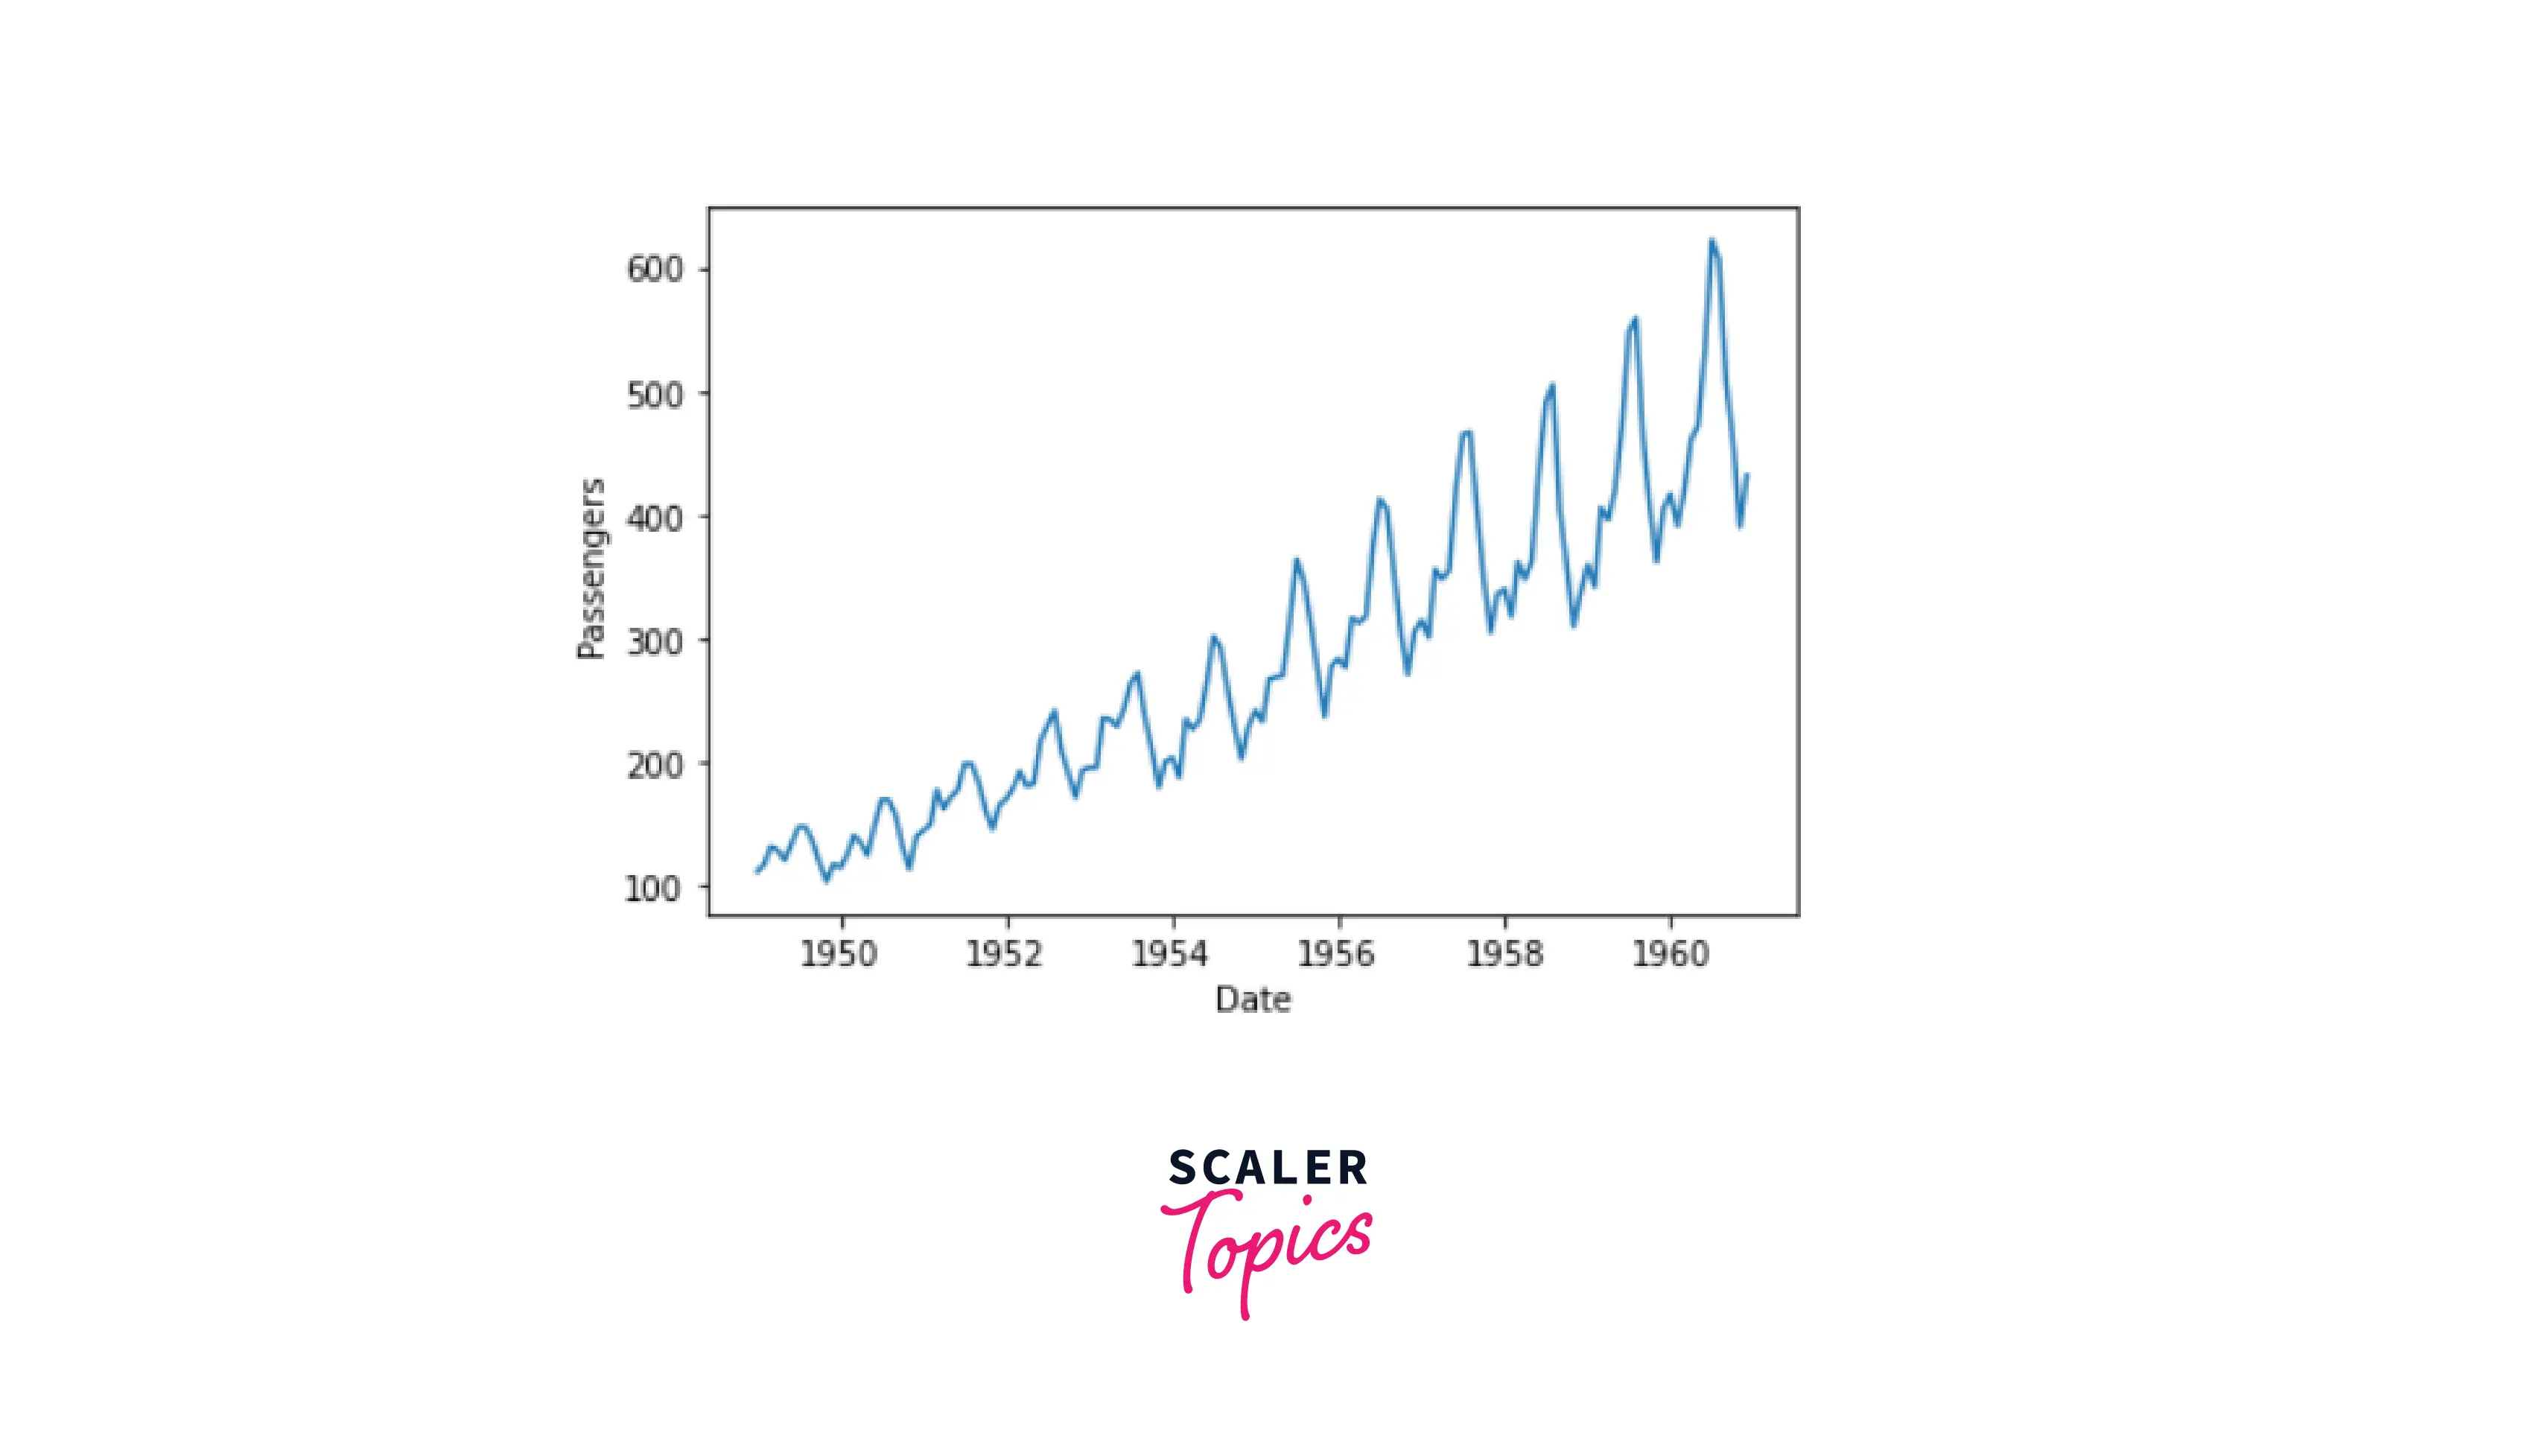
In the above code example, pandas are imported as pd and matplotlib.pyplot is imported as plt for graphical representation. Month is set as the index for the data and it is easy to detect the yearly seasonal pattern where the number of passengers rises in the summer. Also, there has been a general increasing trend in passenger numbers throughout time.
Trends in Time Series Data
A trend is a pattern in data that demonstrates the movement of a series to comparatively higher or lower values over an extended period. In other words, a trend is seen when the time series has a positive or negative slope. Trends usually happen for a while before disappearing; they do not continue. For instance, a new movie may come, become popular for a period, and then disappear. There is a good chance that it will become popular once more.
The trend can be of three types:
- Uptrend: If a time series analysis shows an overall upward trend, that pattern is considered to be an uptrend.
- Downtrend: When a pattern in time series analysis is downward, it is considered to be a downtrend.
- Horizontal or stationary trend: If there is no pattern visible, the trend is said to be horizontal or stable.
Let's see some examples below for an understanding of trends:
Code#15:
Output:
Explanation:
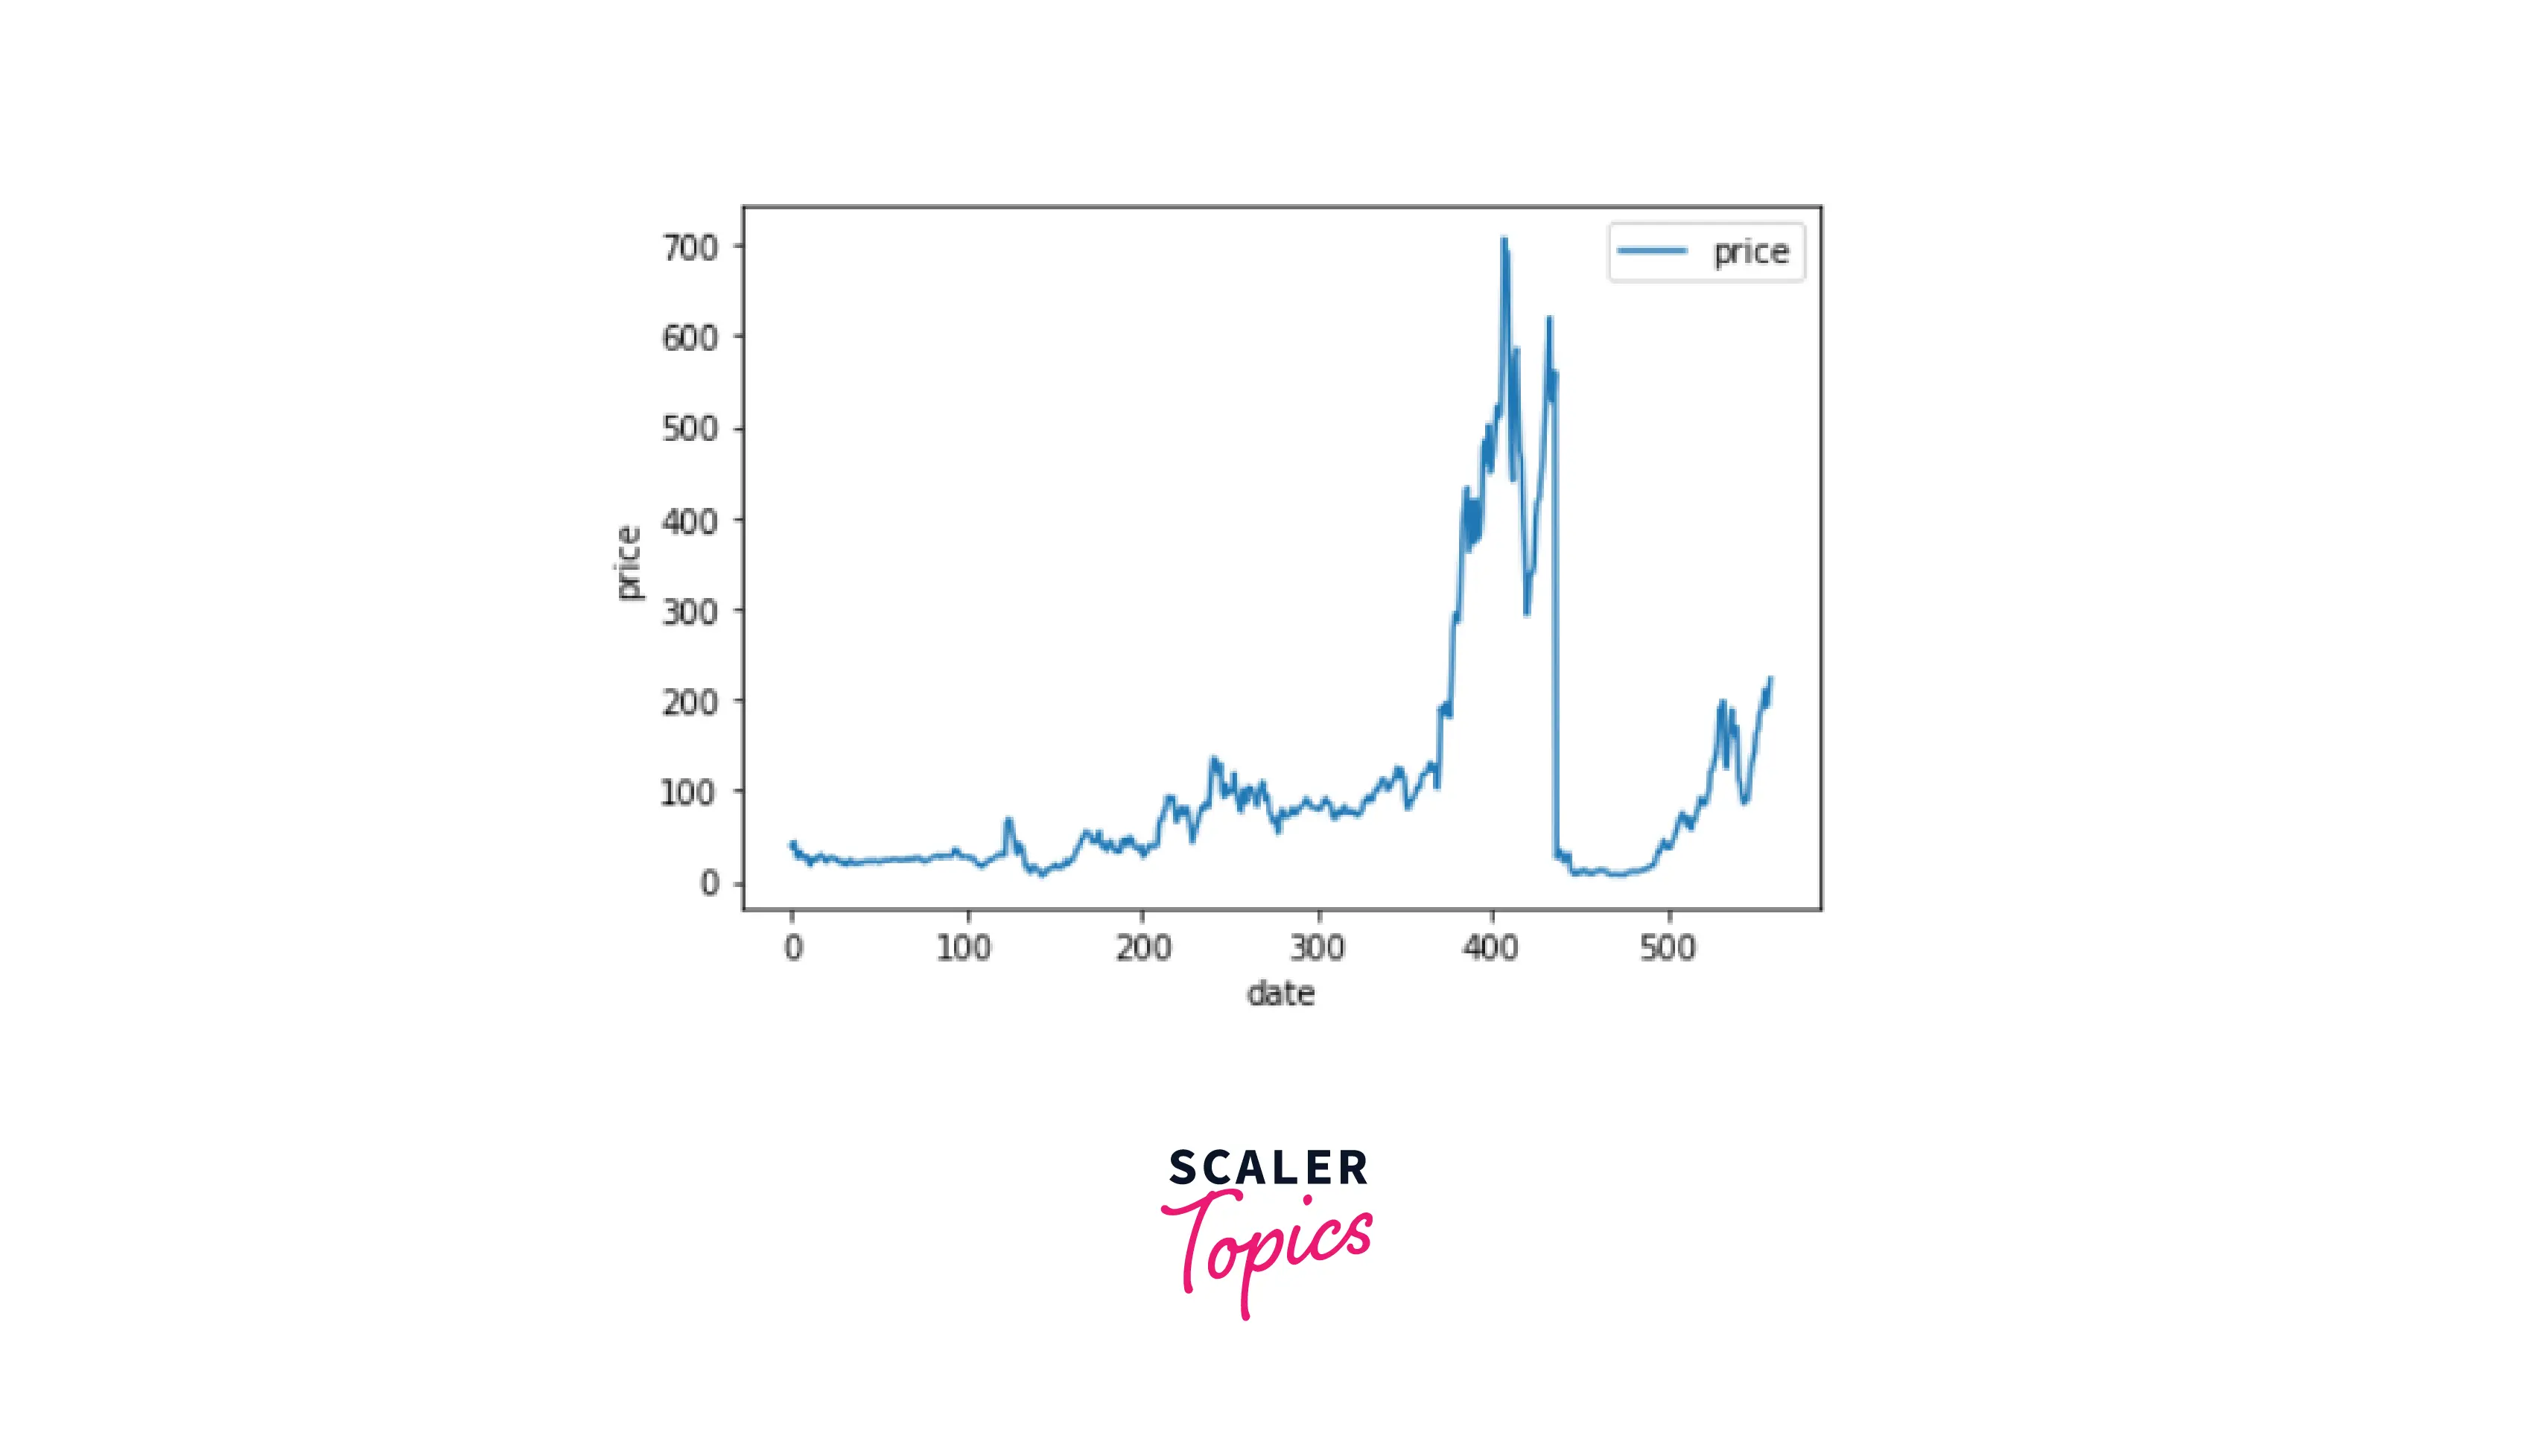
In the above example, Pandas is imported as pd, and the matplotlib.pyplot library of python is imported as plt for a graphical representation of the data. The CSV file used in this example is github link. Here, the CSV file is loaded using read_csv() method of pandas.
Code#16:
Output:
Explanation:
Here, we can see in the graph, how the price is varying with the date. This shows the increasing and decreasing trends of the data.
Code#17:
Output:
Explanation:
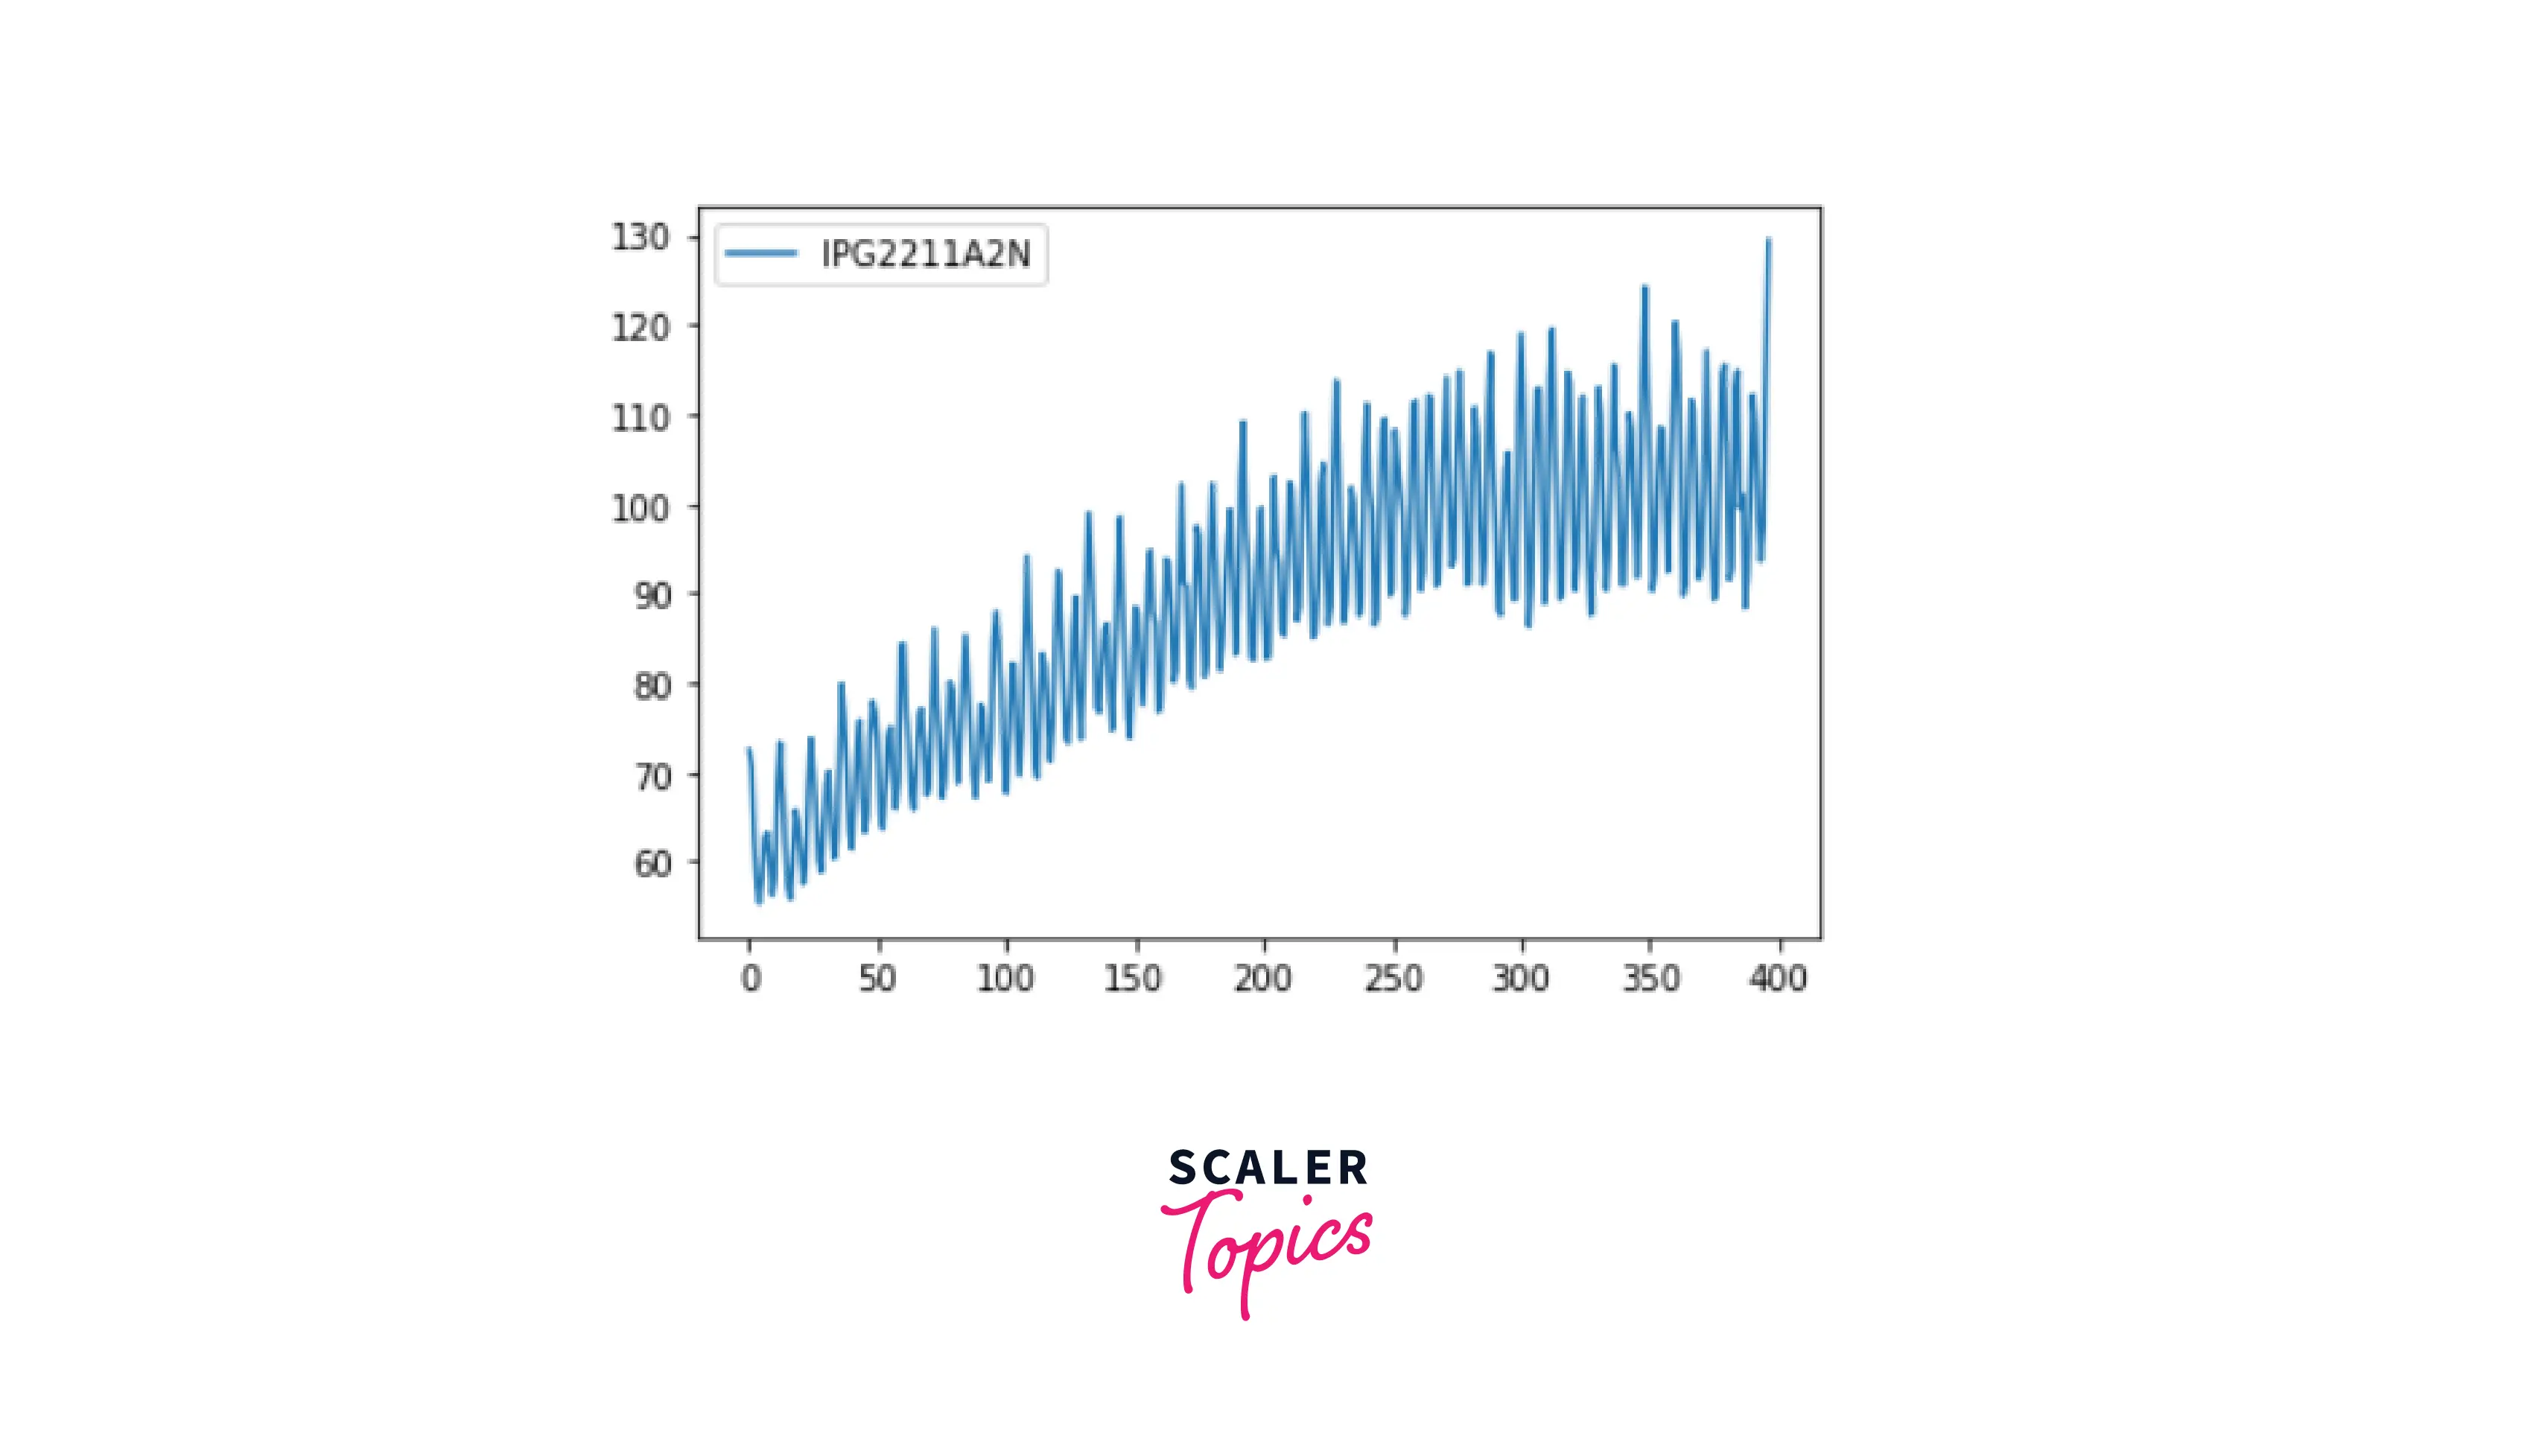
The CSV file used in this example is github link. Here, the CSV file is loaded using read_csv() method of pandas. The .head() is used to print the first 5 columns by default as none of the values is given inside the .head() function.
Code#18:
Output:
Explanation:
In this example, we can see that the graph is increasing which means an increasing trend in the graph i.e. upward trend.
Conclusion
- The pandas shift() function is used to shift the data of the DataFrame.
- To shift the data by some periods, the parameter periods is used.
- By using pandas shift() function, missing values in the data can be filled with the fill_value argument.
- Instead of shifting whole data, rows can be shifted using the name of the columns, and the axis parameter is used to shift columns because axis=1 represents columns.
- The pandas shift() function is also useful to shift the time series data.
- We can also calculate the difference between two consecutive rows.
- When the data is spaced uniformly in time series, this is known as frequency.
- We can use the freq parameter to specify the frequency. Frequency can be in days and represented as D, hours as H etc.
- When the data undergoes some predictable changes or repeats consistently across time, this behavior is known as seasonality.
- Trends in time series are the pattern that shows the movement over a long period.
- There are three types of trends, uptrend, downtrend, and horizontal trend.