Panel in Pandas
Overview
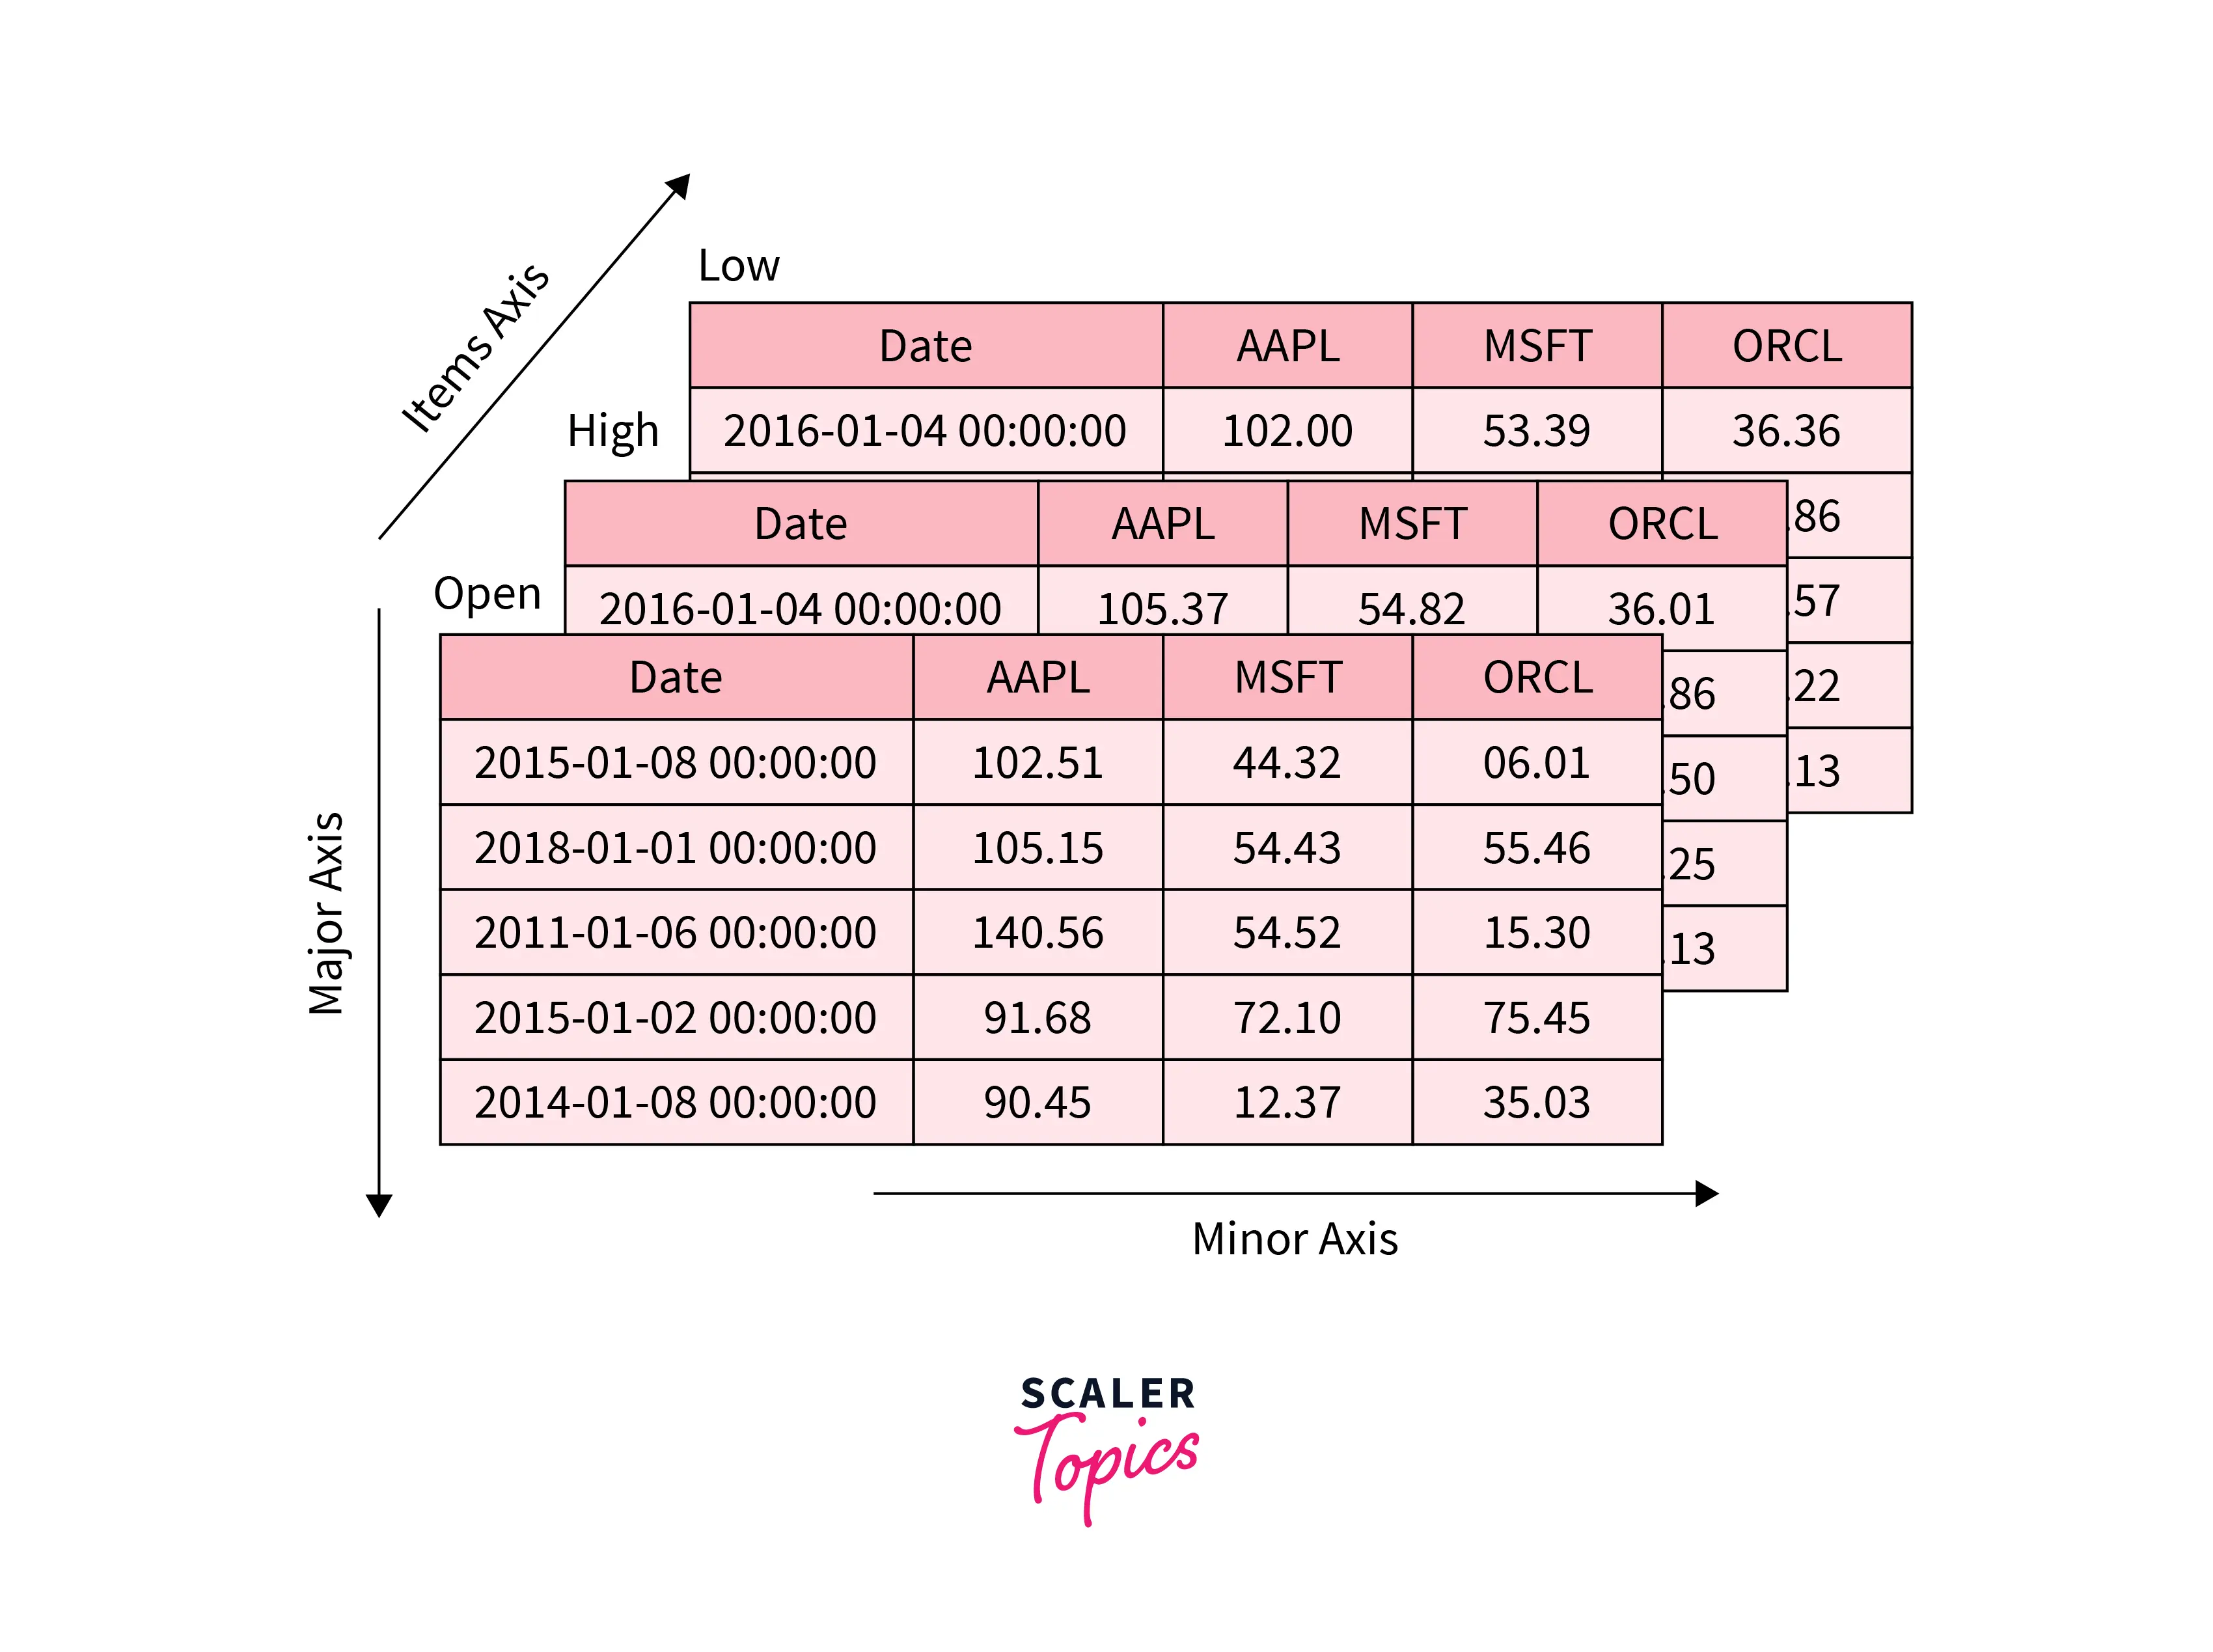
The Panel in Pandas is used for working with three-dimensional data. It has three main axes these are items is the 0 axis which corresponds to the data, major-axis is the axis 1 for rows, and minor-axis is the axis 2 for columns. A panel can be created by using the pandas. panel() function.
Introduction
The panel in pandas is a three-dimensional container of data. To create a panel, we can use ndarrays(multidimensional arrays) and a dictionary of DataFrames(one of the Pandas 2-D data structures that contain data in the tabular form of rows and columns). We can also extract data from panels using different methods.
What is Pandas.panel() ?
The panel is an important container for three-dimensional data in Pandas derived from econometrics and is partially responsible for the name pandas as 'pan(el)-da(ta)-s'. The labels for the three axes are meant to have some semantic value, to illustrate operations using panel data. They are:
- items :
This is axis 0 which corresponds to the DataFrame in each item. - major_axis :
This is axis 1 for index rows. - minor_axis :
minor axis is the axis 2 for columns. Each column is DataFrame.
The panel can be created using pandas.Panel() . The proper syntax of the function is as follows.
Parameters:
- data :
Data represented by Panel. Its value can be a ndarray, map, series, dict, and another DataFrame. - items :
A DataFrame in each item is represented by the axis 0. - major_axis :
The index(rows) of DataFrame is represented by axis 1. - minor_axis :
The columns of each DataFrame are represented by axis 2. - copy :
This is the boolean value that depicts whether the data is copied from the inputs or not. It is False by default. - dtype :
It specifies the datatype of each column of DataFrame.
How to Create a Panel in Pandas?
Before starting with Panel, it's important to know that Panel is not supported by the Pandas version that is above 0.25. If we run the panel program on the pandas latest version, then it will throw an error like AttributeError: module 'pandas' has no attribute 'Panel' So, it's necessary to install the pandas version below 0.25 before running any Panel program.
Steps to install pandas version less than 0.25 :
- Step - 1 :
Uninstall Pandas using command pip uninstall pandas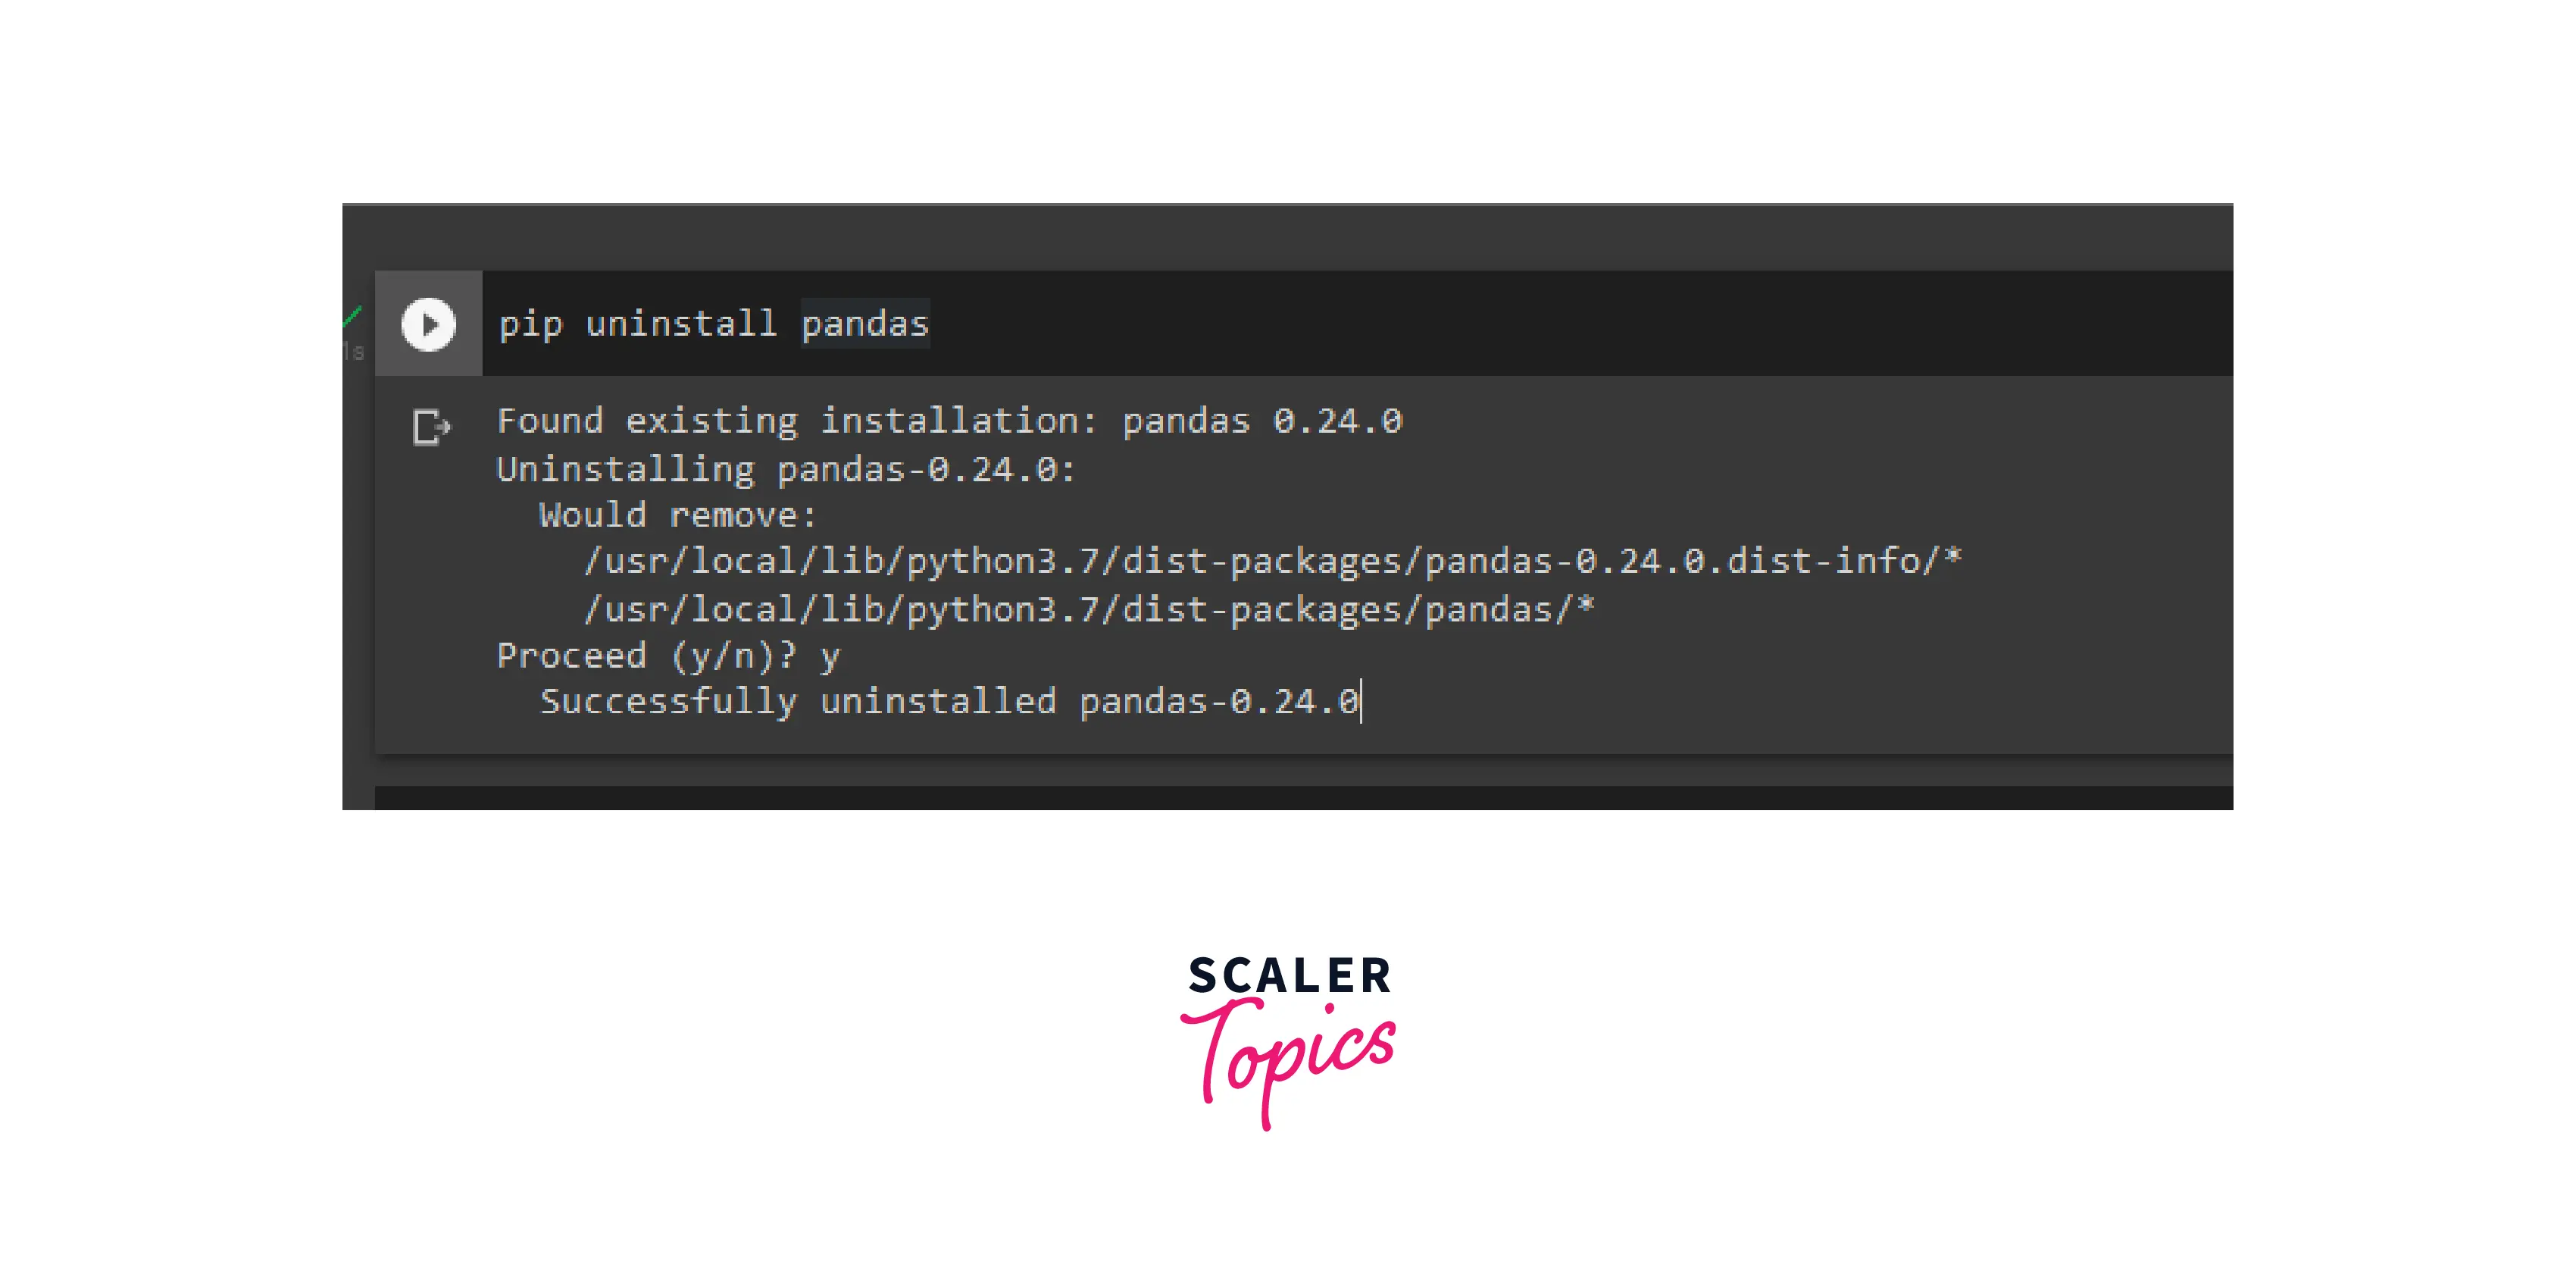
- Step - 2 :
Install pandas by typing command pip install pandas=0.24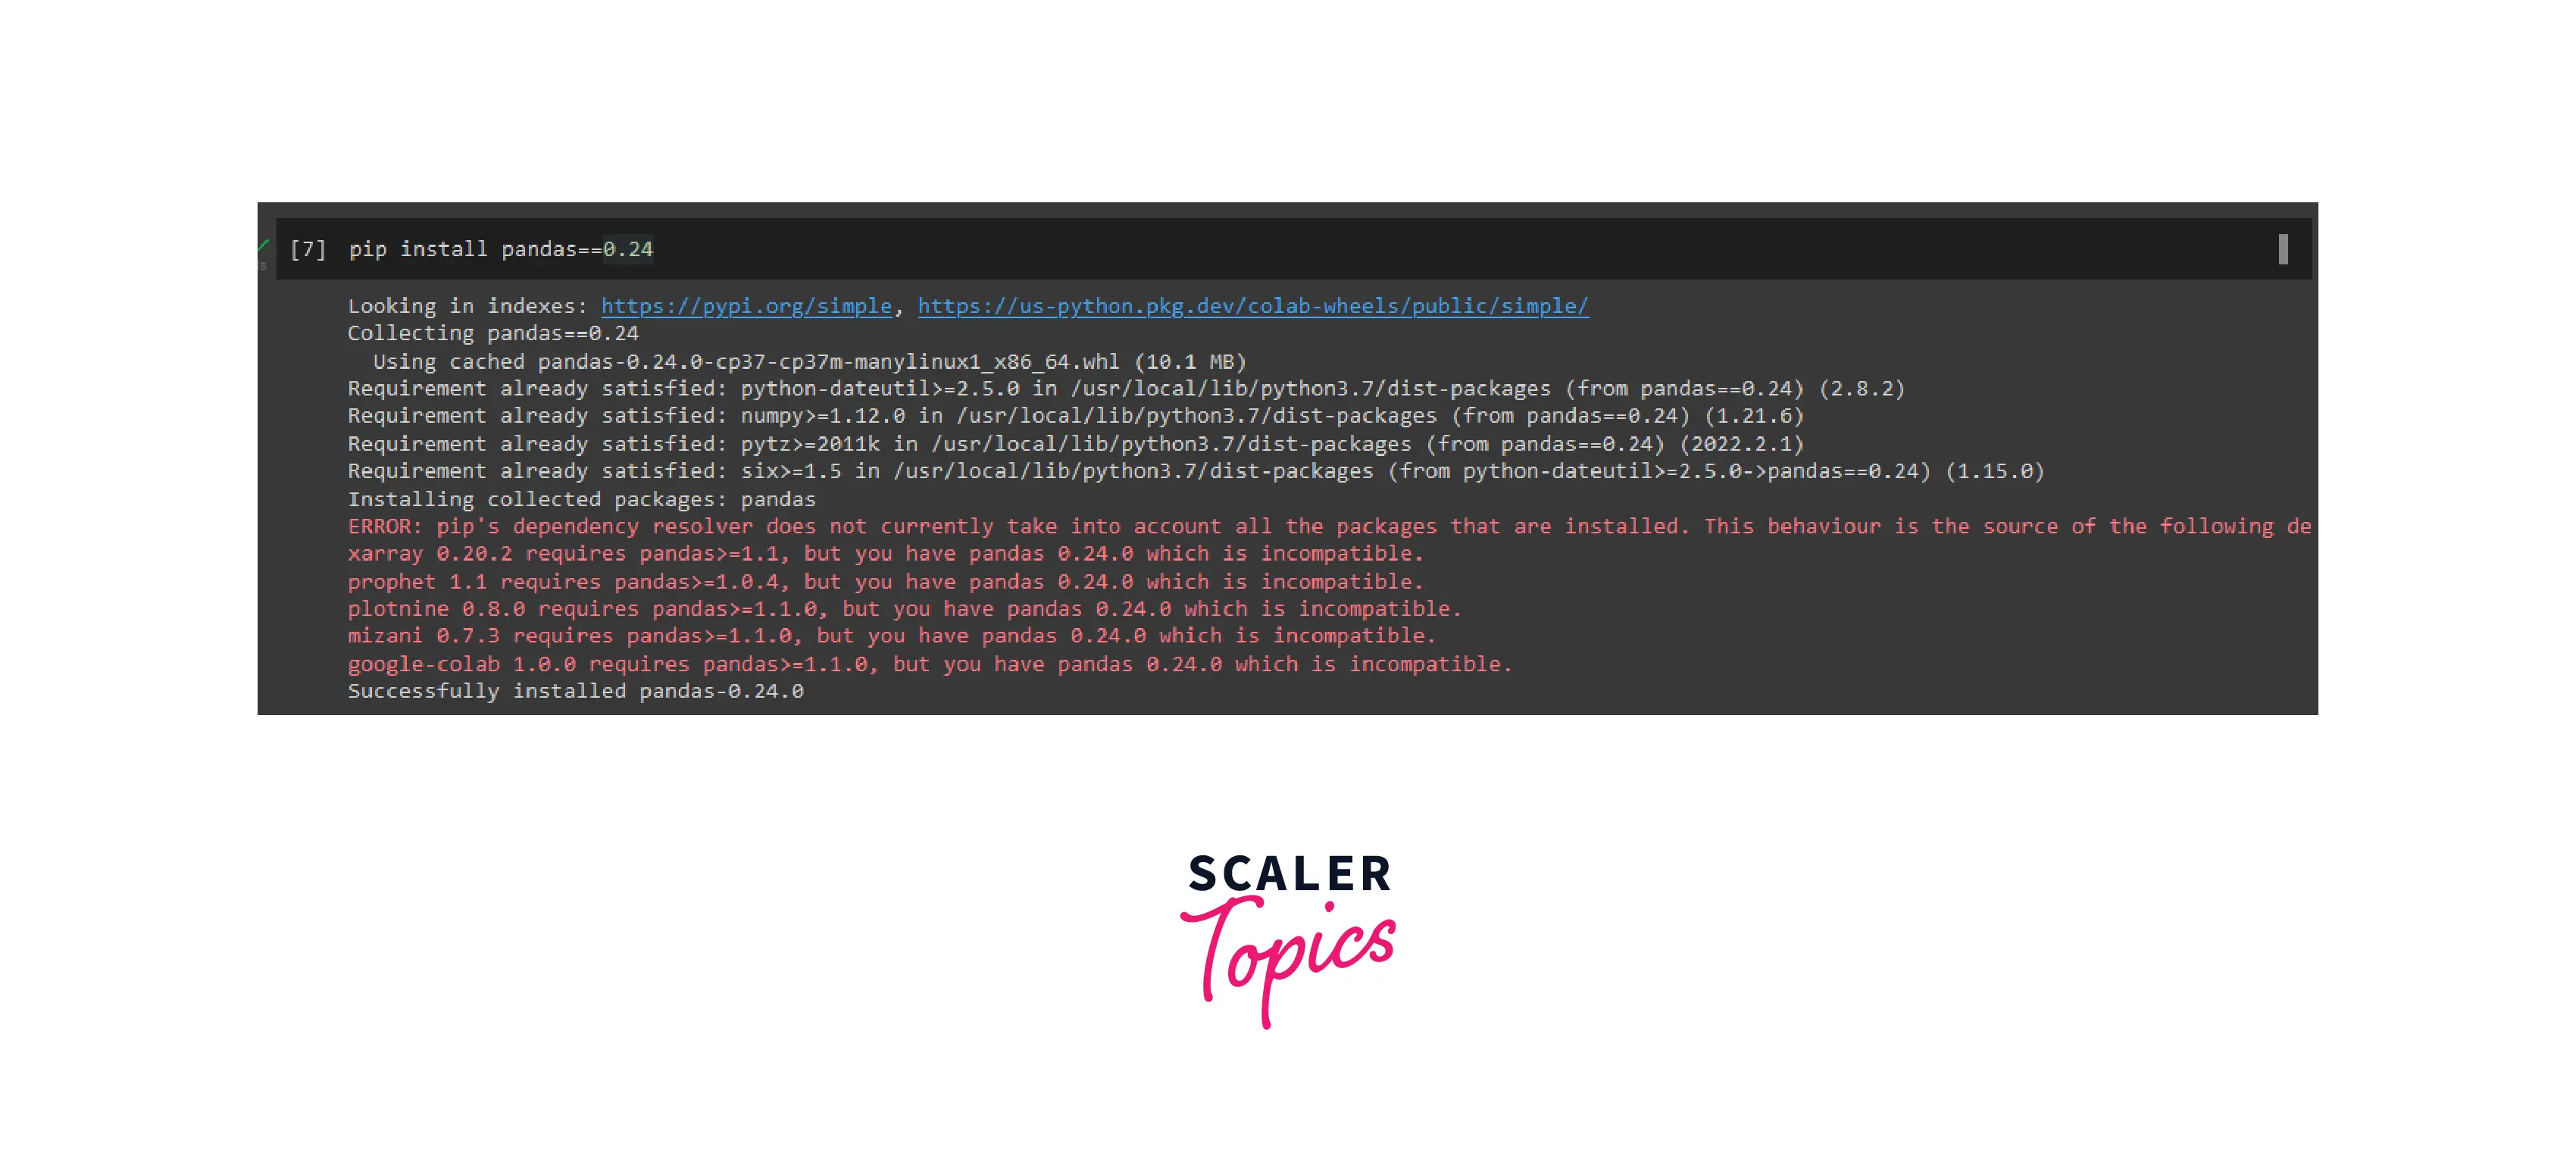
There are several ways to create a panel in Pandas as follows:
- Creating panel from ndarrays
- Creating a panel from the dict of DataFrames
Let's discuss one-by-one the above methods with examples.
Transform Your Career
Choose from our industry-leading programs designed for career success
Modern Software and AI Engineering Program
Master full-stack development with AI integration

Modern Data Science and ML with specialisation in AI
Advanced data science techniques with AI specialization
Advanced AIML with Specialisation in Agentic AI
Deep dive into AIML with focus on Agentic systems
DevOps, Cloud & AI Platform Engineering
Build and manage AI-powered cloud infrastructure
AI Engineering Advanced Certification by IIT-Roorkee
Premier AI engineering certification from IIT-Roorkee
From ndarrays
We can create a panel by using the ndarrays. Let's see with the help of below code example :
Code :
Output :
Explanation :
In the above code example, pandas are imported as pd and NumPy as np. Using np.random.rand() an 3-d array is created. A panel is created with pd.panel().Here, we passed some int parameters inside the np.random.rand() function as np.random.rand(1,3,2), which means the 1st axis is 1 and contains an array of 3 rows and 2 columns.
From dict of DataFrames
DataFrames. Let's see with the help of the example given below :
Code :
Output :
Explanation:
In this code example, a dictionary "data" of DataFrames with NumPy arrays of 2 items are created. Here np.random.randn(2, 4) is used to create a random array of 2 rows and 4 columns, and np.random.randn(3, 2) is used to create the random array of 3 rows and 2 columns.
Create an Empty Panel
It is possible to create an empty panel by using the .panel() function of pandas. Let's implement this in the below code example :
Code:
Output:
Explanation:
In the above example, we created an empty array by passing nothing inside the pd.panel() function.
Getting Data from the Panel with Pandas
We can extract the data from the panel by using the following 3-axes of the Panel by:
- items
- major-axis
- minor-axis
Let's see how to use these methods.
Turn Learning into Career Growth
Items
Item is the 0th axis of the panel. We can get data from the panel by using items. Let's see with the help of the following examples :
Code:
Output:
Explanation:
Here, we are extracting data using items. As the above code contains 2 items, data1 and data2, So, with the help of the names of the items, we get the desired data.
Scaler Placement Report and Statistics
Scaler learners achieved 2.5x salary growth with average post-Scaler CTC reaching ₹23L.
Major_axis
Major_axis is the 1st axis of the Panel. The rows of each column of the data are represented by a major axis. We can get the data from the panel by specifying which axis we want to extract using the major_xs() method. Let's see use this with the help of the following examples :
Code :
Output:
Explanation:
Here, we can see in the output that panel data has 2 items, 4 major axes, and 3 minor axes. Using major_axis() we can extract the data by specifying the axis inside the function.
Scaler Placement Report and Statistics
Scaler learners achieved 2.5x salary growth with average post-Scaler CTC reaching ₹23L.
Minor_axis
Minor_axis is the 2nd axis of the panel. Columns of the DataFrames are represented using this. With the help of this axis, we can extract the data from the column by specifying the axis inside the minor_xs() method.
Code:
Output:
Explanation:
In this code example, data is extracted from the minor axis by using the .minor_xs(1) function. We have to specify the axis inside the function which data we want.
Deletion of Panel Items
Sometimes there is an item that we don't need or that is out of place, so we want to eliminate it to reduce the additional space. By using the del function to delete the desired items without affecting the other items. We can also delete multiple items with the help of the del function.
For deleting the items from the data we just have to specify the item which we want to delete. Let's see with the help of the example given below :
Code - 1:
Output:
Explanation:
In the above code, a panel is created using a random numpy array with items A and B. By using data[B], data of item B is printed.
Now, let's delete item B by using the del function in the following code :
Code - 2:
Output:
Explanation:
In this example, when we call for the print['B'], the data of item 'B' is printed as output, but after deleting item 'B' using the del function, item 'B' gets deleted, and then again we try to print the item 'B' we get an error because it's deleted from the data.
Code:
Output:
Explanation:
In the above code, We created a panel with a dictionary of two items Data1 and Data2, after deleting both the items i.e., Data1 and Data2 from the panel using the del function, we are having 0 items.
Panel Transpose
Transpose is one of the most important functions of data manipulation. The axes of the panel in Pandas can be switched between each other using the .transpose() function according to your needs like we can interchange axis 1 with axis 3, axis 0 with 1, etc. Whenever the data sets need to be moved around frequently, we can use the transpose function.
Let's understand with the help of an example given below.
Code:
Output:
Explanation:
Here, to transpose the data, the .transpose() function is used. Inside the transpose function, we have to specify the desired result as we want our data to be manipulated. We can see that in the initial data we have 2 items, 4 major axes, and 3 minor axes. After passing 2,0, and 3 inside the transpose function, the data is manipulated as 3 items, 2 major axes, and 4 minor axes, i.e., the 3rd dimension(represented by 2) becomes the 1st dimension, the 2nd dimension(represented by 1) becomes the 3rd dimension, and the 1st dimension(represented by 0) becomes the 2nd dimension in this example. Dimensions are represented as index values, Dimension 1 has an index of 0, the 2nd dimension has an index of 1, and so on.
Examples
Let's see some more examples of panels for a better understanding. In the following example, we are creating a panel from the random array.
Code - 1:
Output:
Explanation:
In the above code example, pandas are imported as pd, and NumPy is imported as np. A random 3-D array is passed inside the pd.panel() function for creating a panel and stored in the data variable.
In the following example, we will see how to use the .shape method to find the shape of the panel.
Code - 2:
Output:
Explanation:
In the above code by using .shape, we are checking the shape of the Panel.
Code:
Output:
Explanation:
In this example, we are checking the shape of the item in the panel using .shape, by specifying the item name.
In the following 3 and 4 examples, we will see how to find the size of the panel using the .size method.
Code - 3:
Output:
Explanation:
In this code example, Panel df is created from the dictionary of Dataframes. By using .size, we get the size of the panel as 24.
Code - 4:
Output:
Explanation:
In the above example, by using the .size function with the item of the panel, we get its size, i.e., 12 as an output.
In the following example, we are creating a panel using a dictionary.
Code - 5:
Output:
Explanation:
In the above example, a panel is created from the dictionary using the pd.Panel.from_dict() function, orient is the parameter of this function which is used for the orientation of the data, and it uses minor for using DataFrames columns as panel items. By using the .add() function, values of the key Age is added to the Age column of the Panel.
Conclusion
- Panel in Pandas is an important container for 3-D data.
- Thepandas.Panel() function is used to create the Panel in Pandas.
- Panel in Pandas can be created from ndarrays and a dictionary of DataFrames. An empty panel in pandas can also be created.
- Items, major-axis, and minor-axis are used for the extraction of data from the panel.
- We can also perform a deletion operation on the panel using the del function.
- The .transpose() function can also be used to manipulate the data axis in a panel.