Pivot Tables in Pandas
Overview
A pivot table in Pandas is a quantitative table that summarizes a large DataFrame, such as a large dataset. It is a component of data processing. In pivot tables, the report may include average, mode, summation, or other statistical elements. Pivot tables were originally linked with Microsoft Excel. However, they may also be created in Python employing Pandas.
Introduction
Before we begin, we will assume that you have successfully installed Python on your system and are familiar with the foundations of the Pandas library.
Pandas has grown in popularity among data scientists as a platform for analyzing and altering data. Pandas is a fairly fundamental and flexible language with which we are all acquainted. It provides numerous useful features to assist us in transforming data into the desired format. One of them is named pivot_table, and it summarizes the values of a feature in a nice DataFrame. Let's see how we employ it, though.
Pandas.pivot_table()
Pivot tables in Pandas allow users to examine subsets of data depending on indexes and values. Values are organized by index and provided to the user. The syntax for the Pandas.pivot_table() function is as follows:
Syntax
pandas.pivot_table(data, values=None, index=None, columns=None, aggfunc=’mean’, fill_value=None, margins=False, dropna=True, margins_name=’All’, observed=False)
Transform Your Career
Choose from our industry-leading programs designed for career success
Modern Software and AI Engineering Program
Master full-stack development with AI integration

Modern Data Science and ML with specialisation in AI
Advanced data science techniques with AI specialization
Advanced AIML with Specialisation in Agentic AI
Deep dive into AIML with focus on Agentic systems
DevOps, Cloud & AI Platform Engineering
Build and manage AI-powered cloud infrastructure
AI Engineering Advanced Certification by IIT-Roorkee
Premier AI engineering certification from IIT-Roorkee
Parameters
It requires the following set of parameters:
| Sr. No | Parameter Name | Parameter Description |
|---|---|---|
| 1 | data | It requires a Pandas DataFrame or the database from which the pivot table is to be created. |
| 2 | values | It is a purely optional parameter. It is used to indicate which Column's statistical summary should be displayed. |
| 3 | index | It specifies the Column that will be employed to index the feature specified in the values parameter. If an array is supplied as a parameter, it must be of a similar length as the Dataset. |
| 4 | columns | It is used to aggregate information based on specified column characteristics. |
| 5 | aggfunc | It specifies the set of functions that must be executed on our DataFrame. |
| 6 | fill_value | It is used to supply a value in the DataFrame to substitute missing data. |
| 7 | margins | It only accepts Boolean values and is initially set to False. If set to True, it adds all rows and columns to the resulting pivot table. |
| 8 | dropna | It can only take Boolean values and is set to True by default. It is employed to delete all NaN values from DataFrame, including any. |
| 9 | margins_name | When the margins option is set to True, it is employed to define the title of the row/column that will hold the statistics. |
| 10 | observed | It only takes Boolean values. This option applies solely to category characteristics. If it is set as 'True,' the DataFrame will only display data for categorical groupings. |
Scaler Placement Report and Statistics
Scaler learners achieved 2.5x salary growth with average post-Scaler CTC reaching ₹23L.
Return Value
It is employed to generate a DataFrame with an excel-style pivot table. The levels in the pivot table will be saved as MultiIndex objects on the resultant DataFrame's index and columns.
Pivot Table in Pandas with Python
One of Excel's most powerful features is pivot tables. A pivot table helps us to extract information from data. Pandas has a method named pivot_table() that is comparable. Pandas pivot_table() is a simple method that may quickly provide highly strong analyses. Pandas pivot_table() is a must-have tool for any Data Scientist. Let's see how we can make one for ourselves.
How to Create a Pivot Table DataFrame
The pivot table Pandas method is used to perform a pivot on a Pandas DataFrame. Let's create a DataFrame and employ the pivot table pandas method on it.
Code:
Output:
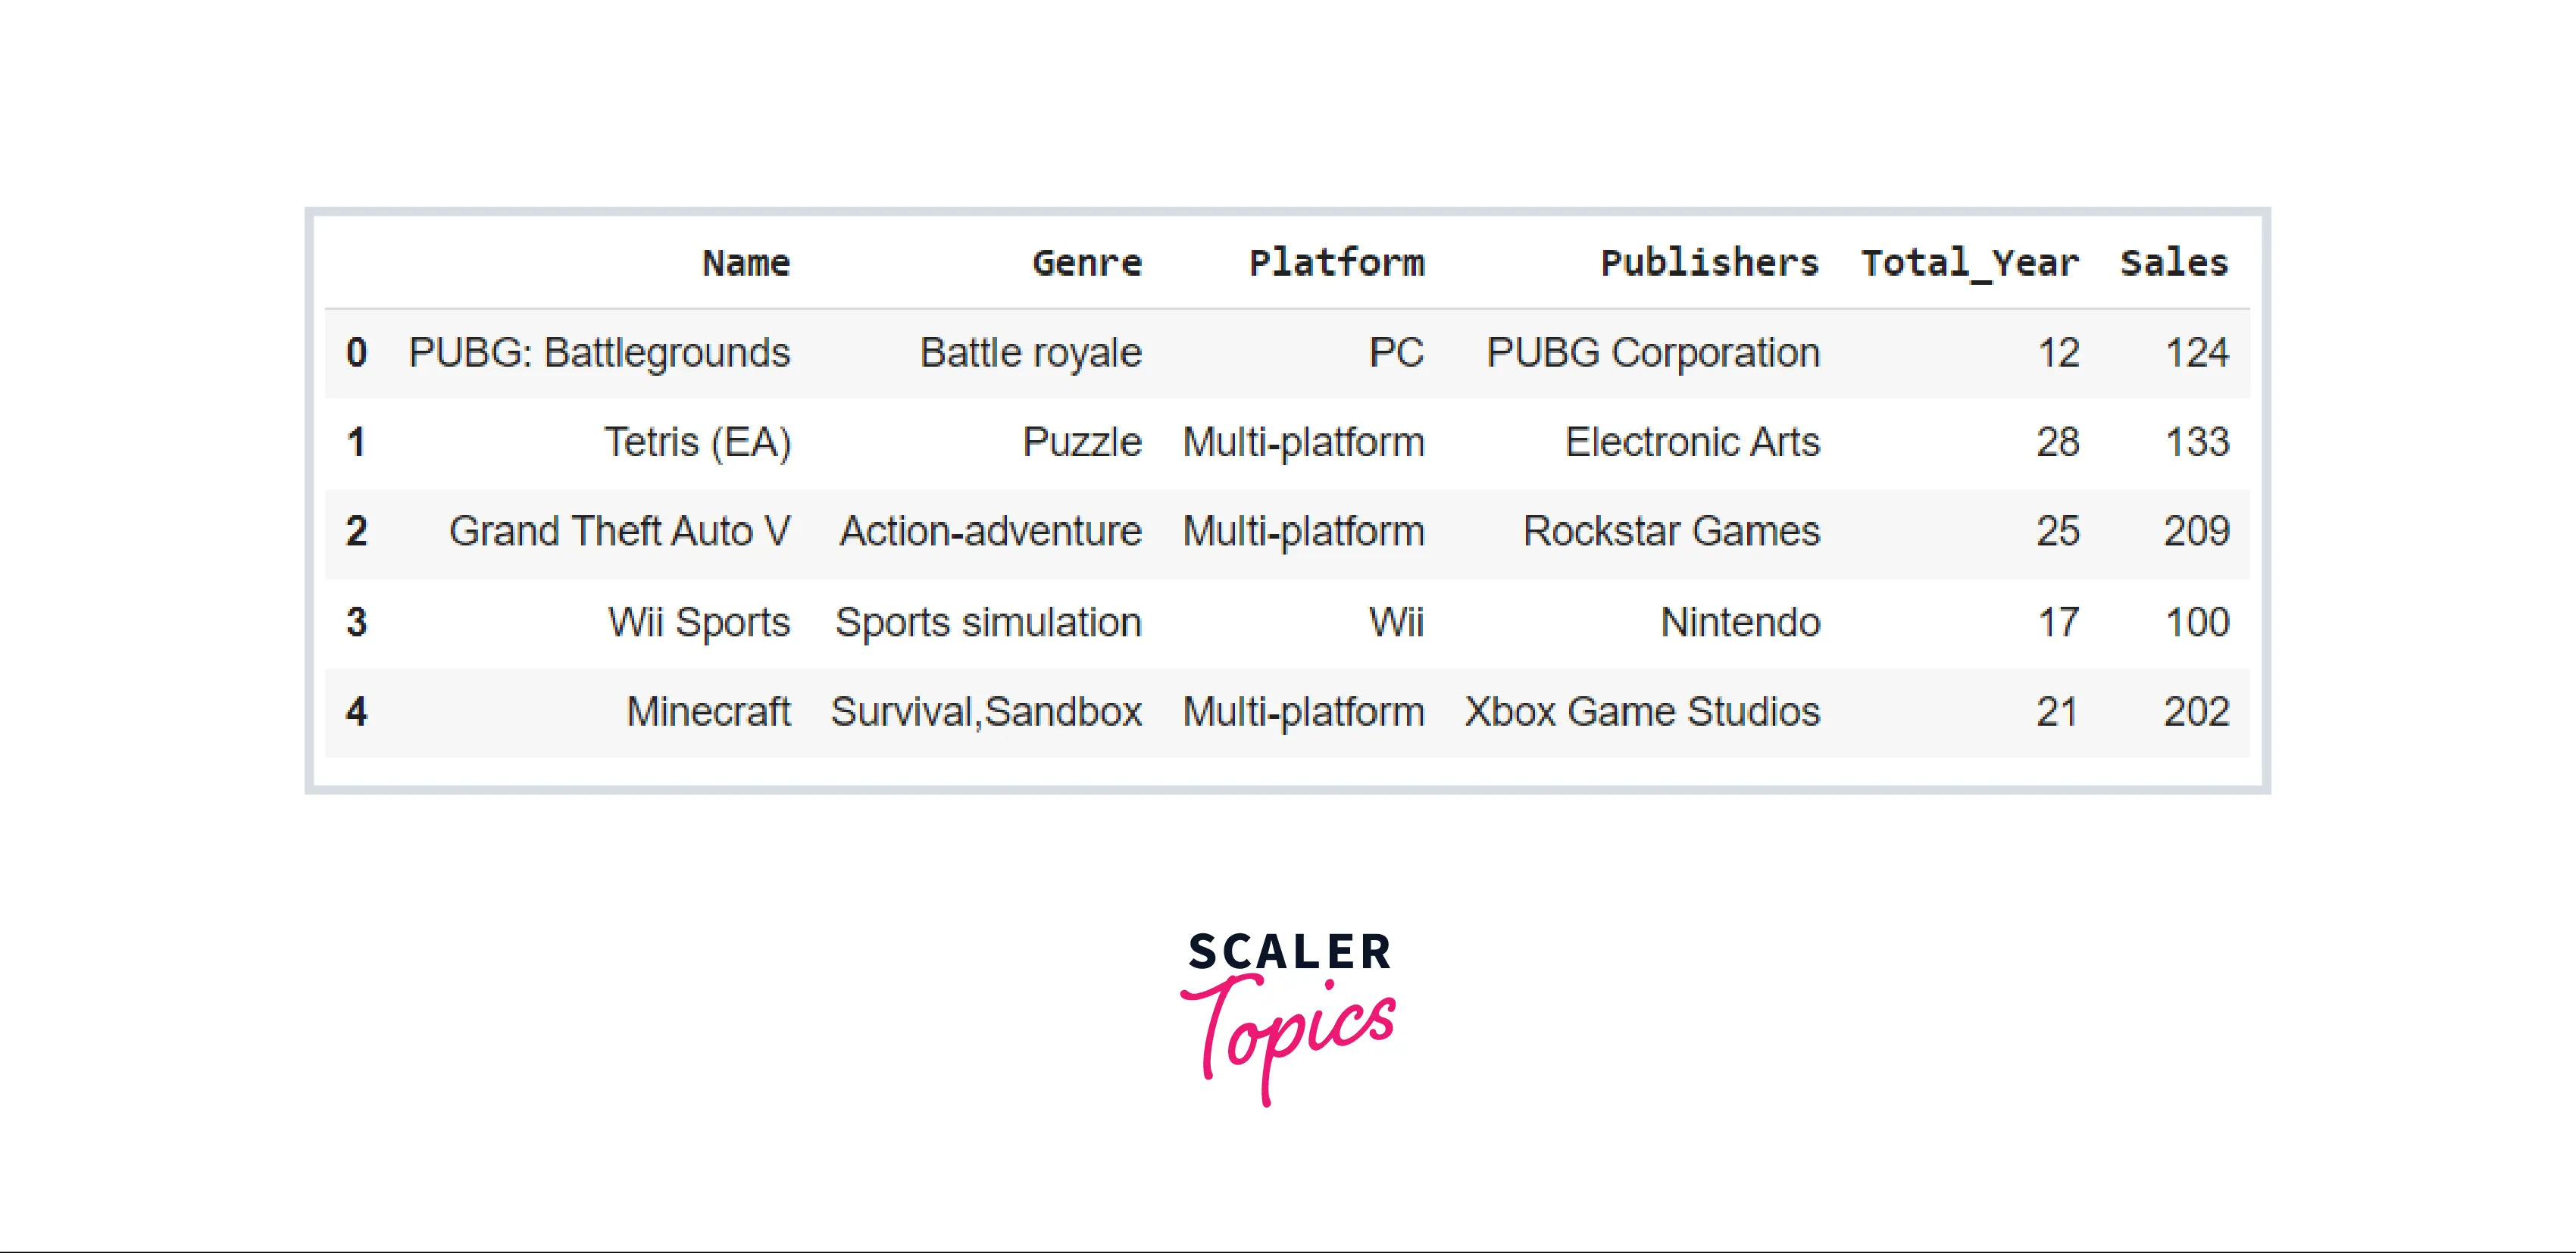
Now that our DataFrame has been created, we will use the pivot table Pandas method as pd.pivot table() to indicate which features should be included in the rows and columns by employing the index and columns arguments. The values argument should specify the feature that will be employed to write in the cell values.
Code:
Output:
In this example, we created a basic pivot table in Pandas that displays the average income of every type of employee within each department.
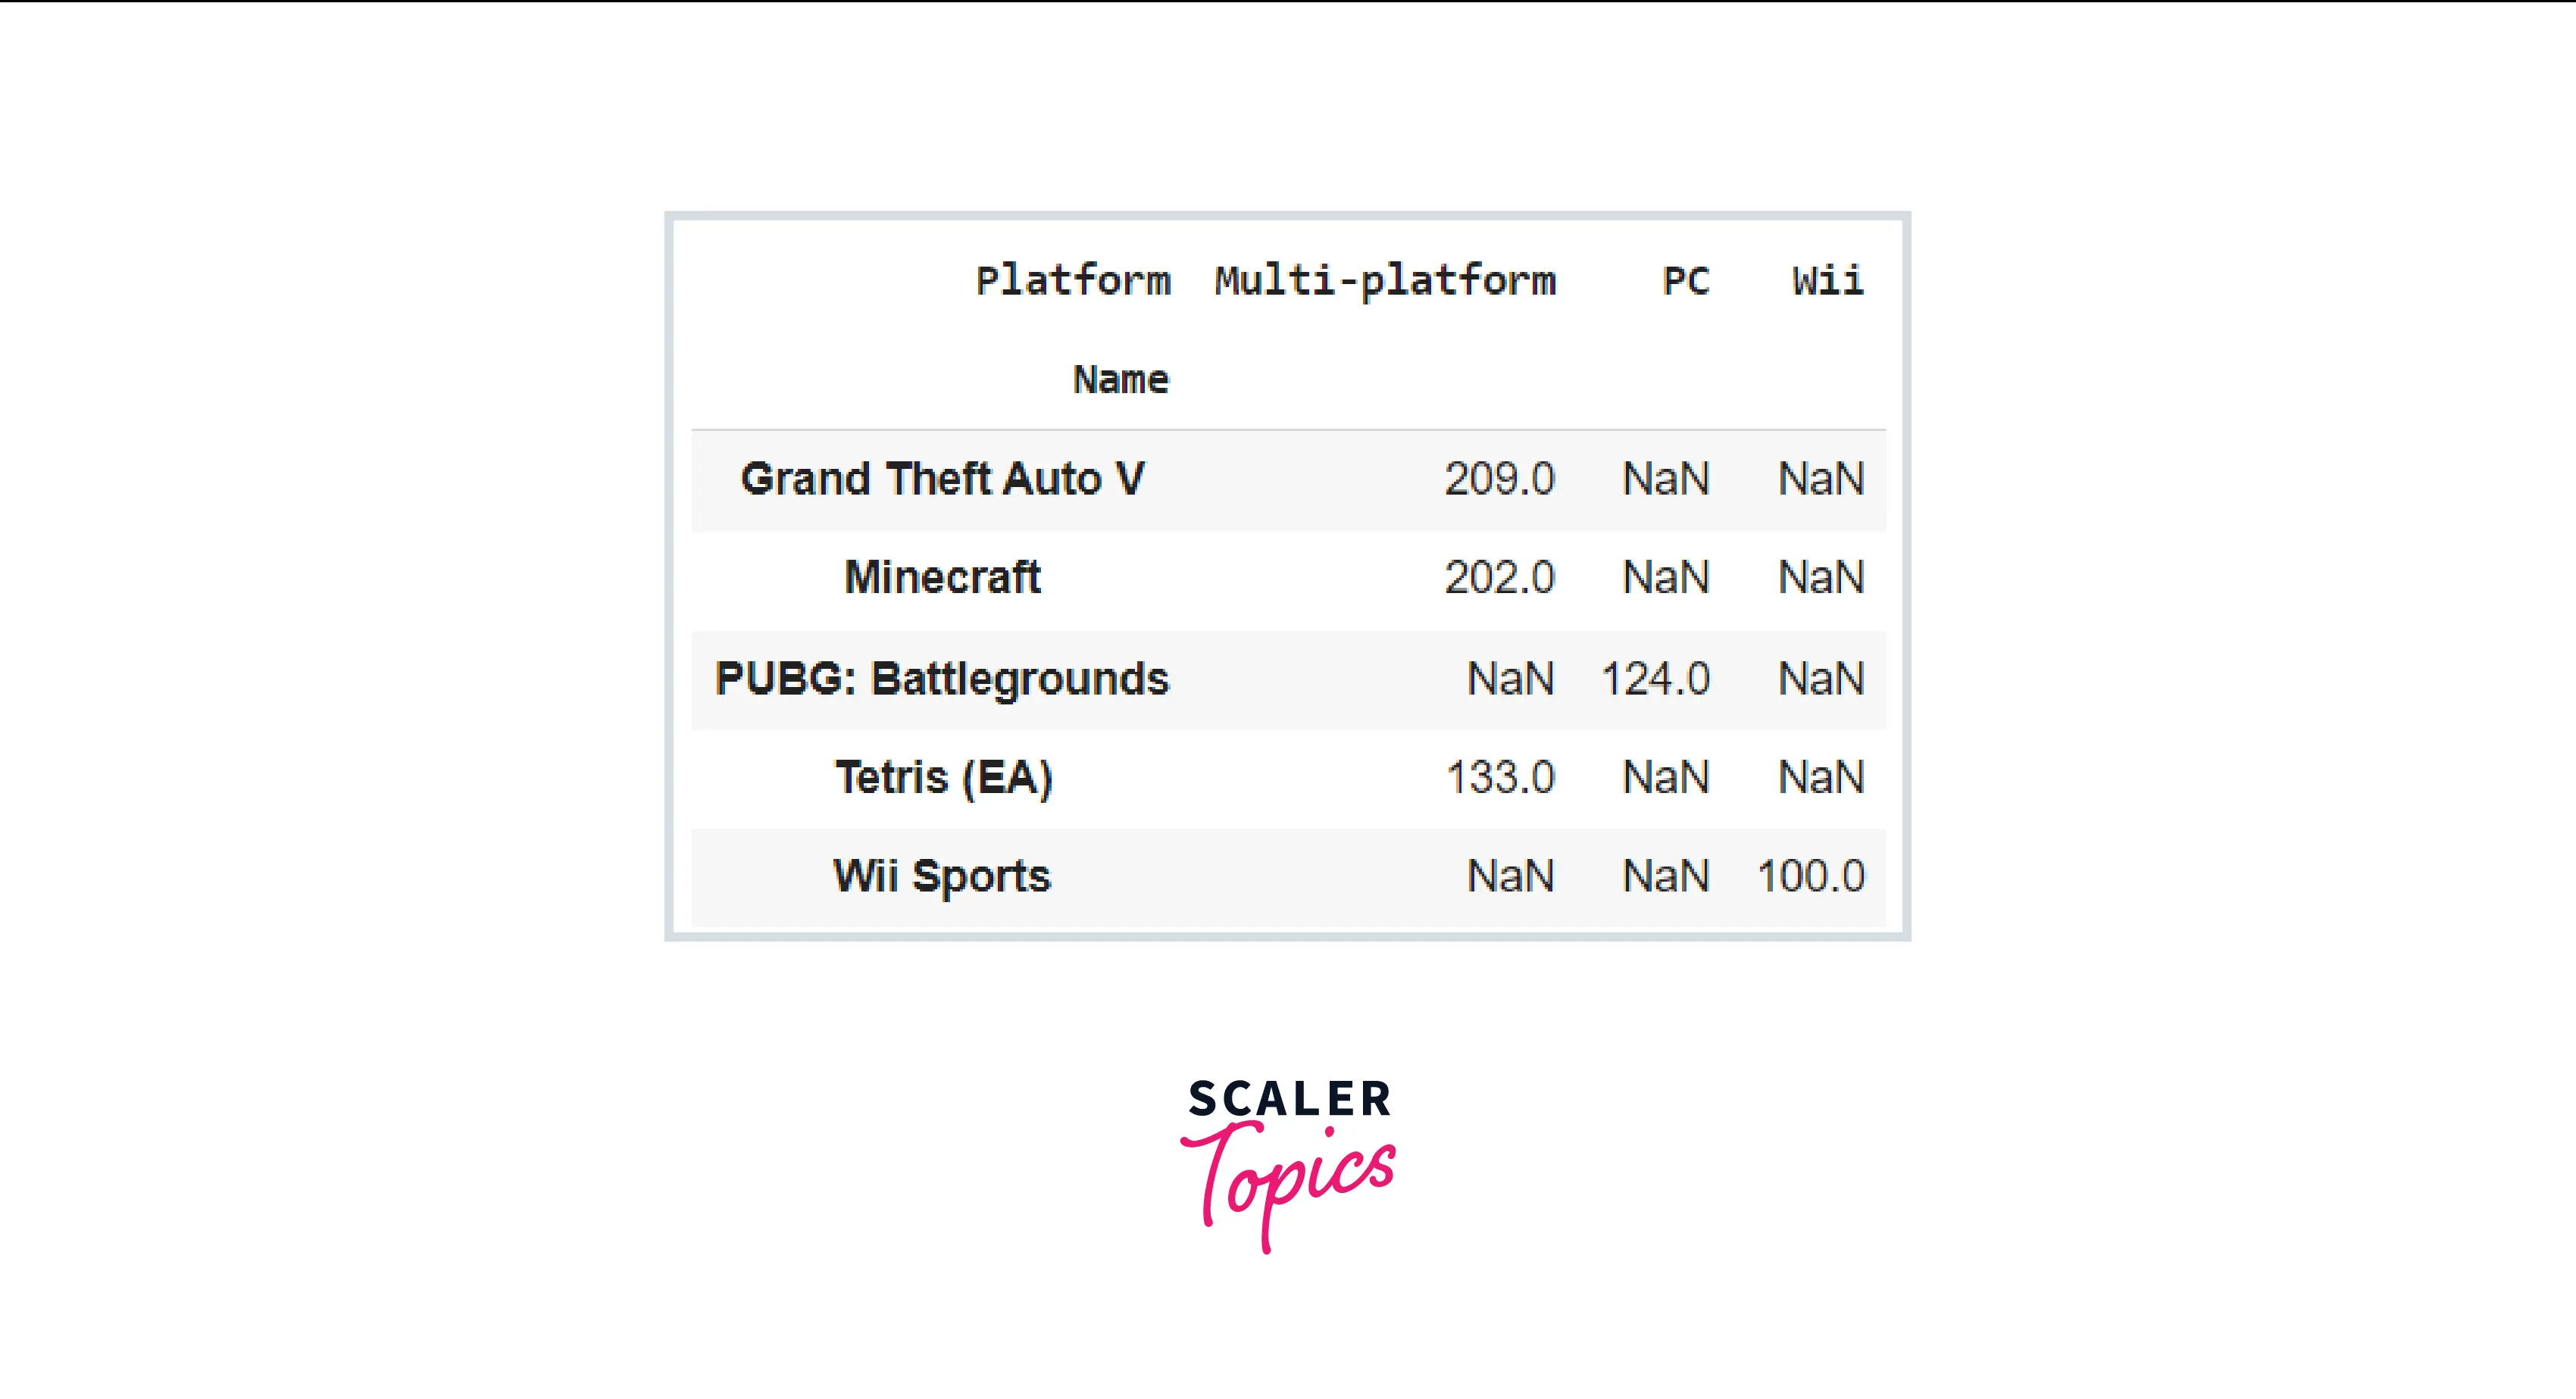
How to Fill Missing Values Using the fill_value Parameter
In the last part, we learned how to make pivot tables in Pandas. Sometimes our dataset contains NaN values, which might interfere with the statistical computation of our data in the pivot table. This is common encountered in large datasets, when there are a high number of NaN values that must be addressed before summarizing any relevant insights from the data. The pivot_table() methods in Pandas include a parameter that we may use to fill all of the NaN values in our DataFrame before conducting any calculations on it. To further comprehend the fill_value parameter, consider the following example.
Code:
Output:
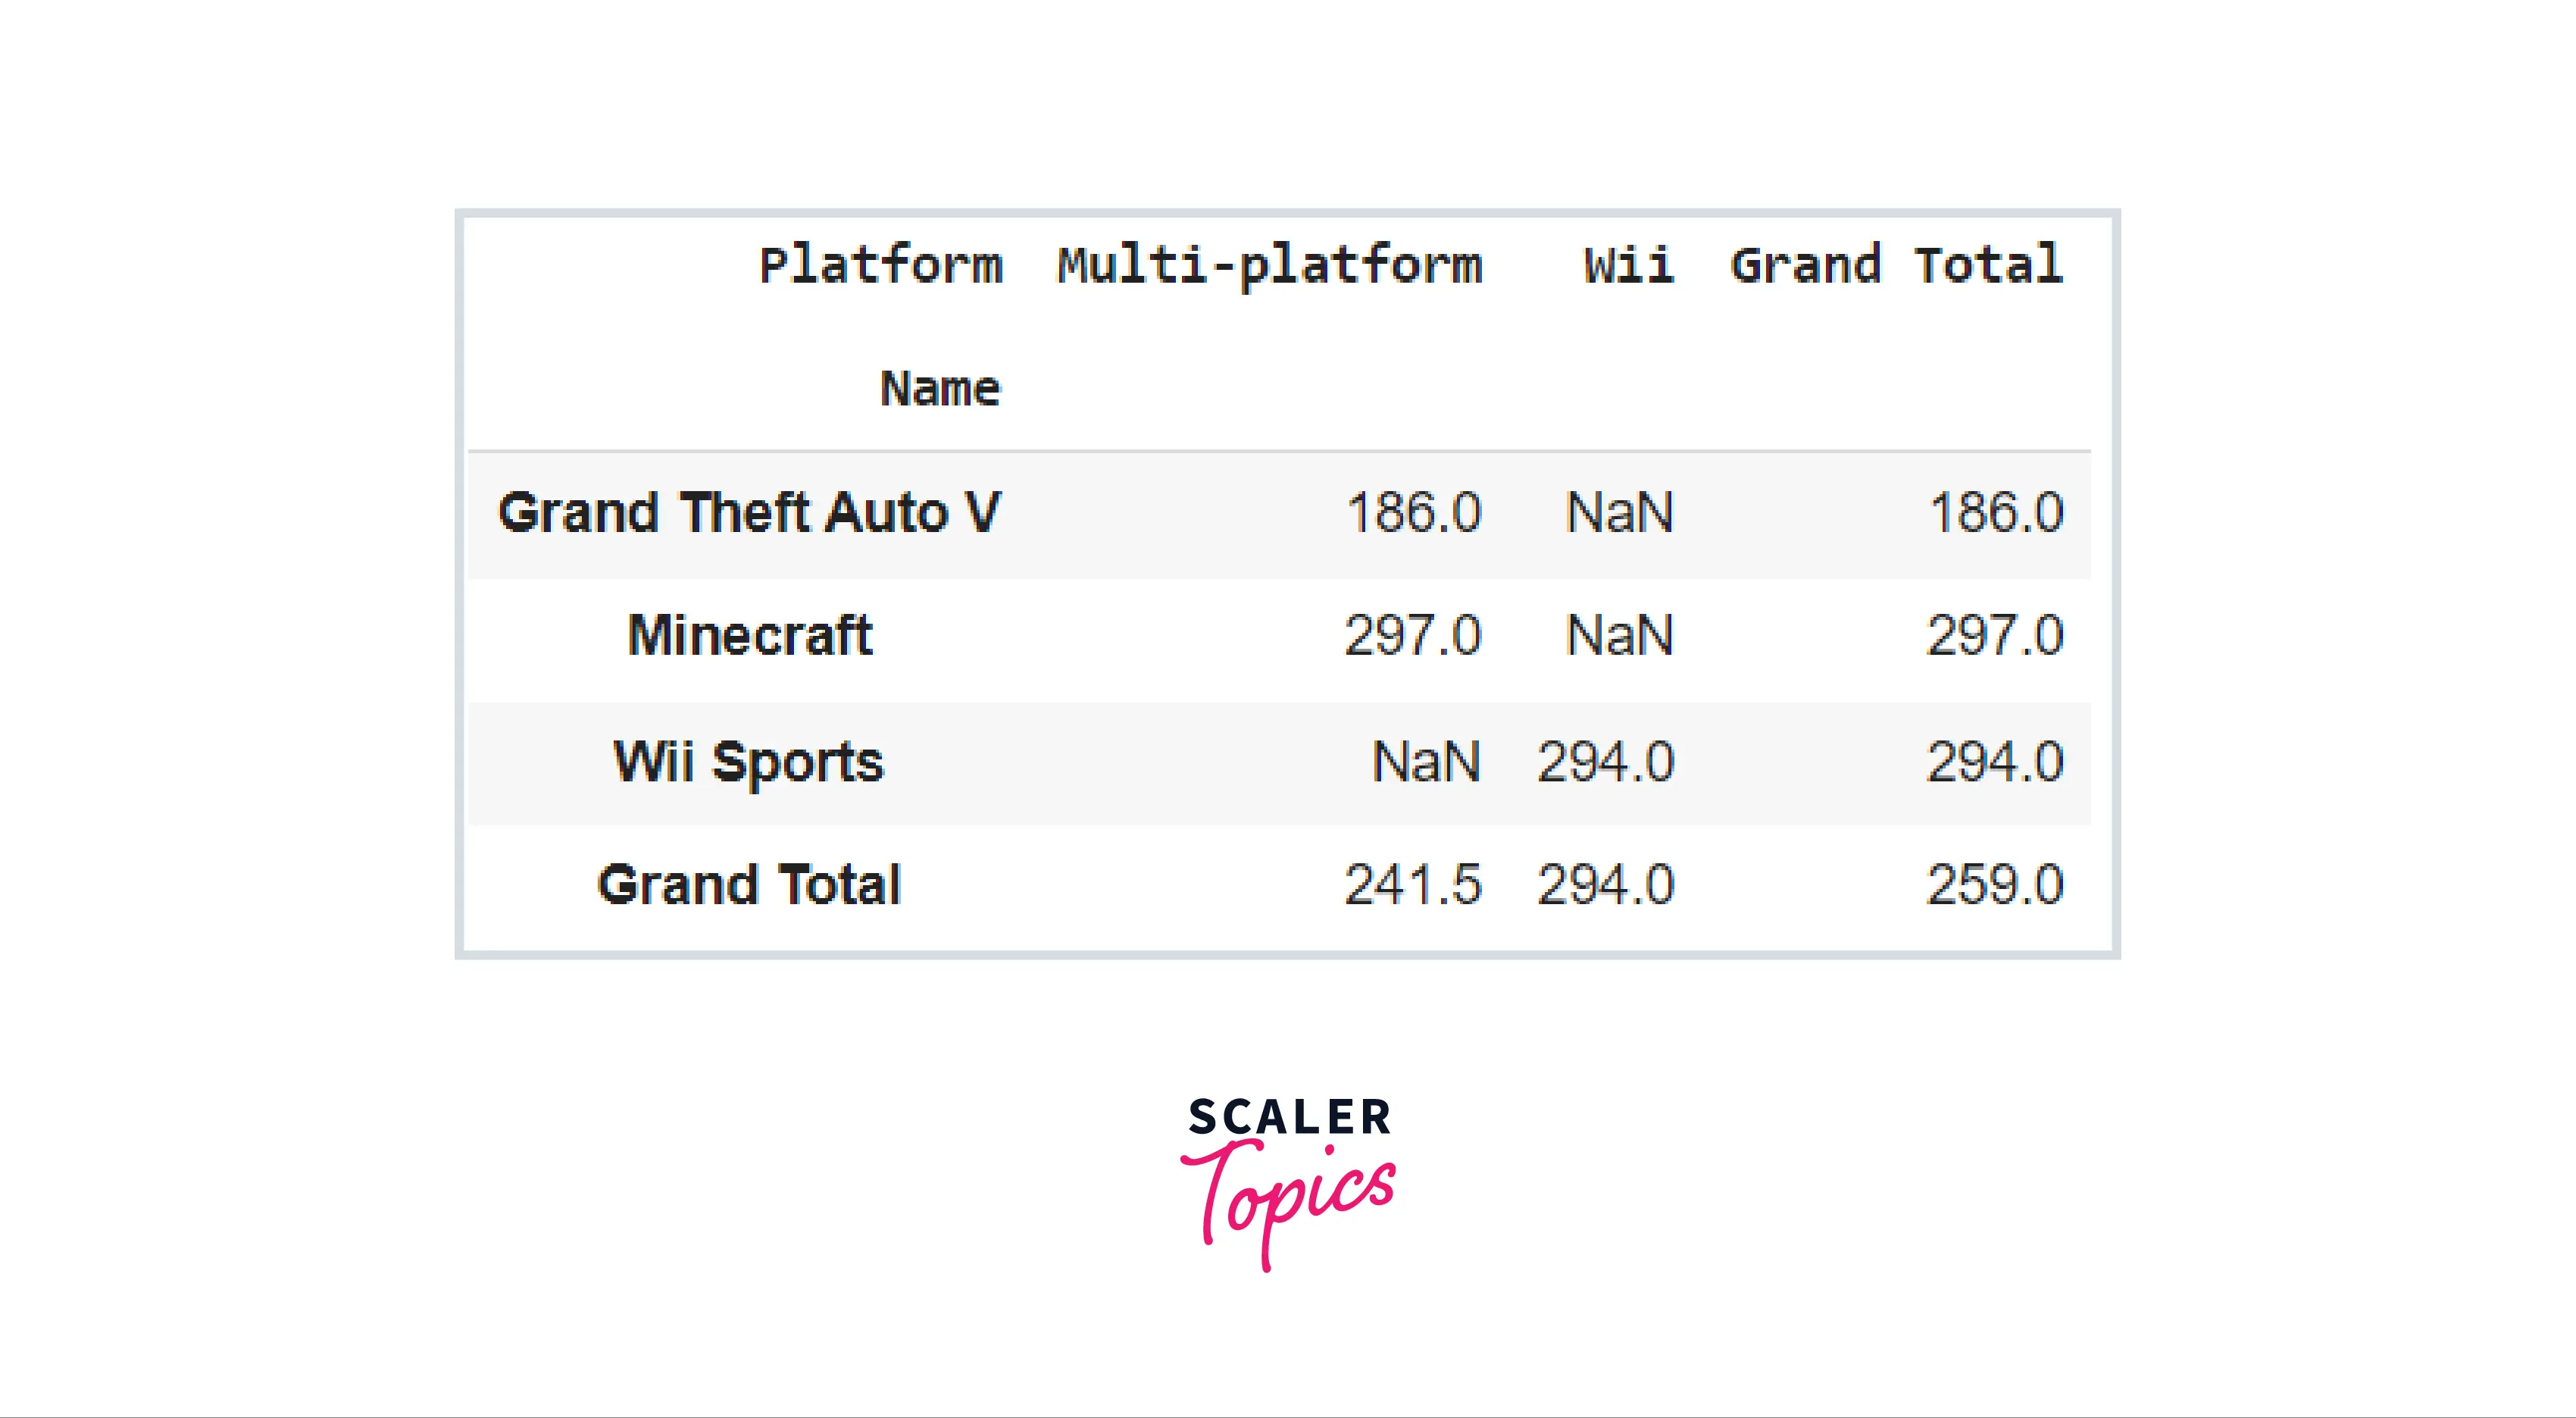
How to Add Margins in Pivot Table
While examining the parameters for the pivot table() method, we discovered that the margins keyword may be used to estimate totals along every grouping. We can set margins in a pivot table if and only if the margins keyword is set to True. The margins_name argument is used to do this. It is set to "All" by default. It is employed to specify the title of the row or column containing the totals. Consider the following code example:
Code:
Output:
Turn Learning into Career Growth
How to Calculate Multiple Types of Aggregations for any Given Value Column
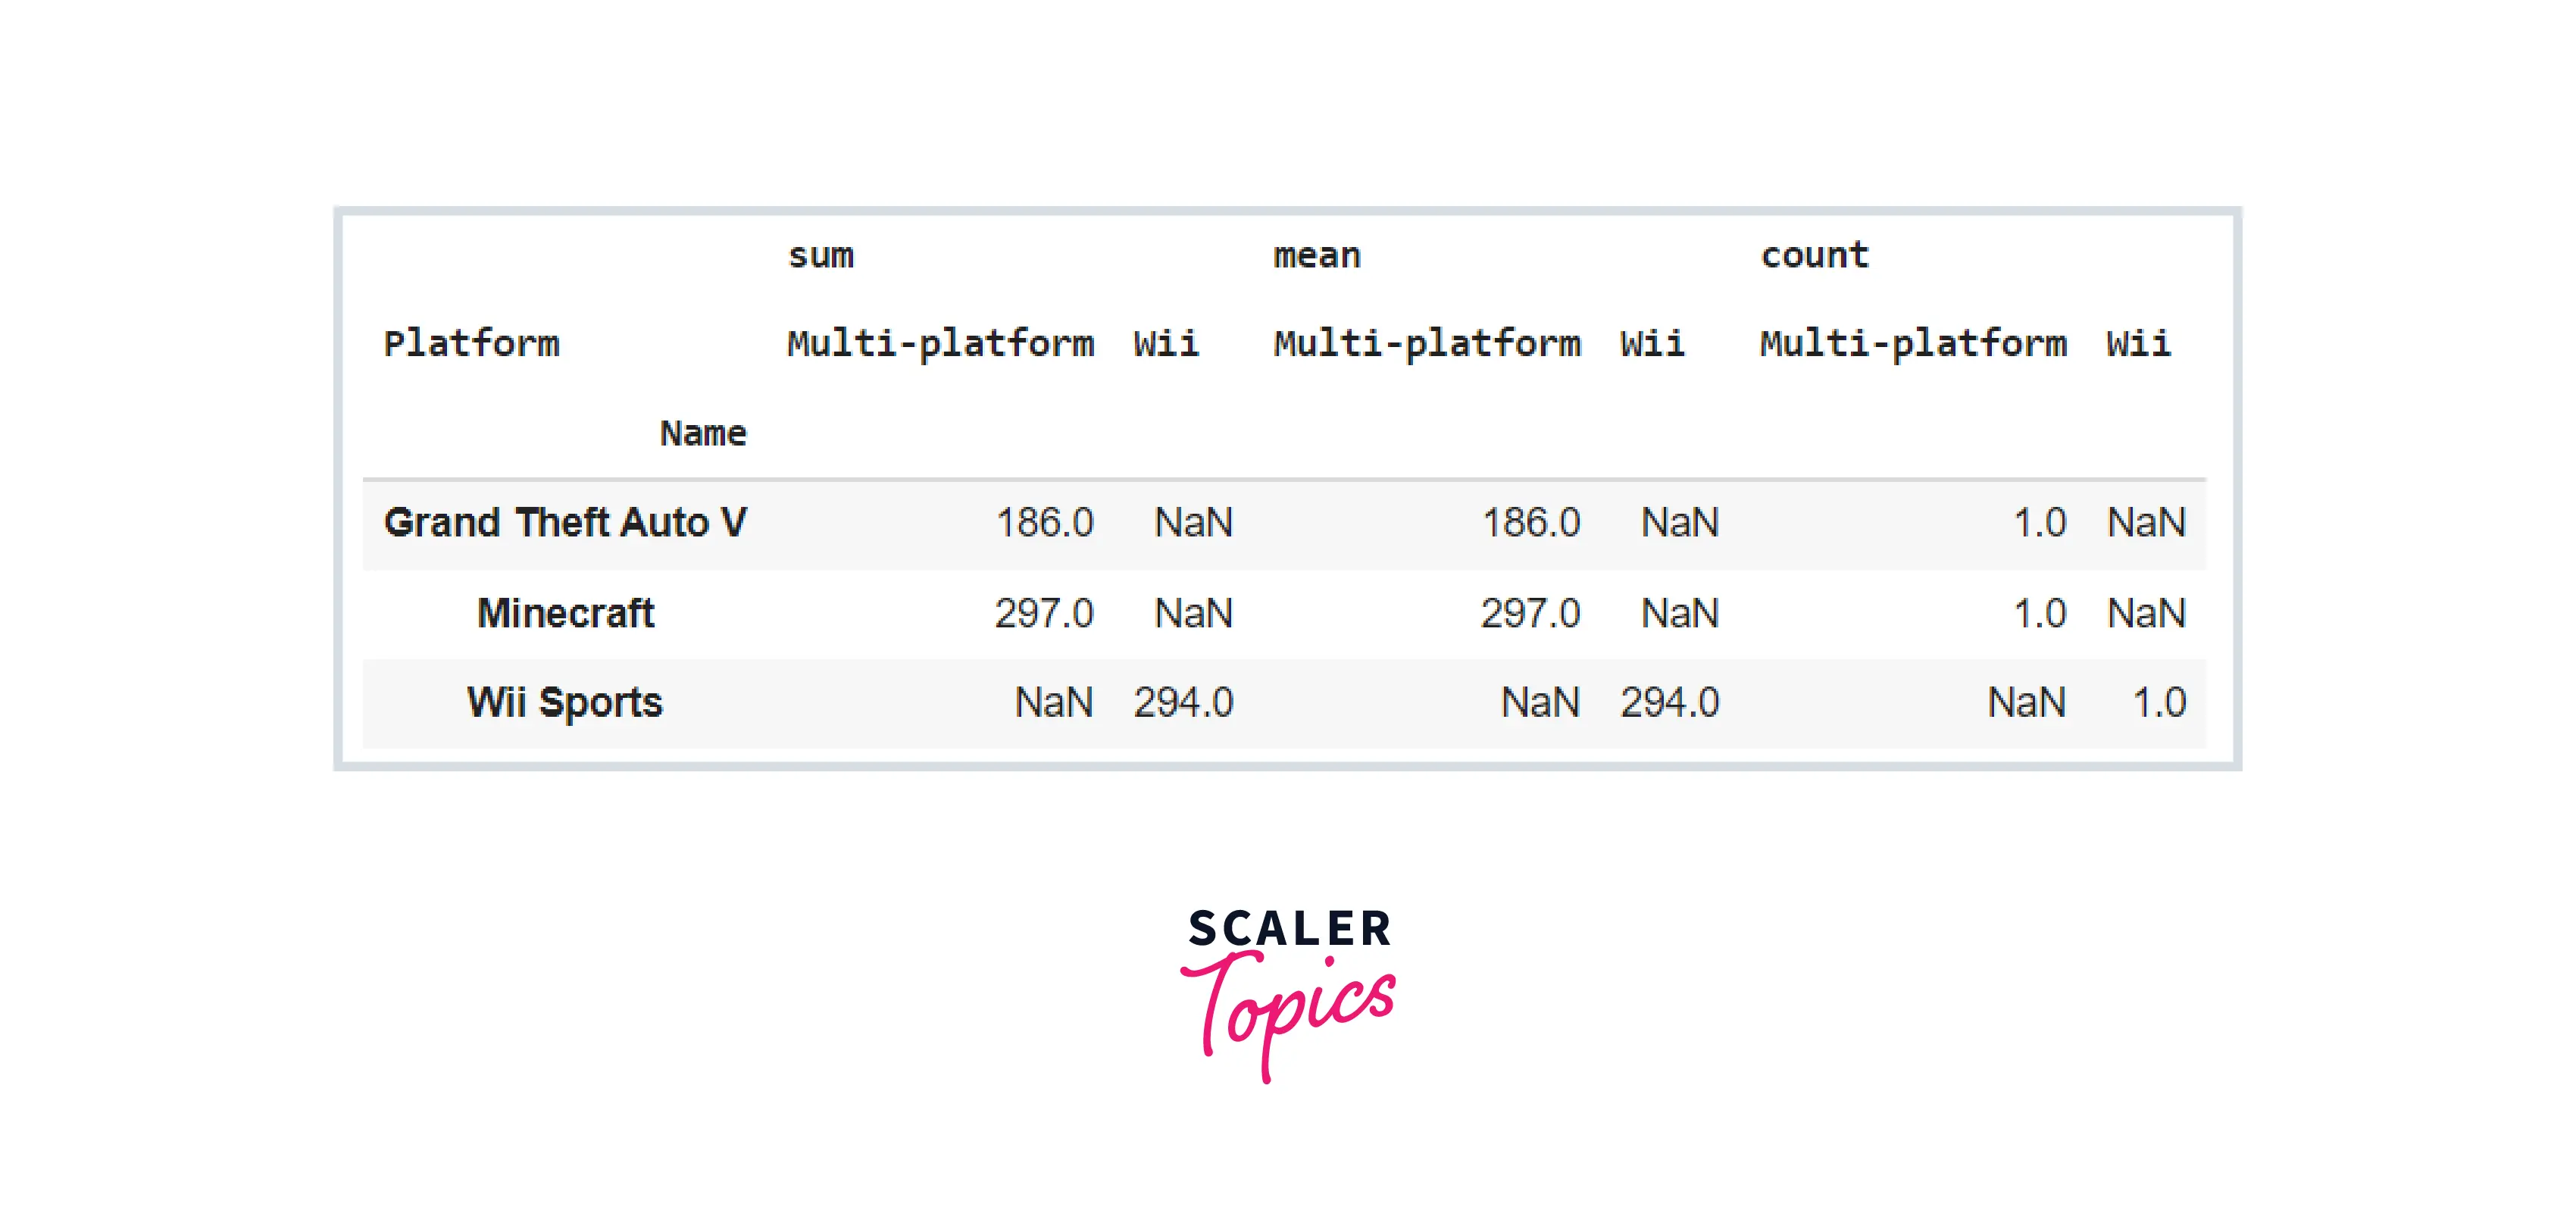
The aggfunc keyword specifies the type of aggregation used, which is by default a mean. The aggregate specification, like the GroupBy, may be either a string representing one of the many popular possibilities (e.g.,'sum,"mean,' 'count,"min,"max,' etc.) or a method that executes an aggregation (– for example, np.sum(), min(), sum(), np.std, np.min, np.max and so forth.). It can also be given as a dictionary associating a column with any of the above-mentioned choices. To further comprehend it, consider the following example:
Code:
Output:
How to Group Data Using Index in a Pivot Table
We saw in the parameter subsection that the index parameter defines the Column that will be used to index the feature supplied in the values argument. If the index parameter is an array, it must be the same length as the DataFrame. Consider the following example:
Code:
Output:

How to Run a Pivot with a Multi-Index
We saw in the last section that the index only employed one characteristic, a single level indexing. However, we can build pivot tables in Pandas with numerous indexes. A pivot table with multi-level indices can give highly helpful and thorough summarized data whenever data is structured hierarchically. Consider the following illustration:
Code:
Output:
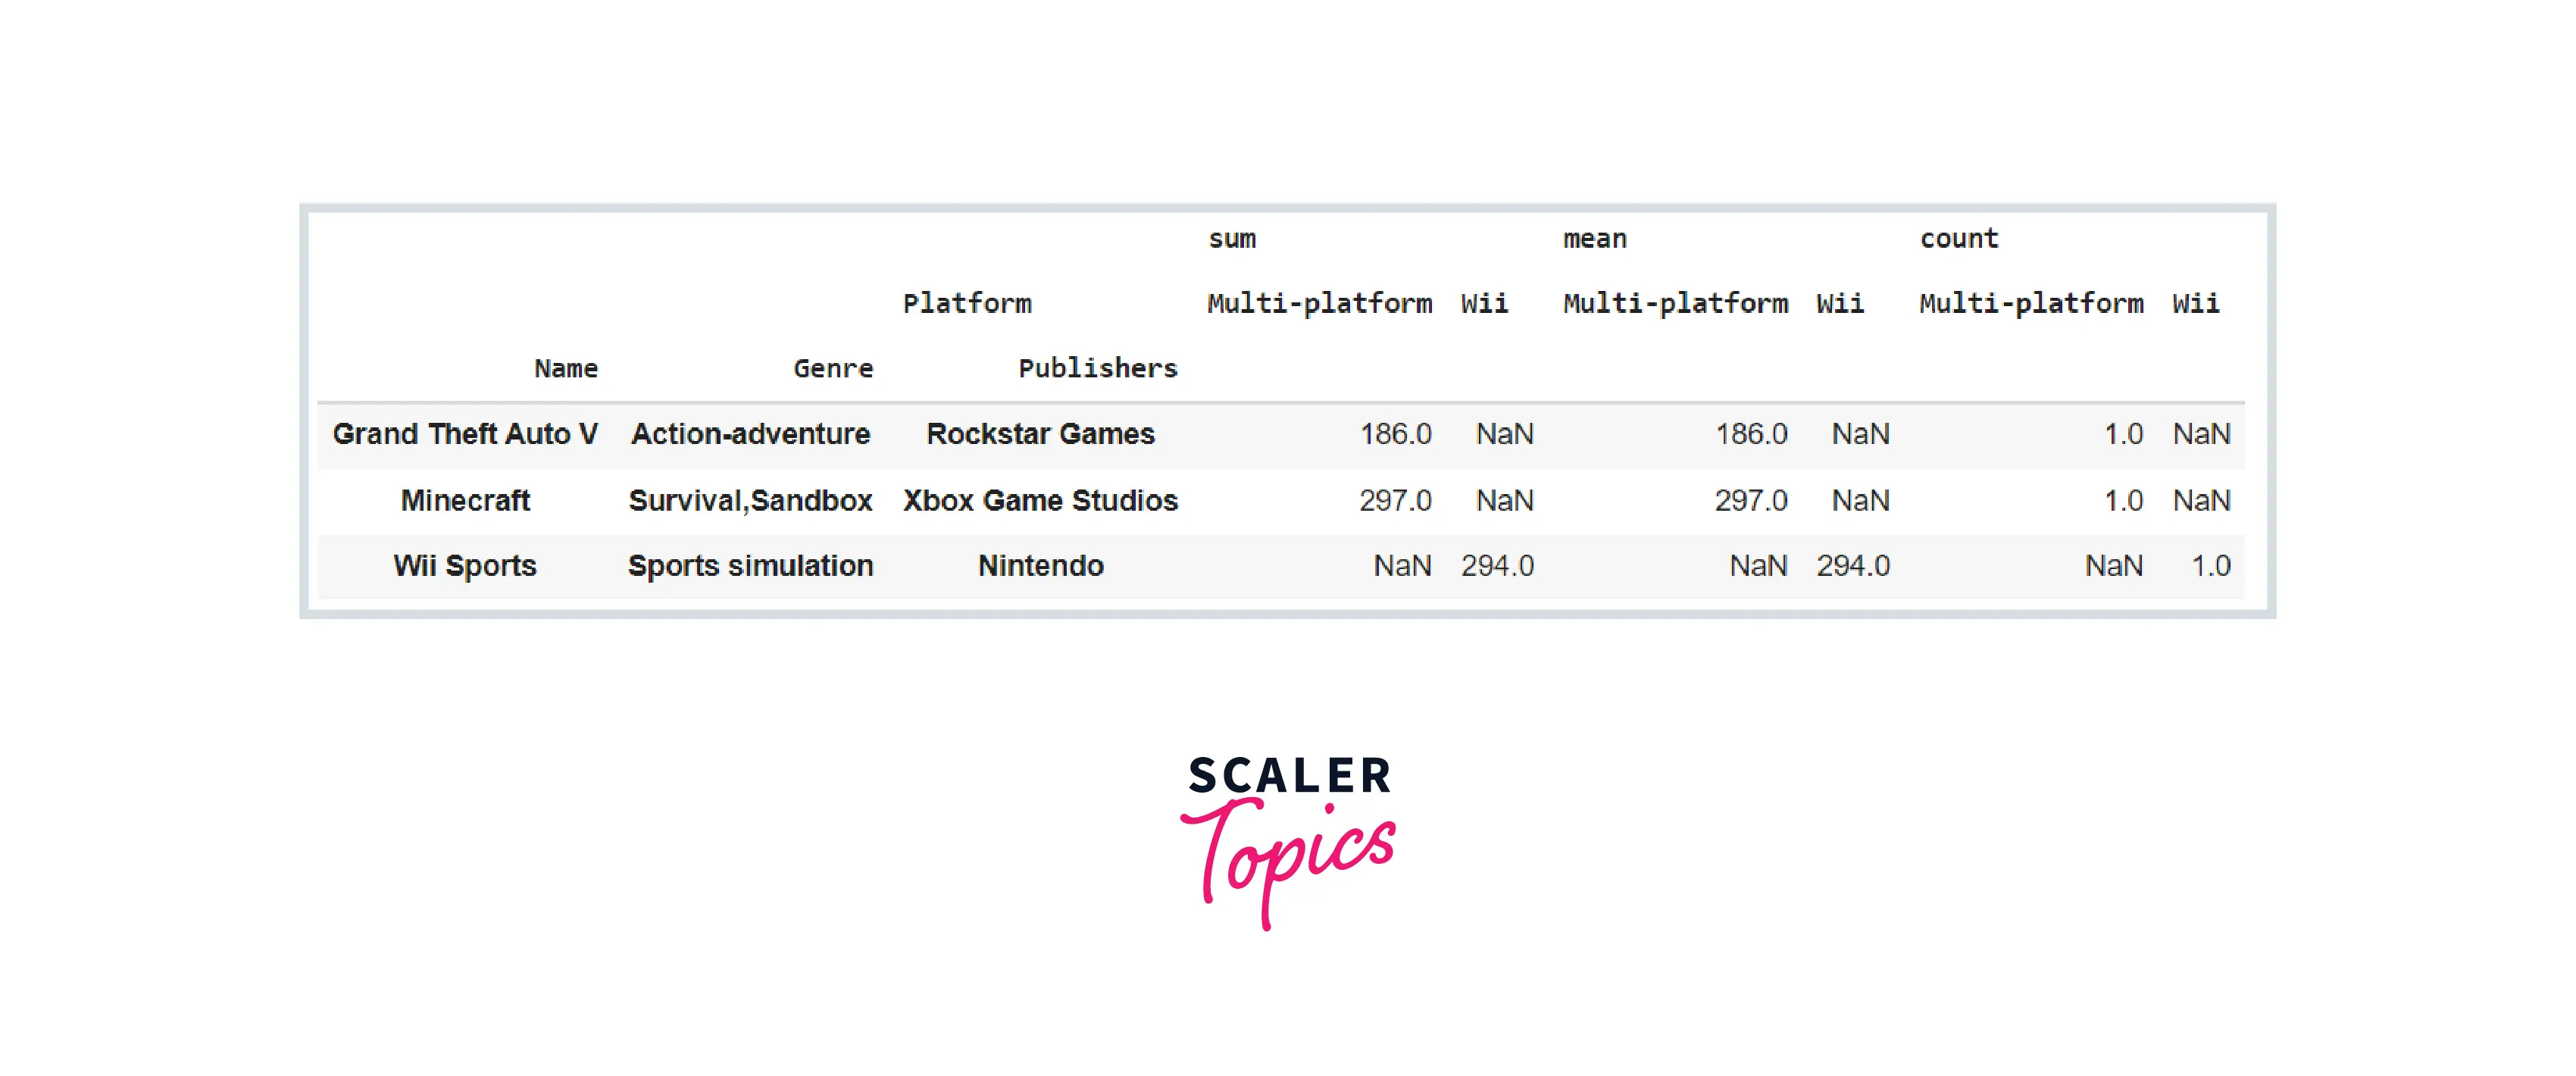
In terms of production, there are multi-level indexes that explain that there are three genres in multi-platform, and the total of their sales, mean, and count are as follows. The sequence in which the indices are supplied matters, and the results will differ as a consequence.
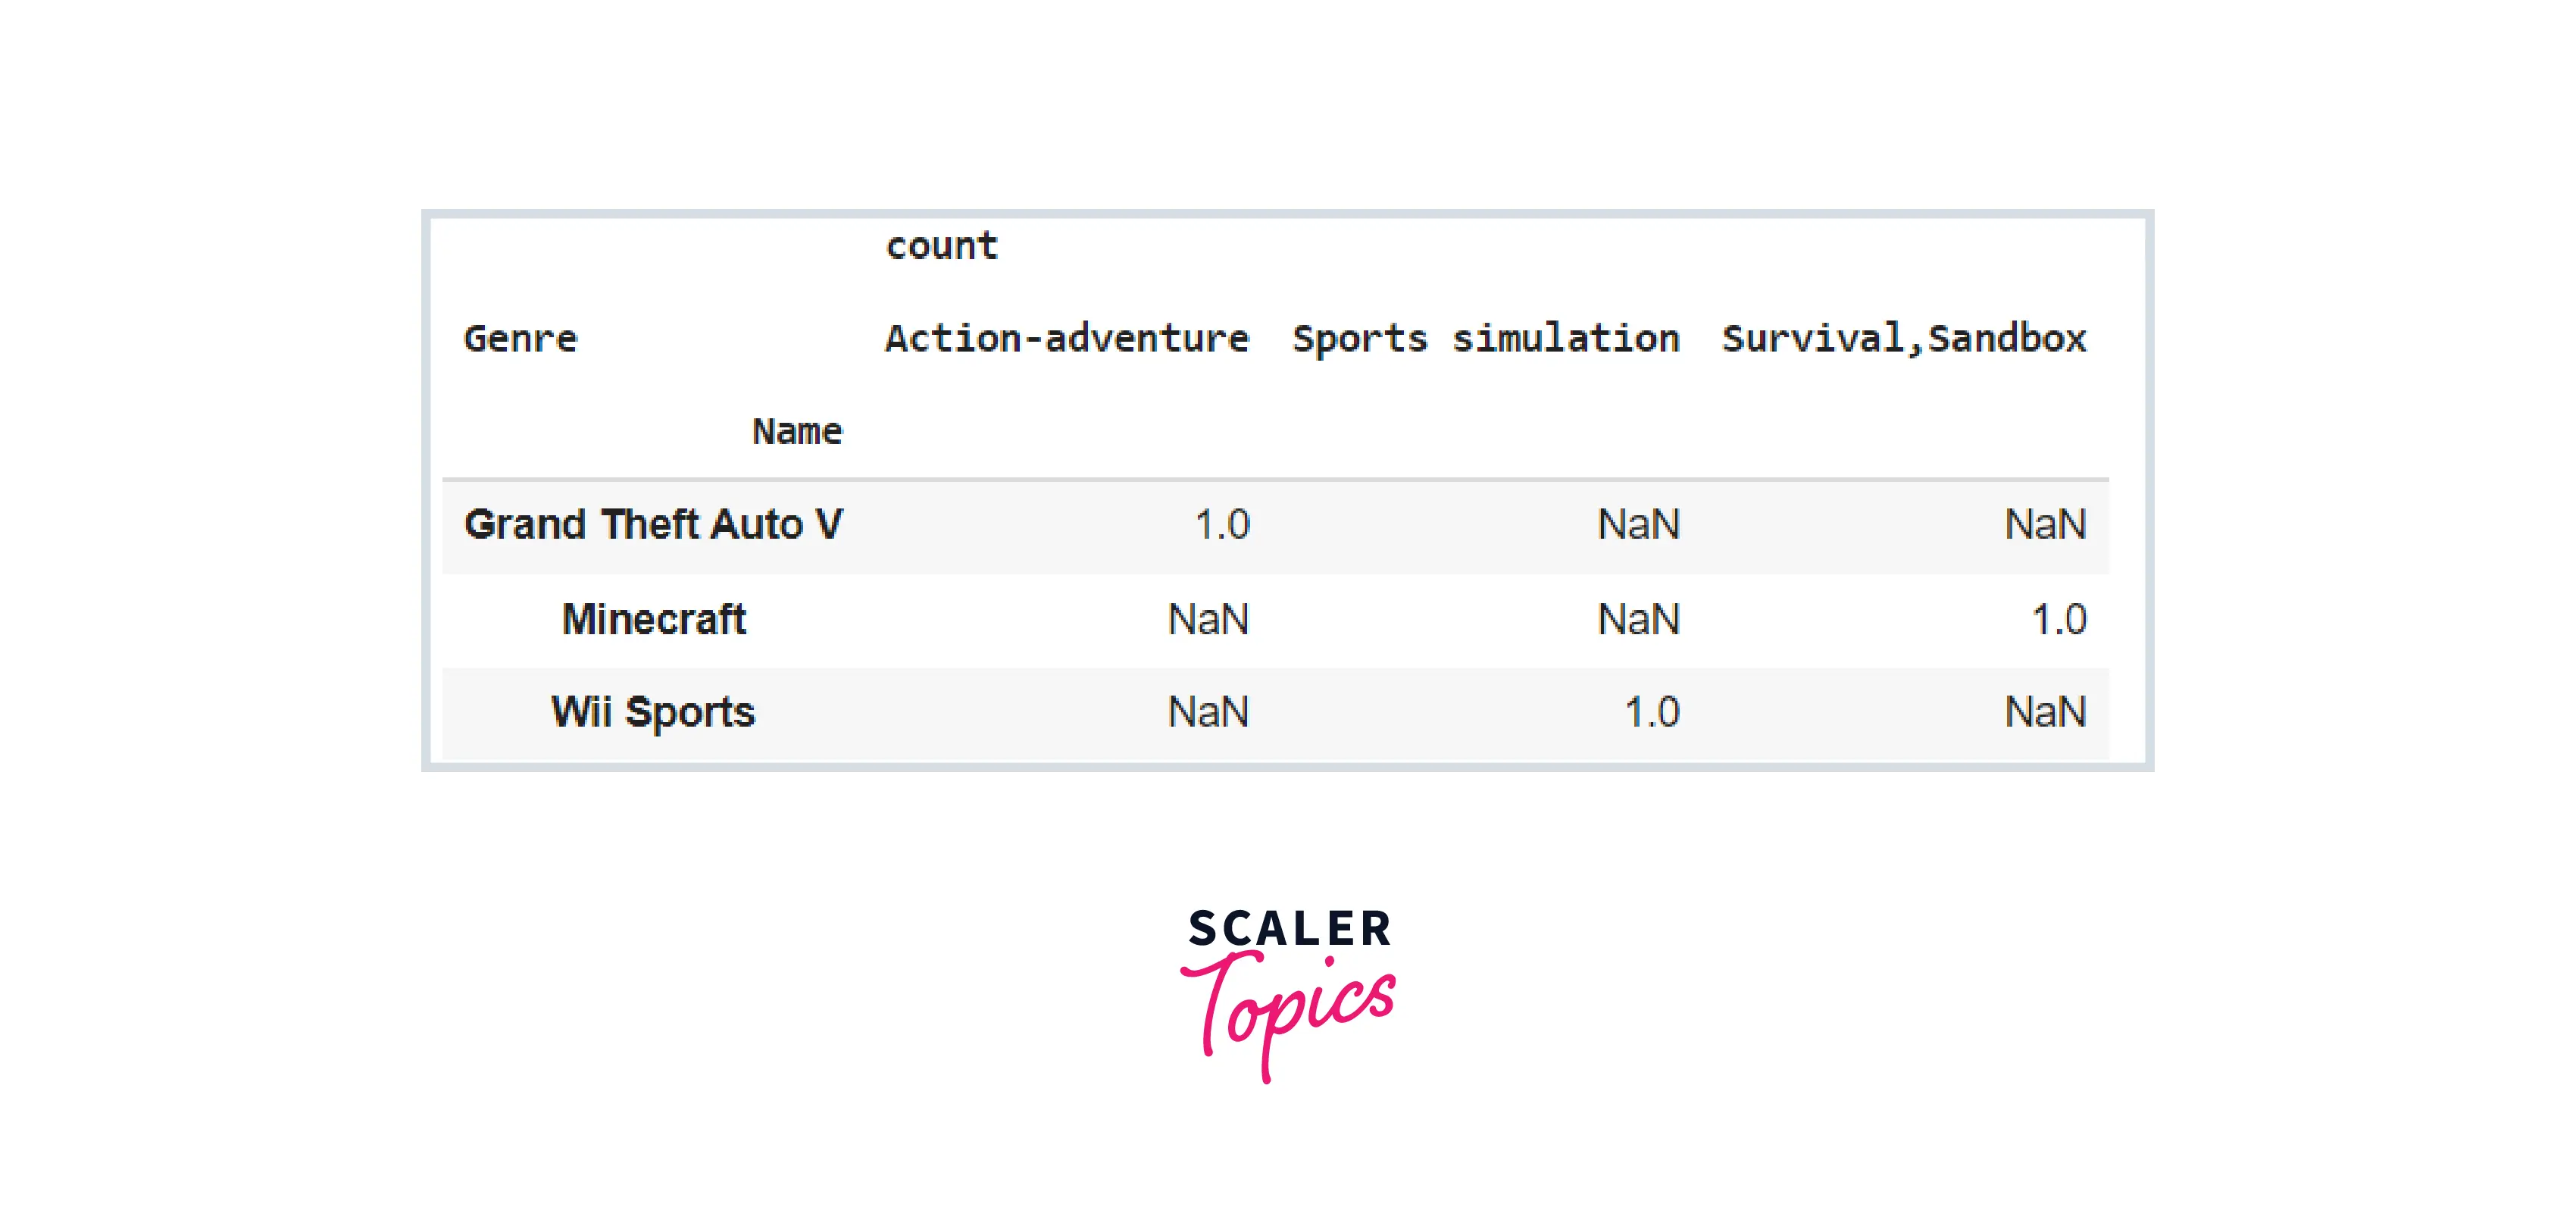
Aggregate on Specific Features with Values Parameter
The value argument instructs the method on which characteristics to aggregate. It is an optional parameter, and if we do not indicate it, the method will aggregate all of the dataset's quantitative variables. In the previous index example, we saw that aggregation was performed on all quantitative columns. Because the value argument was not given, pivot_table examined all numerical columns by default. Consider the following example:
Code:
Output:
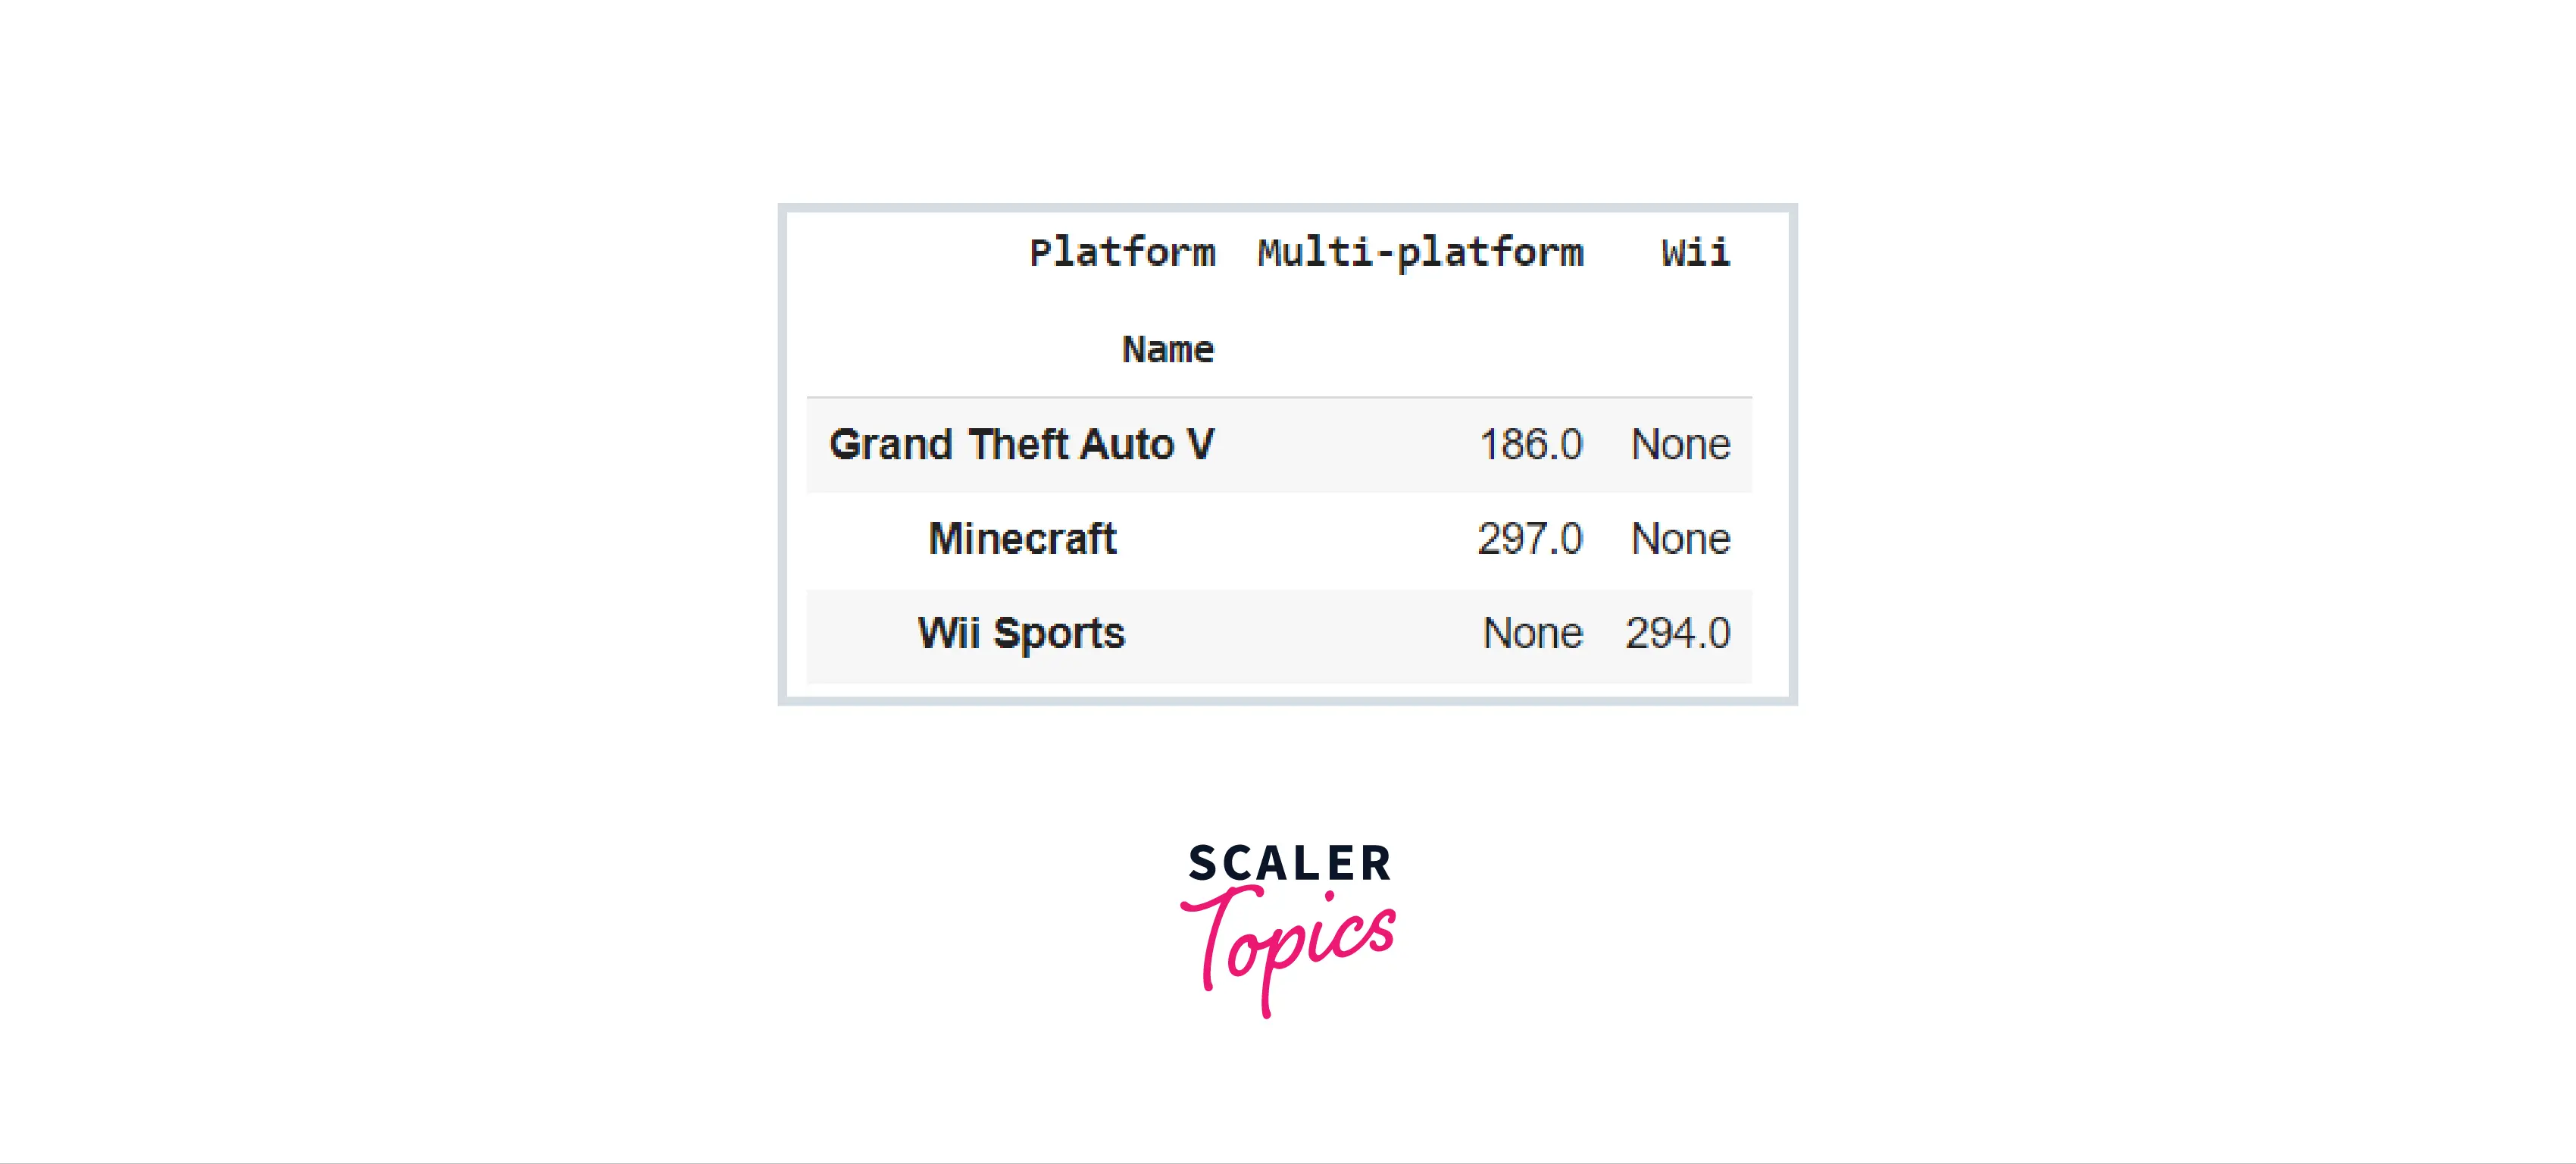
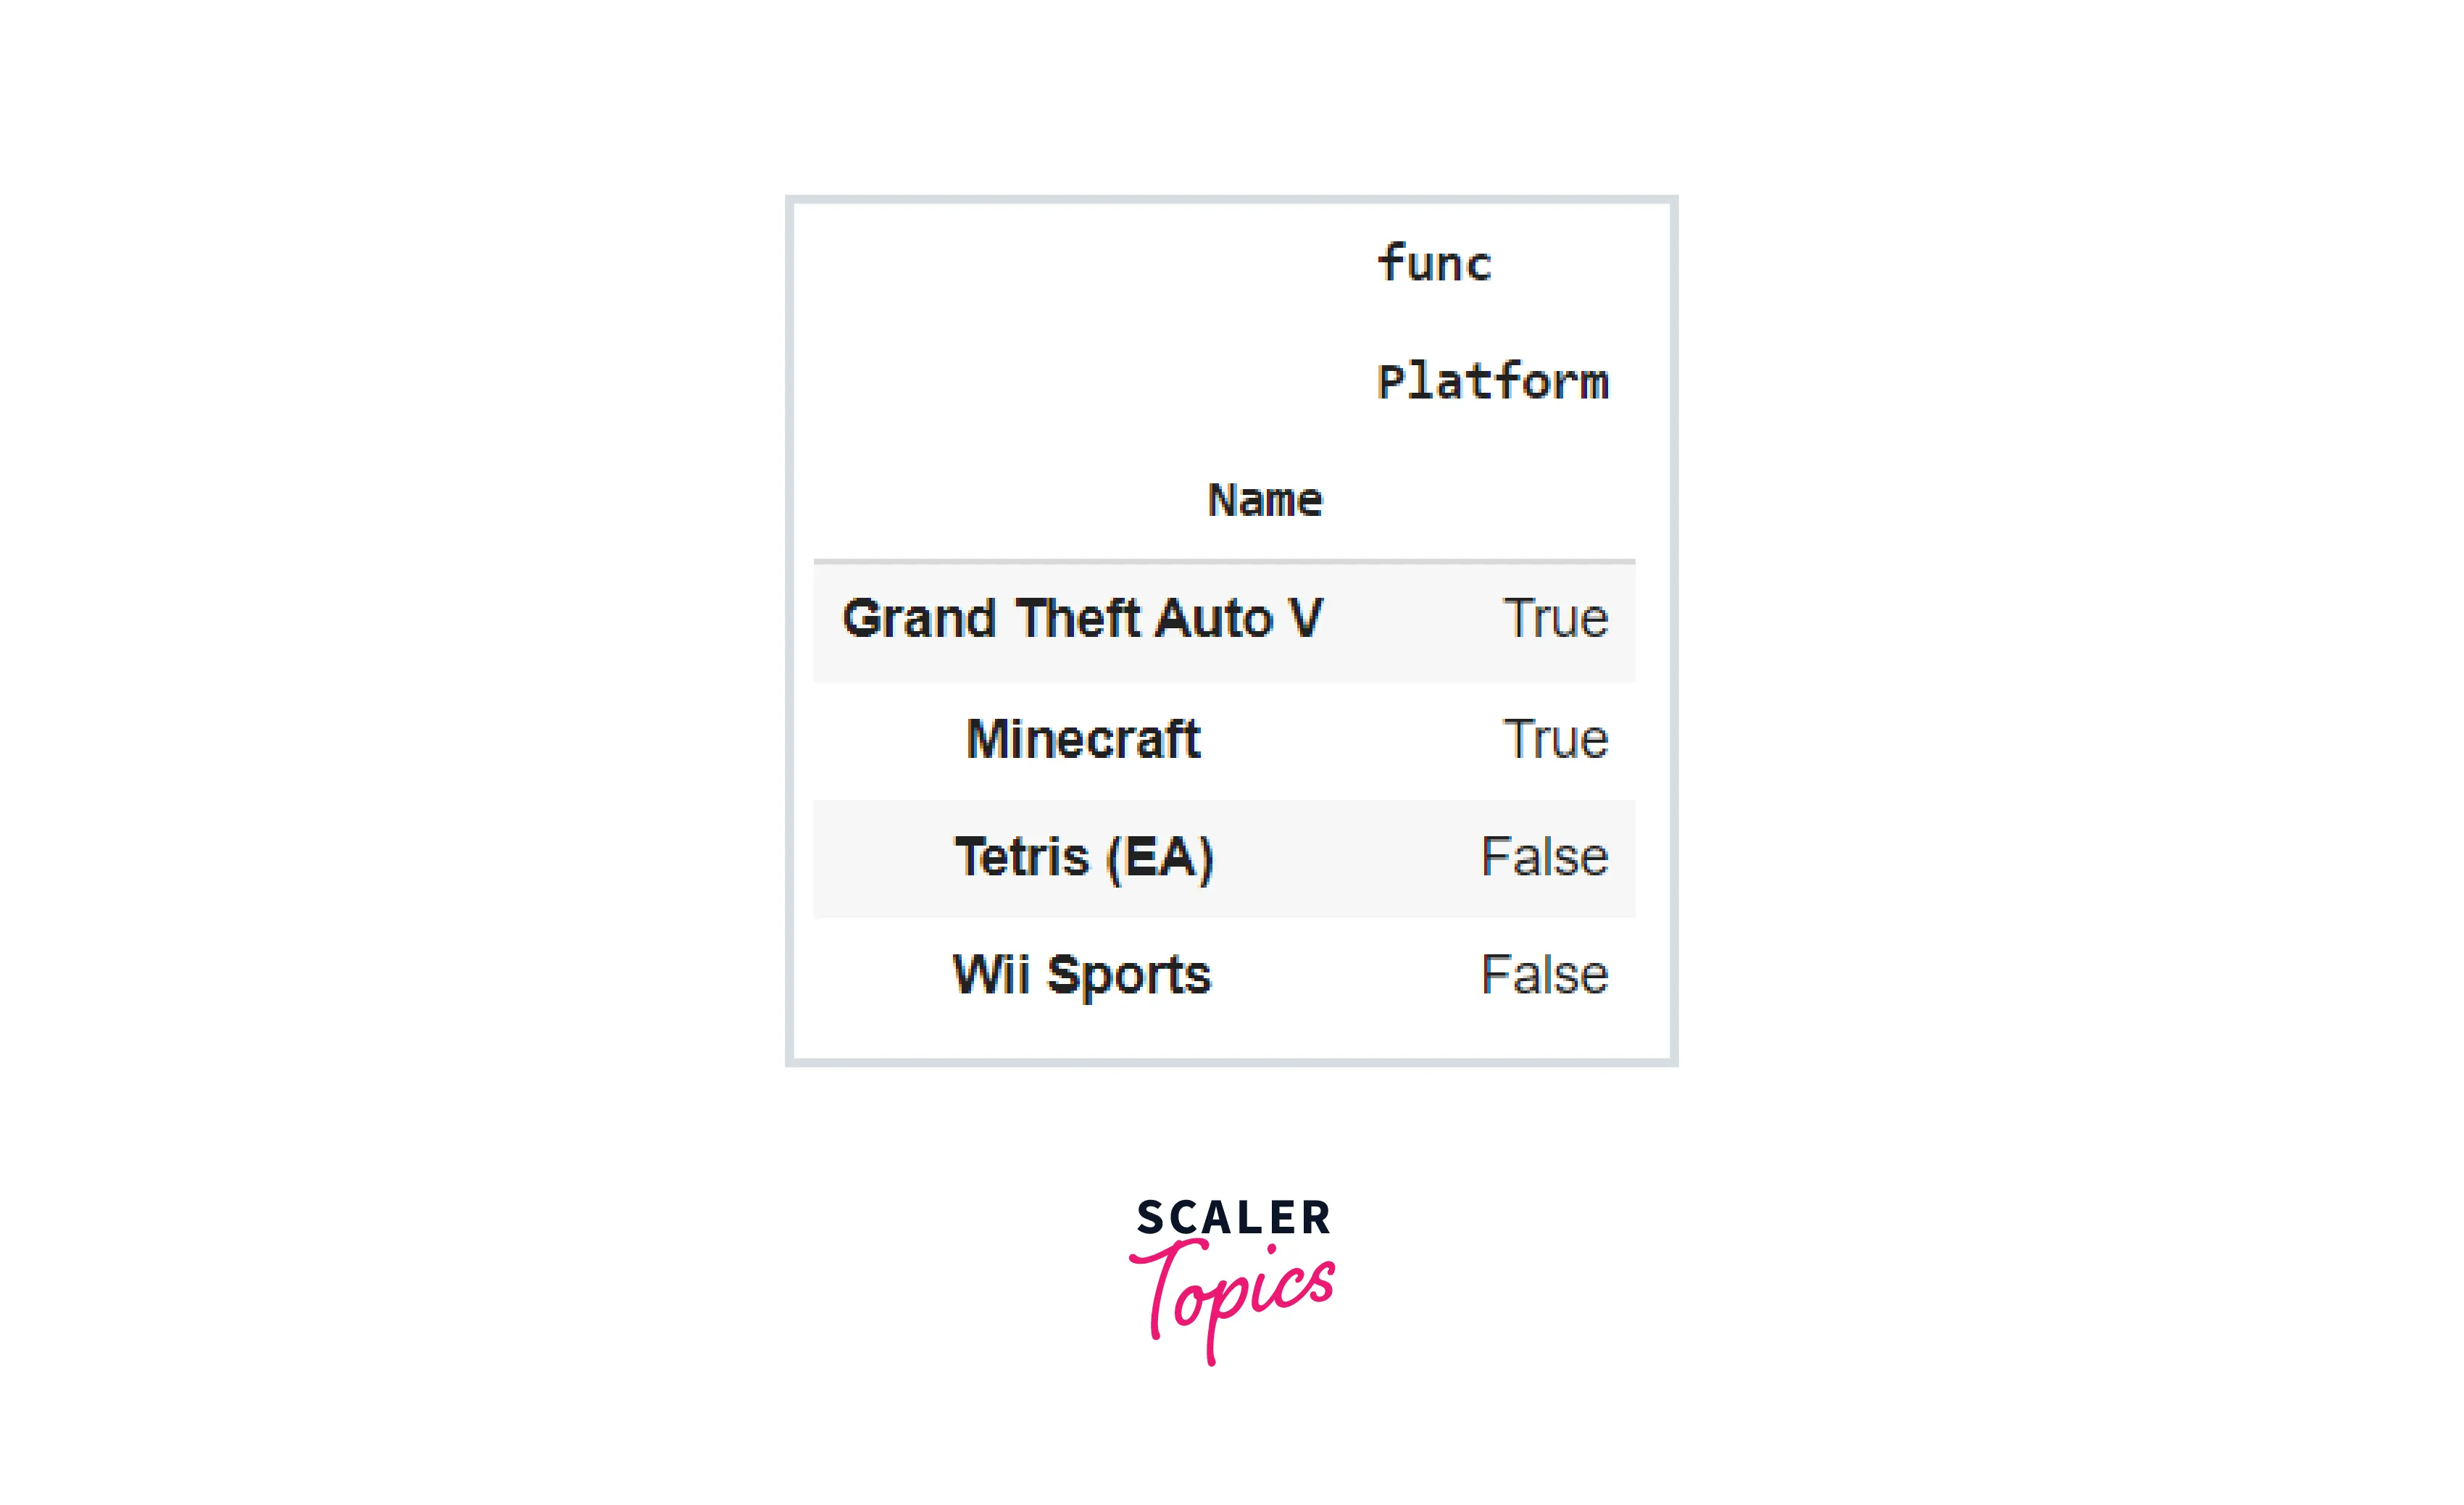
How to Specify and Create Your Own Aggregation Methods
In addition, Pandas lets us to input a custom method into the pivot_table() method. This significantly increases our capacity to deal with analyses that are specially targeted to our requirements! Let's look at how we may pass in a function that tests whether or not the value is Multi-platform.
Code:
This function receives a single input, values, which will be the pivot_table() function's values. Our plt variable is then used to determine whether the provided value is Multi-platform or not. Finally, based on the criteria, the Boolean result is returned. Let's examine how we can apply this to our Platforms column in our pivot table.
Code:
Output:
Difference Between Pivot Table and Group By
We saw in our previous article "Introduction to groupby in Pandas" how the GroupBy concept allows us to examine relationships within a dataset. Pivot tables in Pandas are comparable to the groupby() function in Pandas. The pivot table accepts simple column-wise data as input and organizes it into a two-dimensional DataFrame that gives a multidimensional overview of the data. The distinction between pivot tables in pandas and GroupBy is that pivot tables are multidimensional versions of GroupBy aggregation. That is, we divide, execute, or merge, but the divide and merge occur on a two-dimensional grid.
Aside from that, the object provided by the groupby() method is a DataFrameGroupBy object rather than a dataframe. As a result, standard Pandas DataFrame methods will not operate on this object.
Code:
Output:
Advanced Pivot Table Filtering in Pandas
A Pandas pivot table may also be used to filter data. As pivot tables are frequently rather extensive, filtering a pivot table may greatly focus the results. Because the method outputs a DataFrame, we could just filter it like any other.
Now we have the option of filtering by a constant or a dynamic value. We may, for example, just filter solely on an user defined value. However, if we wanted to only show instances where the Sales data was greater than the mean, we might employ the following filter:
Code:
Output:
This concludes our article, kudos! You now have a firm knowledge of Pandas’ pivot_table() method and can use it to extract relevant information from numerous real-world instances.
Explore the Hands-on Applications of These Concepts in Our Data Science Courses. Enroll Now and Turn Theoretical Knowledge into Practical Mastery.
Conclusion
This article taught us:
- A pivot table is a quantitative table that summarizes a large DataFrame, such as a large dataset.
- In Pandas, we use the pivot_table() function to generate pivot tables.
- Pandas' pivot_table() methods provide a fill_value argument, which we can use to fill all of the NaN values in our DataFrame before doing any computations.
- A pivot table Pandas method may also be used to filter data.
- Pivot tables in Pandas are comparable to the groupby() function in Pandas.
- The groupby() function returns a DataFrameGroupBy object rather than a dataframe.
- The key difference between pivot tables and GroupBy aggregation is that pivot tables are multidimensional versions of GroupBy aggregation.