Window Functions in Pandas
Overview
The Window functions in Pandas are used to perform some sort of calculations across a set of rows that are interrelated with the current row. The Windows functions help us to perform aggregated calculations across various partitions or cross-sections of the data. The aggregate function of SQL returns us a single value after performing the calculation specified in the SQL query. On the other hand, the Windows function in Pandas, returns a value for every row of the original table.
Introduction to Window Functions
Before getting into the window functions in Pandas, let us get a brief introduction to Pandas library in Python.
Pandas library is an open-source library that is built on top of another very useful Python library i.e., NumPy library. Pandas is an open-source package (or library) that provides highly optimized data structures and analysis tools. Pandas library is widely used in the field of data science, machine learning, and data analytics as it simplifies data importing and data analysis.
The Pandas library helps us to work with large data sets in terms of rows and columns. We generally use the Pandas library to deal with the CSV (Excel) files.
Pandas Python library offers us a wide variety of data structures and operations that helps in easy manipulation (add, update, delete) of numerical data as well as the time series. The prime reason for the Pandas library's popularity is its easy importing feature and easy data analyzing data feature. Pandas module is quite fast and comes in very handy because of its high performance and productivity.
Now, what are window functions in Pandas?
The window functions in Pandas are used to perform some sort of calculations across a set of rows that are interrelated with the current row. As we know, we have aggregate functions in SQL, which help us to perform mathematical calculations among the columns of a table. Similarly, windows functions help us to perform aggregated calculations across various partitions or cross-sections of the data.
There is a major difference between the standard aggregate function of SQL and Windows functions in Pandas. The aggregate function of SQL returns us a single value after performing the calculation specified in the SQL query. On the other hand, the Windows function in Pandas, returns a value for every row of the original table.
A question that comes to our mind after reading the Windows function is what exactly is a window? Well, a window is a value (in terms of rows) that tells us the distance between our current row and the row which is to be used for calculations.
For example, refer to the table provided below.
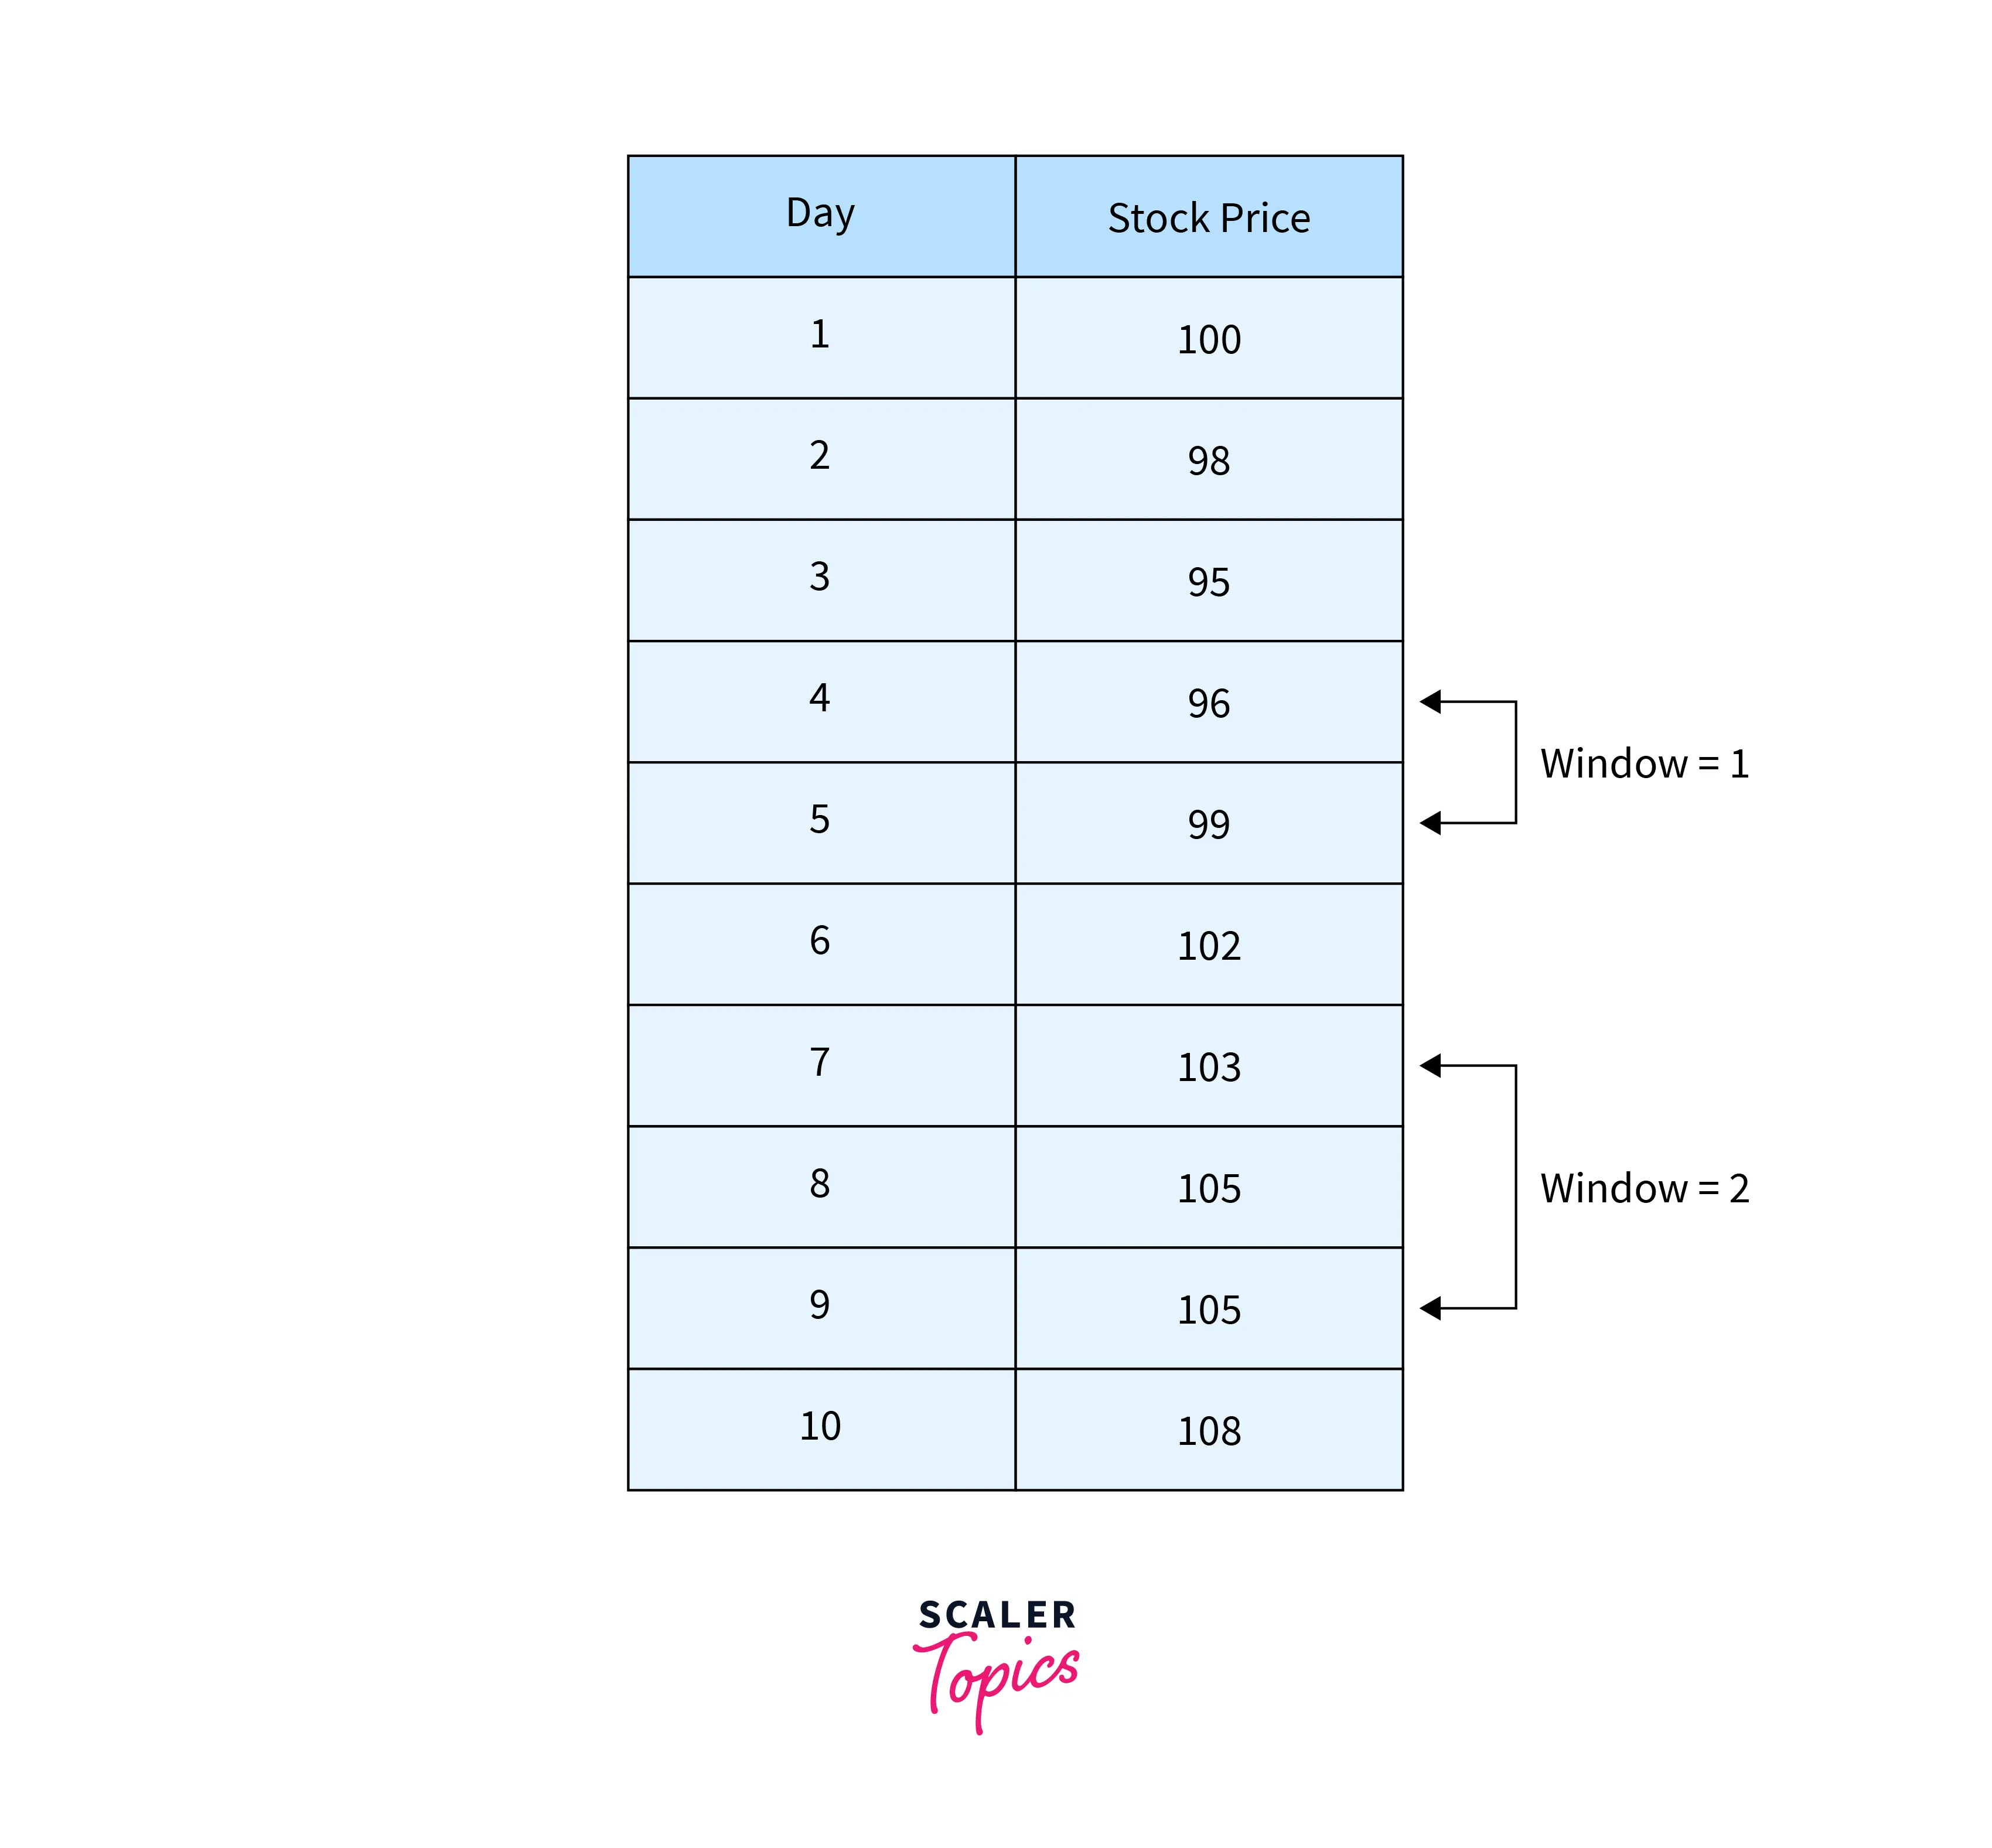
In the above table, we can see the Marks of the students. Now, if we want to perform some kind of computation or calculation, then we can use the Windows function inPandas. For example, if we want to compare the marks of the first student with the marks of the second student, then we can do that using the windows function. We can pass the value 1 as we want to check a window that is one row away from the current row. Similarly, if we are the 5th student and we want to compare his/her marks with the first student, then we can pass the value of the window size in the window function to obtain the result.
Scaler Placement Report and Statistics
Scaler learners achieved 2.5x salary growth with average post-Scaler CTC reaching ₹23L.
Python Window Functions Overview Diagram
Let us now take an overview of the Windows function in Pandas with the help of a diagram.
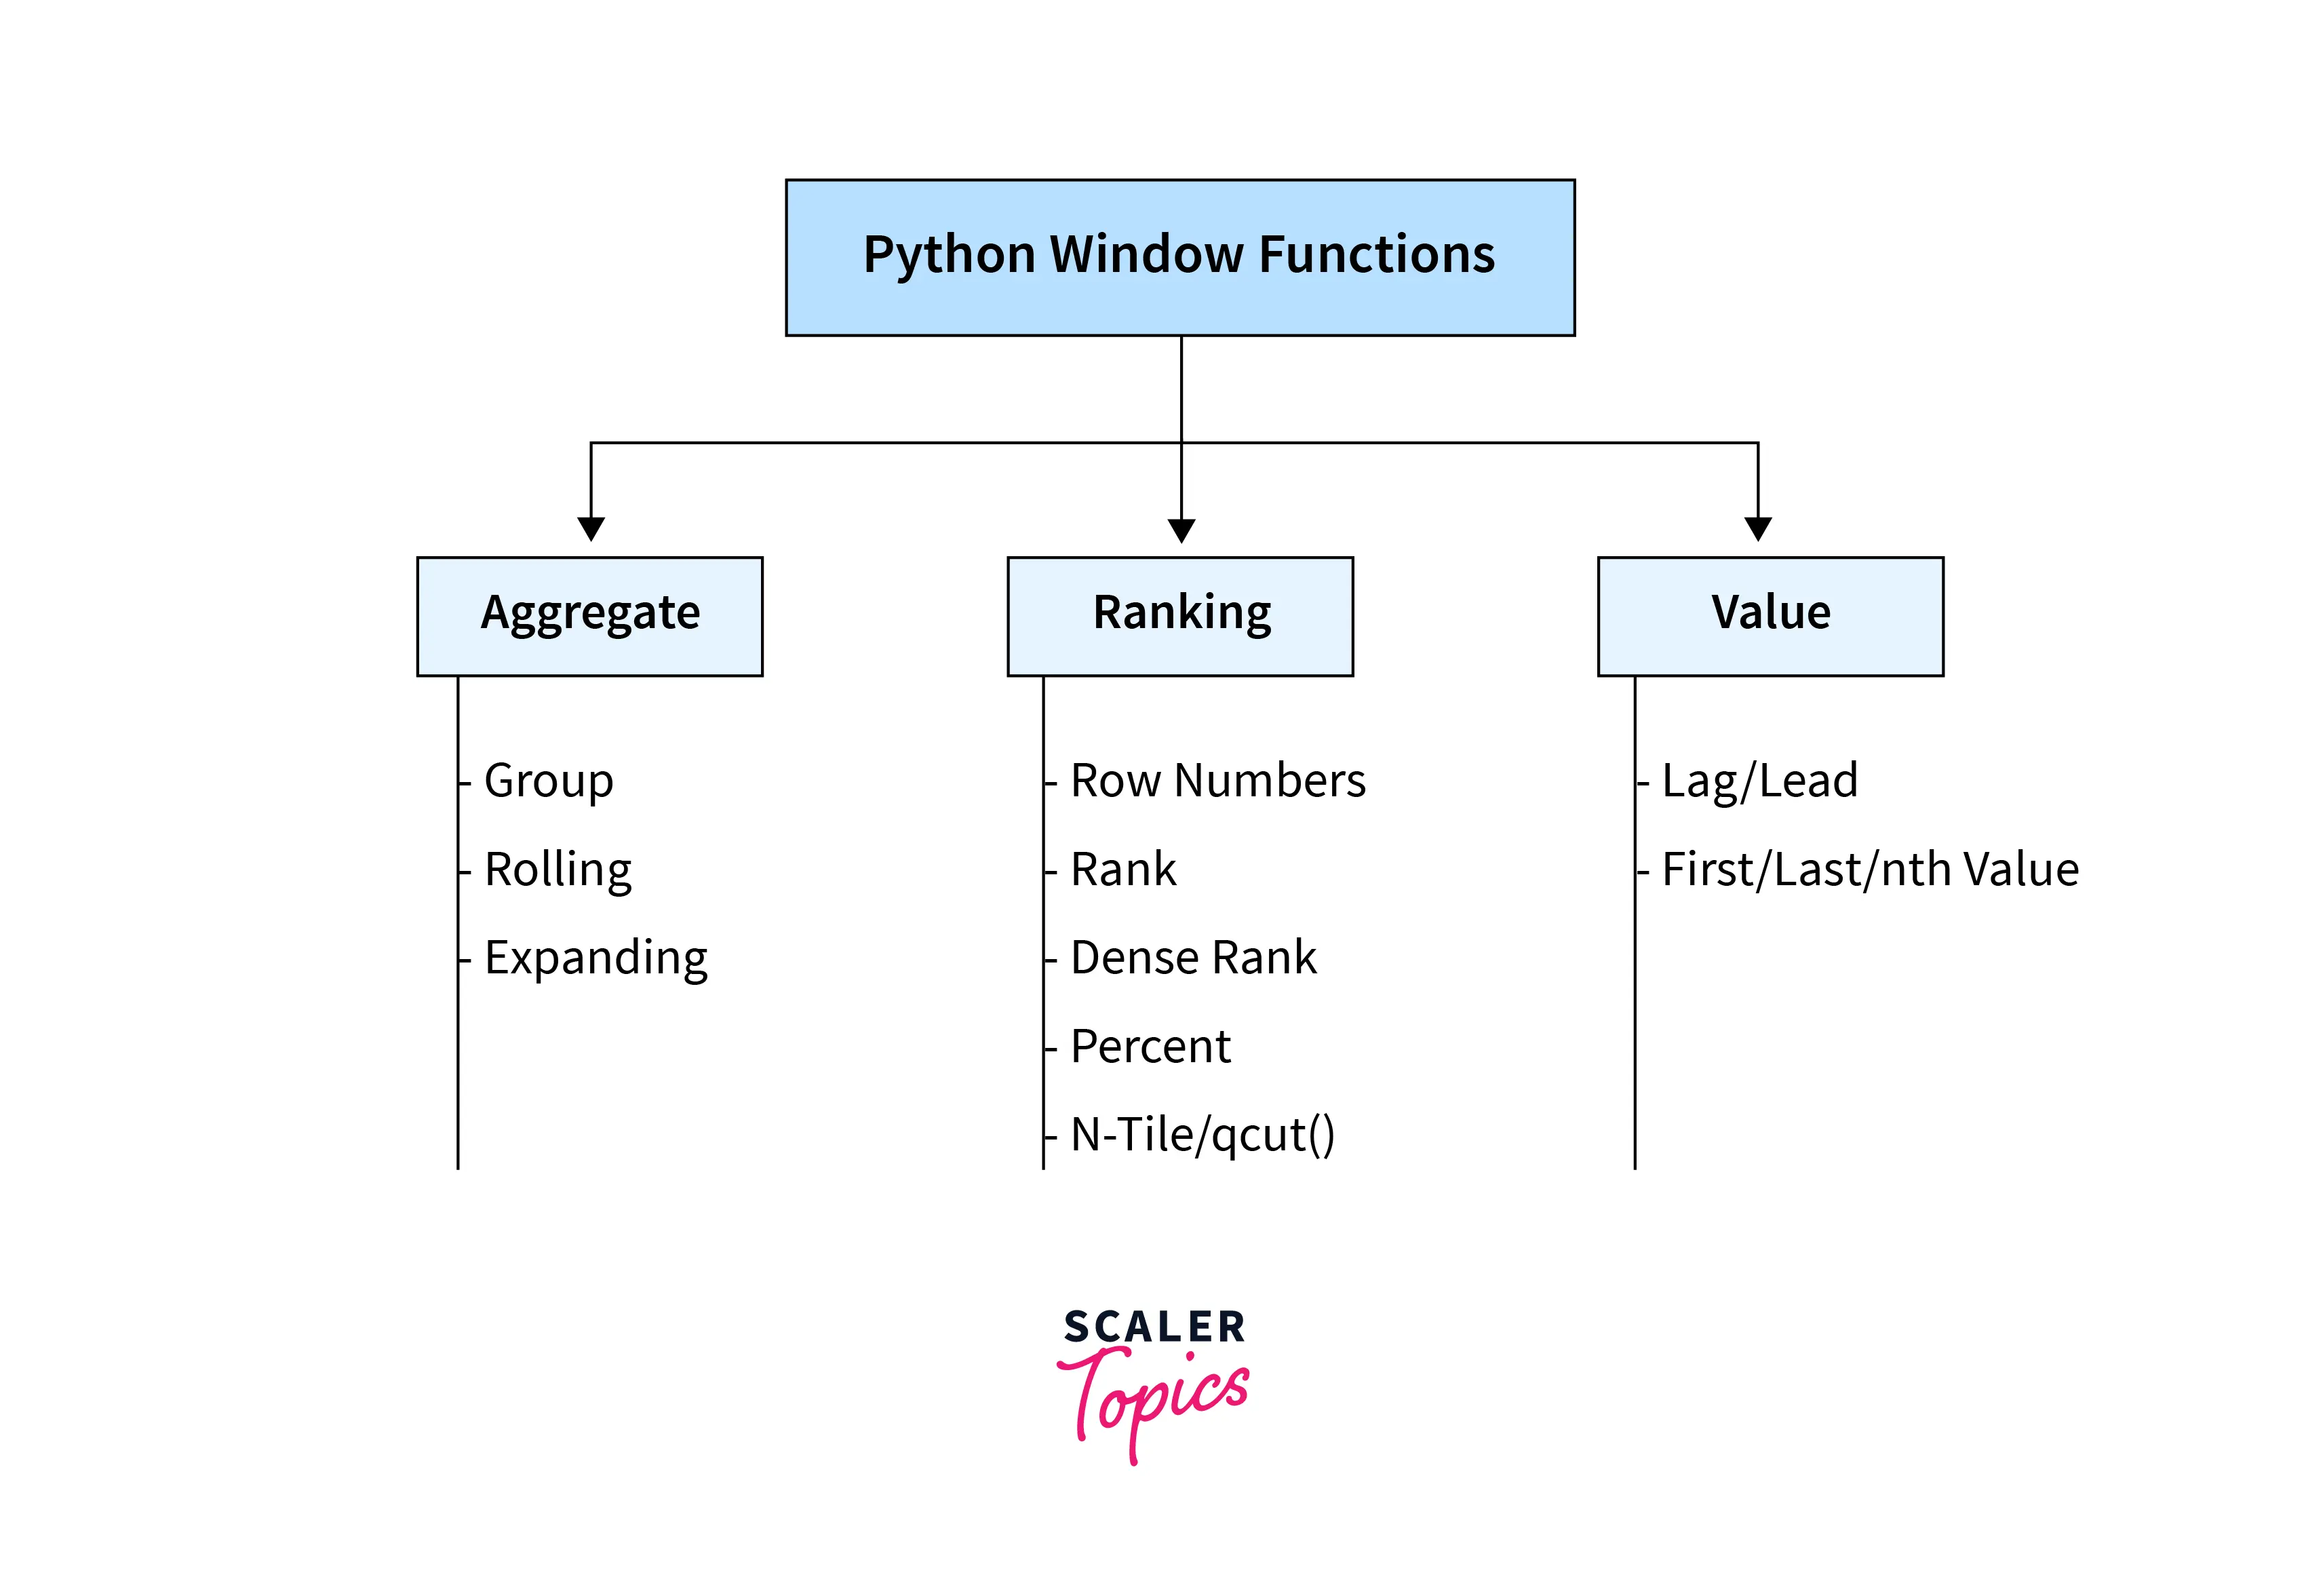
Windows function in Pandas can be broadly divided into three categories, namely- Aggregate, Ranking, and Value.
The Aggregate category of window functions can be of three types, namely-
- Group,
- Rolling, and
- Expanding.
The Ranking category of window functions can be of five types, namely-
- Row Numbers,
- Row numbers if of two types:
- reset_index()
- cumcount()
- Row numbers if of two types:
- Rank,
- Rank is of four types:
- default_rank
- min_rank
- NA_bottom
- descending
- Rank is of four types:
- Dense rank,
- Percent, and
- N-Tile / qcut().
The Value category of window functions can be of two types, namely-
- Lag / Lead, and
- First / Last/nth.
Different Window Operations in Pandas
We generally use the Windows functions if we are dealing with time series data. So, if we want to know what has happened at some point in time, we can use the Windows function in Pandas. Let us now learn about the various Windows Functions and operations in this section.
Transform Your Career
Choose from our industry-leading programs designed for career success
Modern Software and AI Engineering Program
Master full-stack development with AI integration

Modern Data Science and ML with specialisation in AI
Advanced data science techniques with AI specialization
Advanced AIML with Specialisation in Agentic AI
Deep dive into AIML with focus on Agentic systems
DevOps, Cloud & AI Platform Engineering
Build and manage AI-powered cloud infrastructure
AI Engineering Advanced Certification by IIT-Roorkee
Premier AI engineering certification from IIT-Roorkee
1. Group by
The group by aggregate function can be used to partition and group the entire data frame by some column. We can specify the column name in the parameter of the pandas. groupby() function for grouping the specified column data.
For example, if we have the data of customers of a shopping application, the data can have an entry of the same user multiple times as a single user can buy various items. So, in such scenarios, we can use the DataFrame.groupby() aggregate function to group all the products of the same customer. For grouping the customer, we need to pass the column name (here, customer_name is the column name of the DataFrame) as the parameter to the DataFrame.groupby() function.
Scaler Placement Report and Statistics
Scaler learners achieved 2.5x salary growth with average post-Scaler CTC reaching ₹23L.
2. Rolling
The DataFrame.rolling() function is used to perform rolling window calculations and is generally used in the case of signal processing data and time series data. In the rolling function, we take a window size (let's say k) and then perform desired calculations on it. Here the window size resembles the number of consecutive values to be taken into consideration at a time.
Let us now take a look at the syntax of the DataFrame.rolling function.
The parameters of the DataFrame.rolling() function are:
- window: It specifies the size of the moving window that has to be considered. Each of the windows will be of fixed size. The size of the window can vary if we have DateTime-like indexes.
- min_periods: It specifies the minimum number of observations required to gather a value in the window. The default value of the min_periods parameter is None. If the window is specified by an offset value, then the default value of this parameter is set to 1.
- freq: It is used to specify the data that should be confirmed before computing. The default value of the freq parameter is set to None.
- centre: It is used to set the labels to the centre of the window. The default value of the centre parameter is set to False.
- win_type: It is used to set the type of window to be used. The default value of the win_type parameter is set to None.
- on: It is used to specify the column on which the rolling window calculation should start rather than the index. The default value of the on parameter is set to None.
- closed: It is used to make the intervals closed on the "right", "left", "both", or "neither" endpoints. The default value of the closed parameter is set to both in the case of the fixed window but in the case of an offset-based window, the default value is set to right.
- axis: It is used to specify the axis of the DataFrame. Axis 0 resembles a row and axis 1 resembles a column. The default value of the axis parameter is set to 0.
a. Centring Windows As we know that the default value of the label is set to the right edge, but we can set the edge of the window to the centre using the centre keyword. Let us take an example to understand the context better.
Example:
Output:
b. Rolling Window Endpoints
Let us now take an example of a Timestamp and set the various values of the closed parameter to see the working of the closed parameter. The right value in the closed parameter resembles the closed right endpoint, similarly the left value in the closed parameter resembles the closed left endpoint. both values resemble both the endpoints of the label and neither resembles that both the endpoints are open.
Example:
Output:
c. Custom Window Rolling
As we have seen that the window accepts an integer or an offset as an argument, but if we want to define a custom method for calculating the window bounds, we can do so by using the BaseIndexer subclass present in the pandas.api.indexer. Now for defining the custom bounds of the window, we need to define the method - get_window_bounds, this method returns a tuple consisting of two arrays. The first array is the starting indices of the window and the second array is the ending indices of the window.
Note: If we define the get_window_bounds method then the num_values, min_periods, centre , and closed parameters are automatically passed to the function as the function must accept these arguments.
Example:
Output:
d. Rolling Apply
We have another function apply() that takes an extra argument named func argument and it also performs rolling computation. Now we specify the raw argument in the apply() function and if the value of the raw is set to True then the function produces a single value from an array input and if the raw is set to False then the function produces Series objects.
Let us take an example for more clarity.
Example:
Output:
e. Numba Engine
numba is a module that translates the Python functions into an optimized machine code at the run time using the LLVM compiler. So, we use numba for faster computations.
We can specify whether to use numba or not in the apply() method. Now, before using numba, we must install it. So, if we want to use the numba engine, we can specify the argument engine='numba' in the apply() method's parameter. One thing we should keep in mind is that for using the numba engine, we must set the raw parameter value to True.
f. Binary Window Functions
We have two binary functions namely - cov() and corr(), which can compute the statical computation on a moving window. The binary functions work on two Series or a combination of DataFrame, Series or DataFrame, DataFrame.
-
In the case of two series, the function computes the statistic for the pairing.
-
In the case of DataFrame, Series, the function computes the statistics for each column of the DataFrame with the other Series. It finally returns the updated DataFrame.
-
In the case of DataFrame, DataFrame, the function computes the statistic for matching column names and it then returns the updated DataFrame.
g. Computing Rolling Pairwise Covariances and Correlations
We generally use the computing rolling pairwise covariances and correlations in the case of financial data analysis and other related fields. In such scenarios, we use the moving-window covariance and correlation matrices. We can pass the pairwise keyword into the argument, which yields a multi-indexed DataFrame having indexes dated in questions. If we have a single DataFrame then we can omit the pairwise argument.
3. Expanding
If we want to yield a value of the aggregate statistics with all the data that are available up to a certain point in time, we use expanding window.
Let us take an example for more clarity.
Output:
4. Exponentially Weighted Window
The exponentially weighted window is somewhat similar to the expanding window (that we have discussed above) but the basic difference between both of them is that in Exponentially Weighted Window, each priority point is exponentially weighted down relative to the current point.
The weighted moving average is calculated as:
where is the input, is the result and the are the weights.
Please refer to the Pandas documentation for more details about the formula.
Ranking
Let us now learn about ranking and various methods associated with ranking in Windows function in Pandas.
1. Row Number
If we want to calculate the number of rows, we can use two different functions depending on two different situations. Let us learn about both of these functions.
a. reset_index()
The reset_index() function is used to count the number of rows across the entire data frame. If we use this function within a DataFrame, then the function returns the number of each row.
The syntax of the reset_index() function is:
b. cumcount()
The cumcount() function is used to count the number of rows within the groups of the data frame. The cumcount() function is usually used with the groupby() function. The default counting of the row starts with 0 but, if we want to start the count of the row from 1, we can add +1 to the cumcount() function.
The syntax of the cumcount() function is:
Turn Learning into Career Growth
2. Rank
Let us now learn about rank and ranking functions in Windows functions in Pandas. As the name suggests, the ranking function is used to state some sort of rank based on a certain variable provided in the function parameter.
The general syntax of the rank() function is:
Let us now learn about various ranking functions.
a. default_rank
The default_rank() function by default assumes that the ranking should be done in ascending order. If there are null values present, then this function does not consider the null values and leaves them as null. If two/ more values are the same, then the rank is divided (split), and it is averaged between the values.
b. min_rank
The min_rank works the same as the rank() function of SQL. As we have discussed in the previous section that if two/ more values are the same then the parameter method=min, does not takes the average ranked value, but it takes the minimum rank between equal values.
c. NA_bottom
As we have discussed prior, if we have some null values, then the default_rank() leaves the null values as it is, but in certain cases, we may want the null values to rank the lowest or the highest. So, in such scenarios, we set the NA_option as bottom so that the function will give the highest ranked value. Similarly, if we set the NA_option as top then the function would give the lowest ranked value.
d. descending
As the name suggests, if we want to change the default ranking order (ascending), we can set the rank in descending order by setting the ascending parameter to False.
3. Dense Rank
The dense rank is somewhat similar to the dense rank, but there is a slight difference between both them. The dense ranking does not skip the ranking numbers (The normal rank function may sometimes skip the ranking numbers).
The general syntax of the rank function with dense rank is:
4. Per Cent Rank
The per cent rank or percentile is nothing but the representation of the rank by comparing each one of the ranks with the highest rank. The per cent rank (pct) is a boolean parameter that can be set as True or False.
The general syntax of the rank function with per cent rank is:
5. N-Tile / qcut()
N-Tile and qcut() are lesser-used functions as they rank based on quantities beyond the percentiles which is quite uncommon. The qcut() function is used to rank according to some quantity specified in the parameter to the function.
The general syntax of the qcut() function is:
Let us take a quick look at the various parameters of the qcut() function.
- DataSeries: The DataSeries resembles the series or the column that has been analyzed.
- number_quantities: The number_quantities resembles the number of quantities to be split by.
- labels: Labels denote the range of the ntiles
Value
Let us now learn about the value of the Windows function in Pandas.
Lag / Lead
The lag and the lead functions are used to represent another column(s) but the column(s) is shifted by a single row or multiple rows. The lag and lead columns generated are very helpful in making side-by-side comparisons.
The syntax of lag and lead function is:
First / Last / nth value
As the name suggests, the nth value in the windows function in Pandas is used to find the nth value (including the first and the last value) within the groups of the DataFrame or data set. The nth() value function is used with the groupby() function.
The syntax of the nth value function is:
In the nth() function, 0 represents the first value and -1 represents the last value.
Conclusion
- The Pandas library helps us to work with large data sets in terms of rows and columns. The prime reason for the Pandas library's popularity is its easy importing feature and easy data analyzing data feature.
- The window functions in Pandas are used to perform some sort of calculations across a set of rows that are interrelated with the current row.
- The Windows functions help us to perform the aggregated calculations across various partitions or cross-sections of the data.
- A window is a value (in terms of rows) that tells us the distance between our current row and the row which is to be used for calculations.
- Windows function in Pandas can be broadly divided into three categories namely- Aggregate, Ranking, and Value.
- The group by aggregate function can be used to partition and group the entire data frame by some column. We can specify the column name in the parameter of the pandas. groupby() function for grouping the specified column data.
- The DataFrame.rolling() function is used to perform rolling window calculations and is generally used in the case of signal processing data and time series data.
- If we want to yield a value of the aggregate statistics with all the data that are available up to a certain point in time, we use expanding window.
- The reset_index() function is used to count the number of rows across the entire data frame. The cumcount() function is used to count the number of rows within the groups of the data frame.
- The lag and the lead functions are used to represent another column(s), but the column(s) is shifted by a single row or multiple rows.