Python - Pandas.pivot_table()
Overview
Pivot table in Python enables you to extract important insights from massive volumes of data. With its many modules, such as Pandas, Python makes it simple to generate Pivot Tables. A Pivot Table helps you reorganize and summarize data, revealing patterns and trends that might go unnoticed. Python's ability to generate Pivot Tables, which every modern analyst should pay attention to, might aid you in making data-driven judgments.
Pandas.pivot_table() Method
The pivot_table() function is found in the Pandas library of Python. It is widely used to deal with large datasets.
- The pivot_table() function summarizes and analyses data by generating a pivot table - a two-dimensional table in which columns become rows and vice versa.
- You may define the required structure by selecting which columns operate as rows, columns, and aggregate values. This dynamic technique lets you compute numerous metrics such as sums, averages, and more on grouped data.
- It supports parameters like index, columns, and values, allowing you to fine-tune the design of the pivot table. You may also use functions to aggregate data, handle missing values, and customize data display.
- The pivot_table() function is used in data analysis, business intelligence, and beyond.
Pandas.pivot_table() Syntax
Let us now look at the syntax of the Pivot table in Python.
Here's the syntax of the Pandas pivot_table() method:
- Various arguments in the pivot_table() function allow you to reshape and summarize data easily.
- The option data refers to the DataFrame being analyzed. You can choose the column to aggregate using the values argument.
- You specify the row and column headings for the resultant pivot table by giving the index and columns parameters.
- The aggregation function is specified via the aggfunc option, which defaults to mean. You may utilize functions like sum and count.
- The fill_value argument is used to fill in missing data. When margins is set to True a row and column displaying subtotals are added. dropna can be used to customize how missing values are handled.
- Finally, when margins is enabled, margins_name provides the label for the 'All' row and column. Understanding this syntax allows you to wield the power of the pivot_table() function for flexible data transformation and summarization.
Pandas.pivot_table() Parameters
Let us now look at the parameters of the Pivot table in Python.
Pandas, a comprehensive and sophisticated Python data manipulation toolkit, has the pivot_table() function, which is useful for reshaping and summarizing data. This approach transforms data into a more organized format, making it easier to obtain insights. Let's look at the parameters that may be adjusted and the value returned by this procedure.
- data: The DataFrame holding the data to pivot is specified by this argument. It serves as the foundation for analysis and transformation.
- values: This is where you define the DataFrame column from which values will be aggregated. These numbers will be summarized depending on the pivot's other parameters.
- index: The index argument specifies which columns will become the pivoted table's new index. These index columns will be used to categorize and aggregate data.
- columns: This option allows you to categorize and segment the data more. The provided column's unique values create new columns in the pivoting table.
- aggfunc: This option, which stands for aggregation function, governs how the data is summarized. You may utilize functions such as sum, mean, count, and others to process the values.
- fill_value: If there are any gaps following the pivot, this option fills them with the provided value.
Pandas.pivot_table() Returns
The pivot_table() function provides a new DataFrame that has been neatly rebuilt based on the parameters sent in. The new DataFrame's columns will be determined by the columns argument and its index by the index parameter. Let us now look at the various important points regarding the Pivot table in Python.
- The DataFrame cells will be filled with aggregated values from the supplied values column, aggregated using the function provided in aggfunc.
- The benefit of this strategy is that it may deliver concise insights at a look. It converts complicated, unstructured material into an organized, easily understandable format. This aids in making data-driven decisions and uncovering insights that would otherwise be concealed.
- Pandas's pivot_table() function is a gold mine for data analysts and scientists. Understanding its parameters and return results allows you to efficiently reorganize and decode your data, making your research more effective and insightful.
Examples of Pandas.pivot_table()
Let us look at several examples related to the Pivot table in Python.
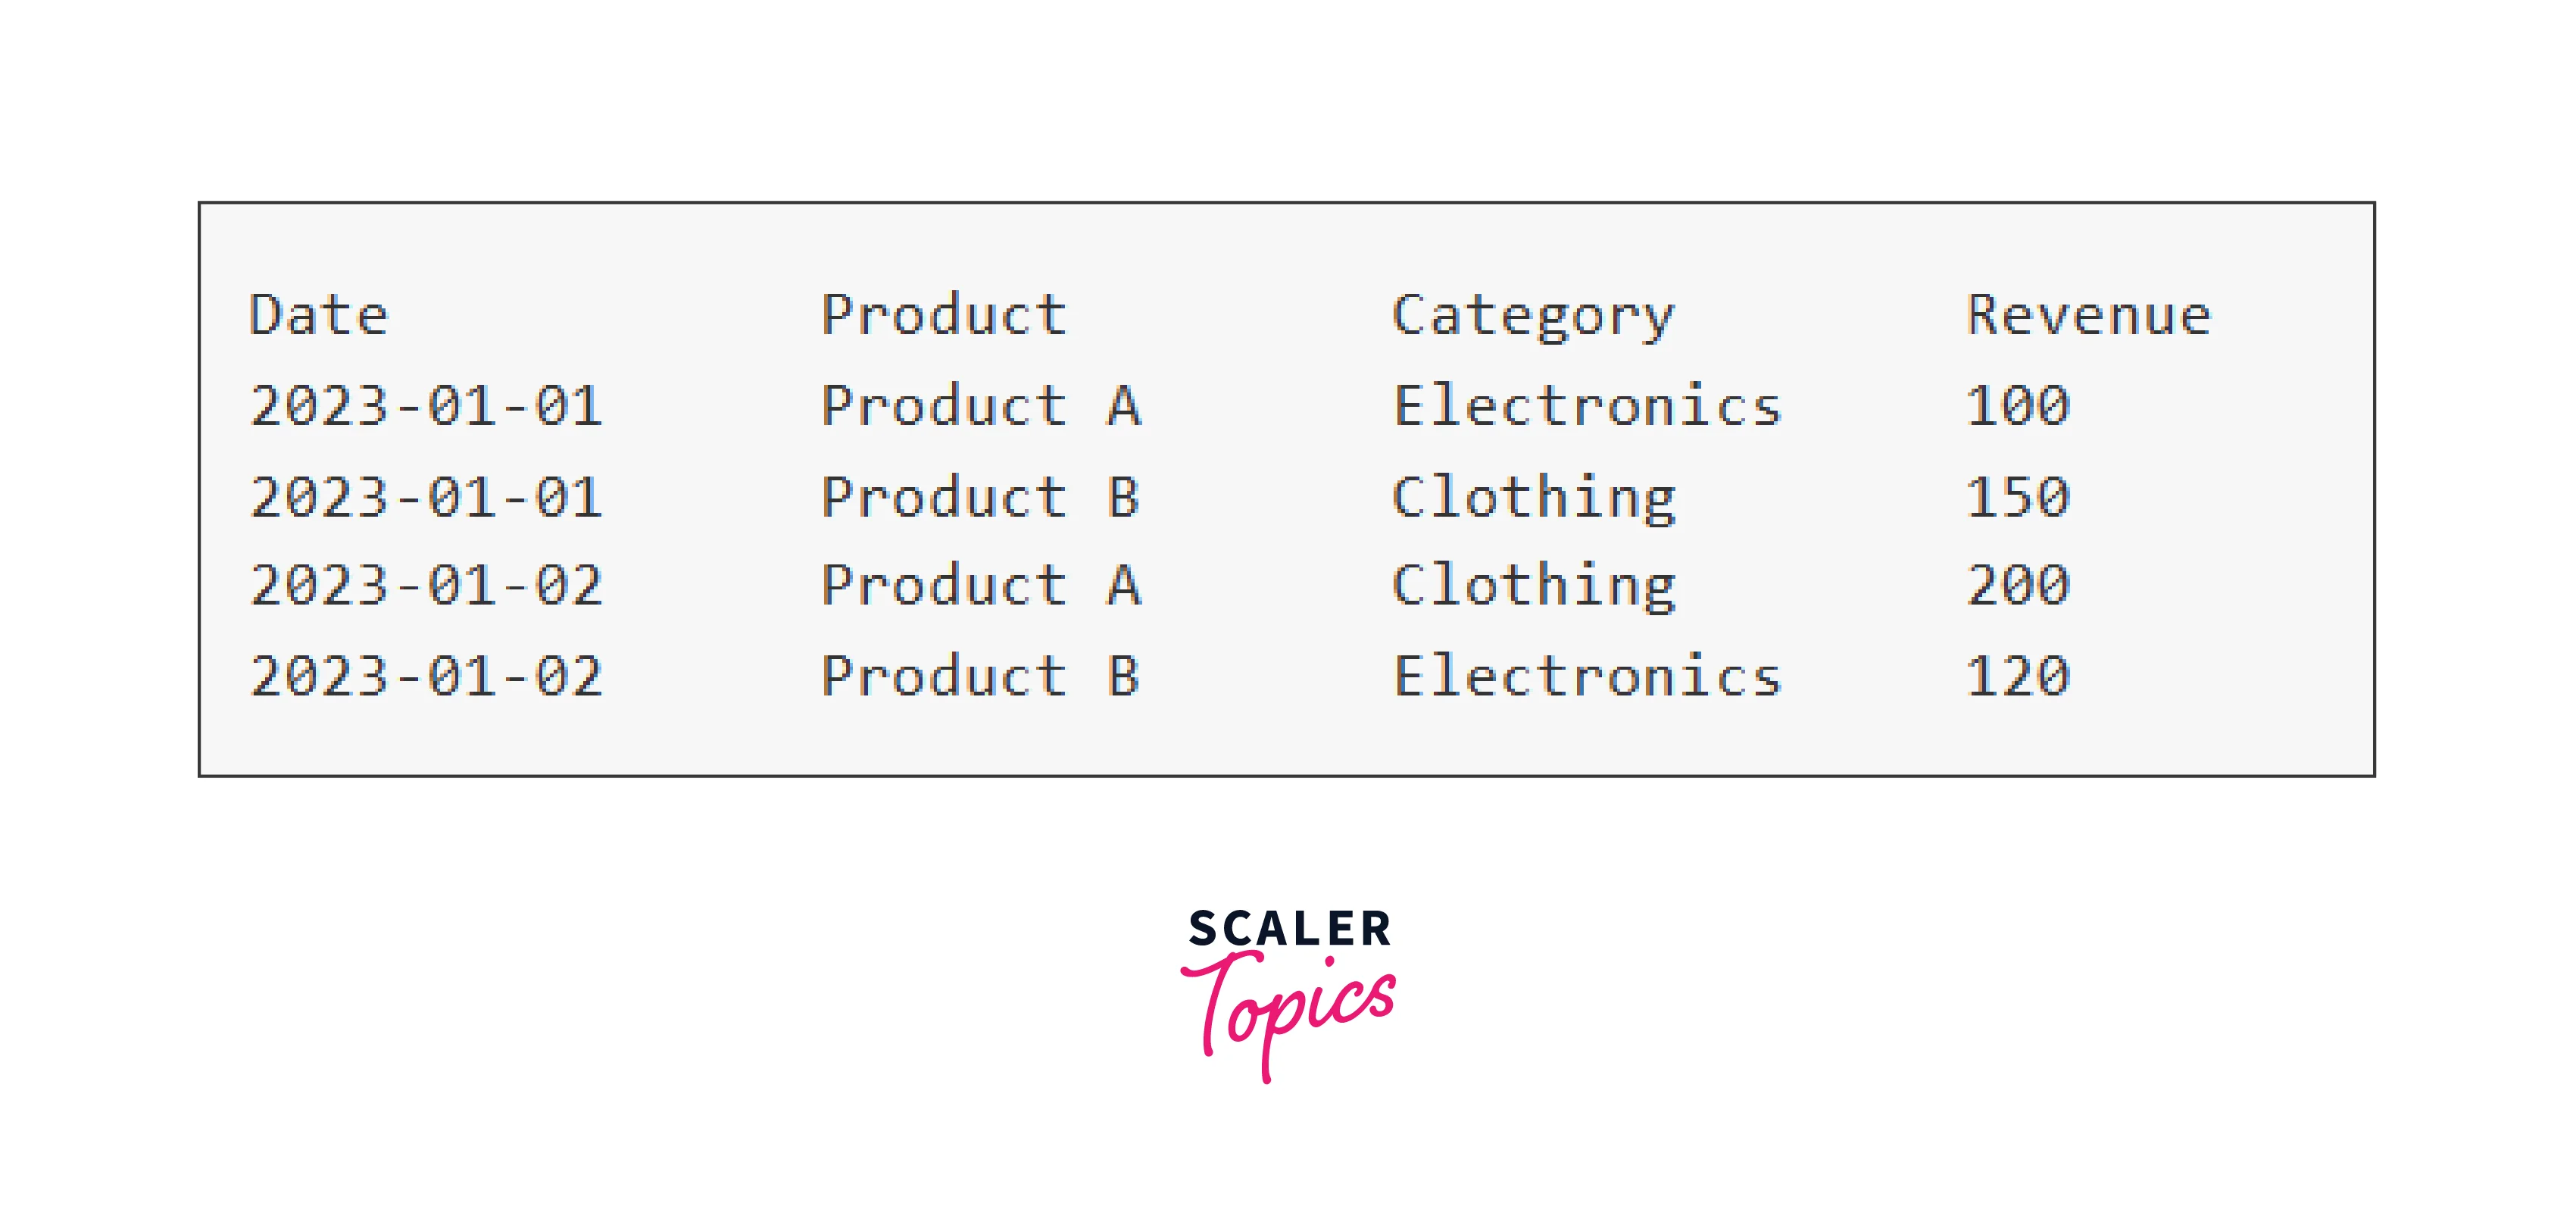
Assuming the given sales data:
How to Create a Pandas Pivot Table?
Using Pandas to create a Pivot Table is a breeze. Imagine you have a dataset containing sales data for a retailer, including columns for Date, Product, Category, and Revenue. You want to look at the overall revenue for each product across all categories. The Python code below explains how to accomplish this:
Output:
How to Calculate With Pandas Pivot Table?
Pandas Pivot Tables excel at conducting computations on grouped data. Assume you want to determine each category's average and maximum revenue in your sales dataset. The code below demonstrates how to accomplish this with a Pivot Table:
Output:
How to Style Your Pandas Pivot Table?
Aesthetics are extremely important in data representation. Pandas Pivot Tables allow you to customize your output for improved visualization. Assume you want to highlight the highest revenue value in each cell. The code below shows how to style a Pivot Table with the Styler class.
Output:
Advanced Examples of Pivot table in Python
-
Time-based Analysis:
Imagine you have a dataset with daily sales data and you want to analyze the trends over months and years. You can use a pivot table to group the data by month and year while calculating the total revenue for each period. This can help you identify seasonal patterns and long-term growth trends.
Output:
-
Hierarchical Aggregation:
Suppose you have a dataset of employee performance with columns for "Department," "Team," and "Performance Score." You want to analyze the average performance score at both the department and team levels.
Output:
-
Categorical Analysis:
If you're dealing with categorical data, you might want to analyze how different categories interact with each other. For instance, analyzing the frequency of product combinations bought together in an online store dataset.
Output:
Advantages of Pandas Pivot Tables
Pivot table in Python offer an array of advantages that solidify their importance in data analysis:
-
Simplicity and Flexibility:
Pandas Pivot Tables provide a simple and intuitive syntax for transforming and summarizing data. This simplicity allows data analysts to quickly generate complex reports and insights without the need for extensive coding.
-
Dynamic Updating:
Pivot Tables in Pandas are designed to adapt automatically when the source data changes. This dynamic updating is particularly beneficial when dealing with datasets that are subject to frequent updates or modifications.
-
Multi-dimensional Analysis:
One of the key advantages of Pivot Tables is their support for multi-dimensional analysis. This means you can analyze data across multiple dimensions or attributes simultaneously.
-
Aggregation and Calculation:
Pivot Tables enable you to perform a wide range of computations and aggregations on your data. You can easily.
Conclusion
- Pivot table in Python simplifies data summarization by providing for quick analysis of trends, patterns, and outliers.
- With pivot tables, you can slice, split, and analyze data from numerous perspectives, uncovering previously unknown associations.
- The ability to dynamically change column data, converting rows to columns and vice versa, gives a dynamic data view.
- Python's pivot table modules provide many customization possibilities, allowing tables to be tailored to individual needs while improving readability and understanding.
- Pivot tables are strong business intelligence tools that provide decision-makers with actionable insights from complicated facts.