Data Analysis on Superstore Dataset using Power BI
Overview
In the ever-evolving landscape of business intelligence, harnessing the power of data analysis has become paramount for businesses worldwide. This article delves into a hands-on exploration of a Superstore dataset using the robust tools and capabilities offered by Power BI. As businesses generate and accumulate massive volumes of data, the need for actionable insights becomes critical. By leveraging the capabilities and features of Power BI, we can uncover hidden trends, patterns, and opportunities within the Superstore dataset. Through a step-by-step analysis, we not only demonstrate the potential of Power BI but also offer readers practical insights into performing effective exploratory data analysis.
What Are We Building?
In this project, we are performing build sales and profit dashboard using Power BI to discover insights, patterns, relationships, and trends within the Superstore dataset, enabling informed decision-making for business growth.
Transform Your Career
Choose from our industry-leading programs designed for career success
Modern Software and AI Engineering Program
Master full-stack development with AI integration

Modern Data Science and ML with specialisation in AI
Advanced data science techniques with AI specialization
Advanced AIML with Specialisation in Agentic AI
Deep dive into AIML with focus on Agentic systems
DevOps, Cloud & AI Platform Engineering
Build and manage AI-powered cloud infrastructure
AI Engineering Advanced Certification by IIT-Roorkee
Premier AI engineering certification from IIT-Roorkee
Pre-requisites
Here are a few of the prerequisites for undertaking the Data Analysis on the Superstore Dataset using the Power BI project. By meeting these prerequisites, you'll be well-prepared to dive into the project and extract meaningful insights from the Superstore dataset using Power BI.
- Power BI Desktop -
Ensure you have Power BI Desktop installed on your computer. You can download it from the official Microsoft Power BI website. - Basic Data Analysis Concepts -
Familiarize yourself with concepts like data cleaning, transformation, and visualization. This knowledge will be crucial in extracting meaningful insights from the dataset. - Basic Excel Skills -
A foundational knowledge of Excel is beneficial for data preprocessing and manipulation before importing into Power BI. - Visualization Concepts -
Basic comprehension of data visualization principles and chart types, like bar charts, line graphs, and pie charts. - Business Context -
Understand the business domain and context of the Superstore dataset. This will guide your analysis and help in identifying relevant insights.
How Are We Going To Build This?
Our data analysis project on the Superstore dataset encompasses several key steps. We initiate by understanding the problem statement and the objectives of our analysis. Subsequently, we collect the Superstore dataset and import it into the dynamic environment of Power BI. Here, the importance of data cleaning and transformation comes to the fore as we meticulously prepare the dataset for analysis, addressing inconsistencies, missing values, and outliers. As our canvas takes shape, we begin constructing the Superstore Sales & Profit Report. Employing Power BI's intuitive interface, we craft engaging visualizations that unveil the story hidden within the data and answer a wide range of queries. Charts, graphs, and dashboards illuminate trends and correlations, offering valuable insights to drive strategic decision-making. Finally, we publish our report, making it accessible to stakeholders.
Exploratory Data Analysis on Superstore Dataset using Power BI
Let’s perform the exploratory data analysis on the Superstore dataset using the step-by-step guide mentioned below -
Step 1: Understanding Problem Statement
In this initial step, we'll define the goals and objectives of our exploration and clarify what we aim to achieve with the Superstore dataset. Our primary business objectives include uncovering the top-performing products, sub-categories, and categories based on factors like quantity, sales, and profit. Beyond this, we'll seek out additional insights and observations hidden within the data. Lastly, we also want to set up a system to track key performance indicators (KPIs) over time, enabling us to monitor the health and growth of our business.
Turn Learning into Career Growth
Step 2: Importing Data into Power BI
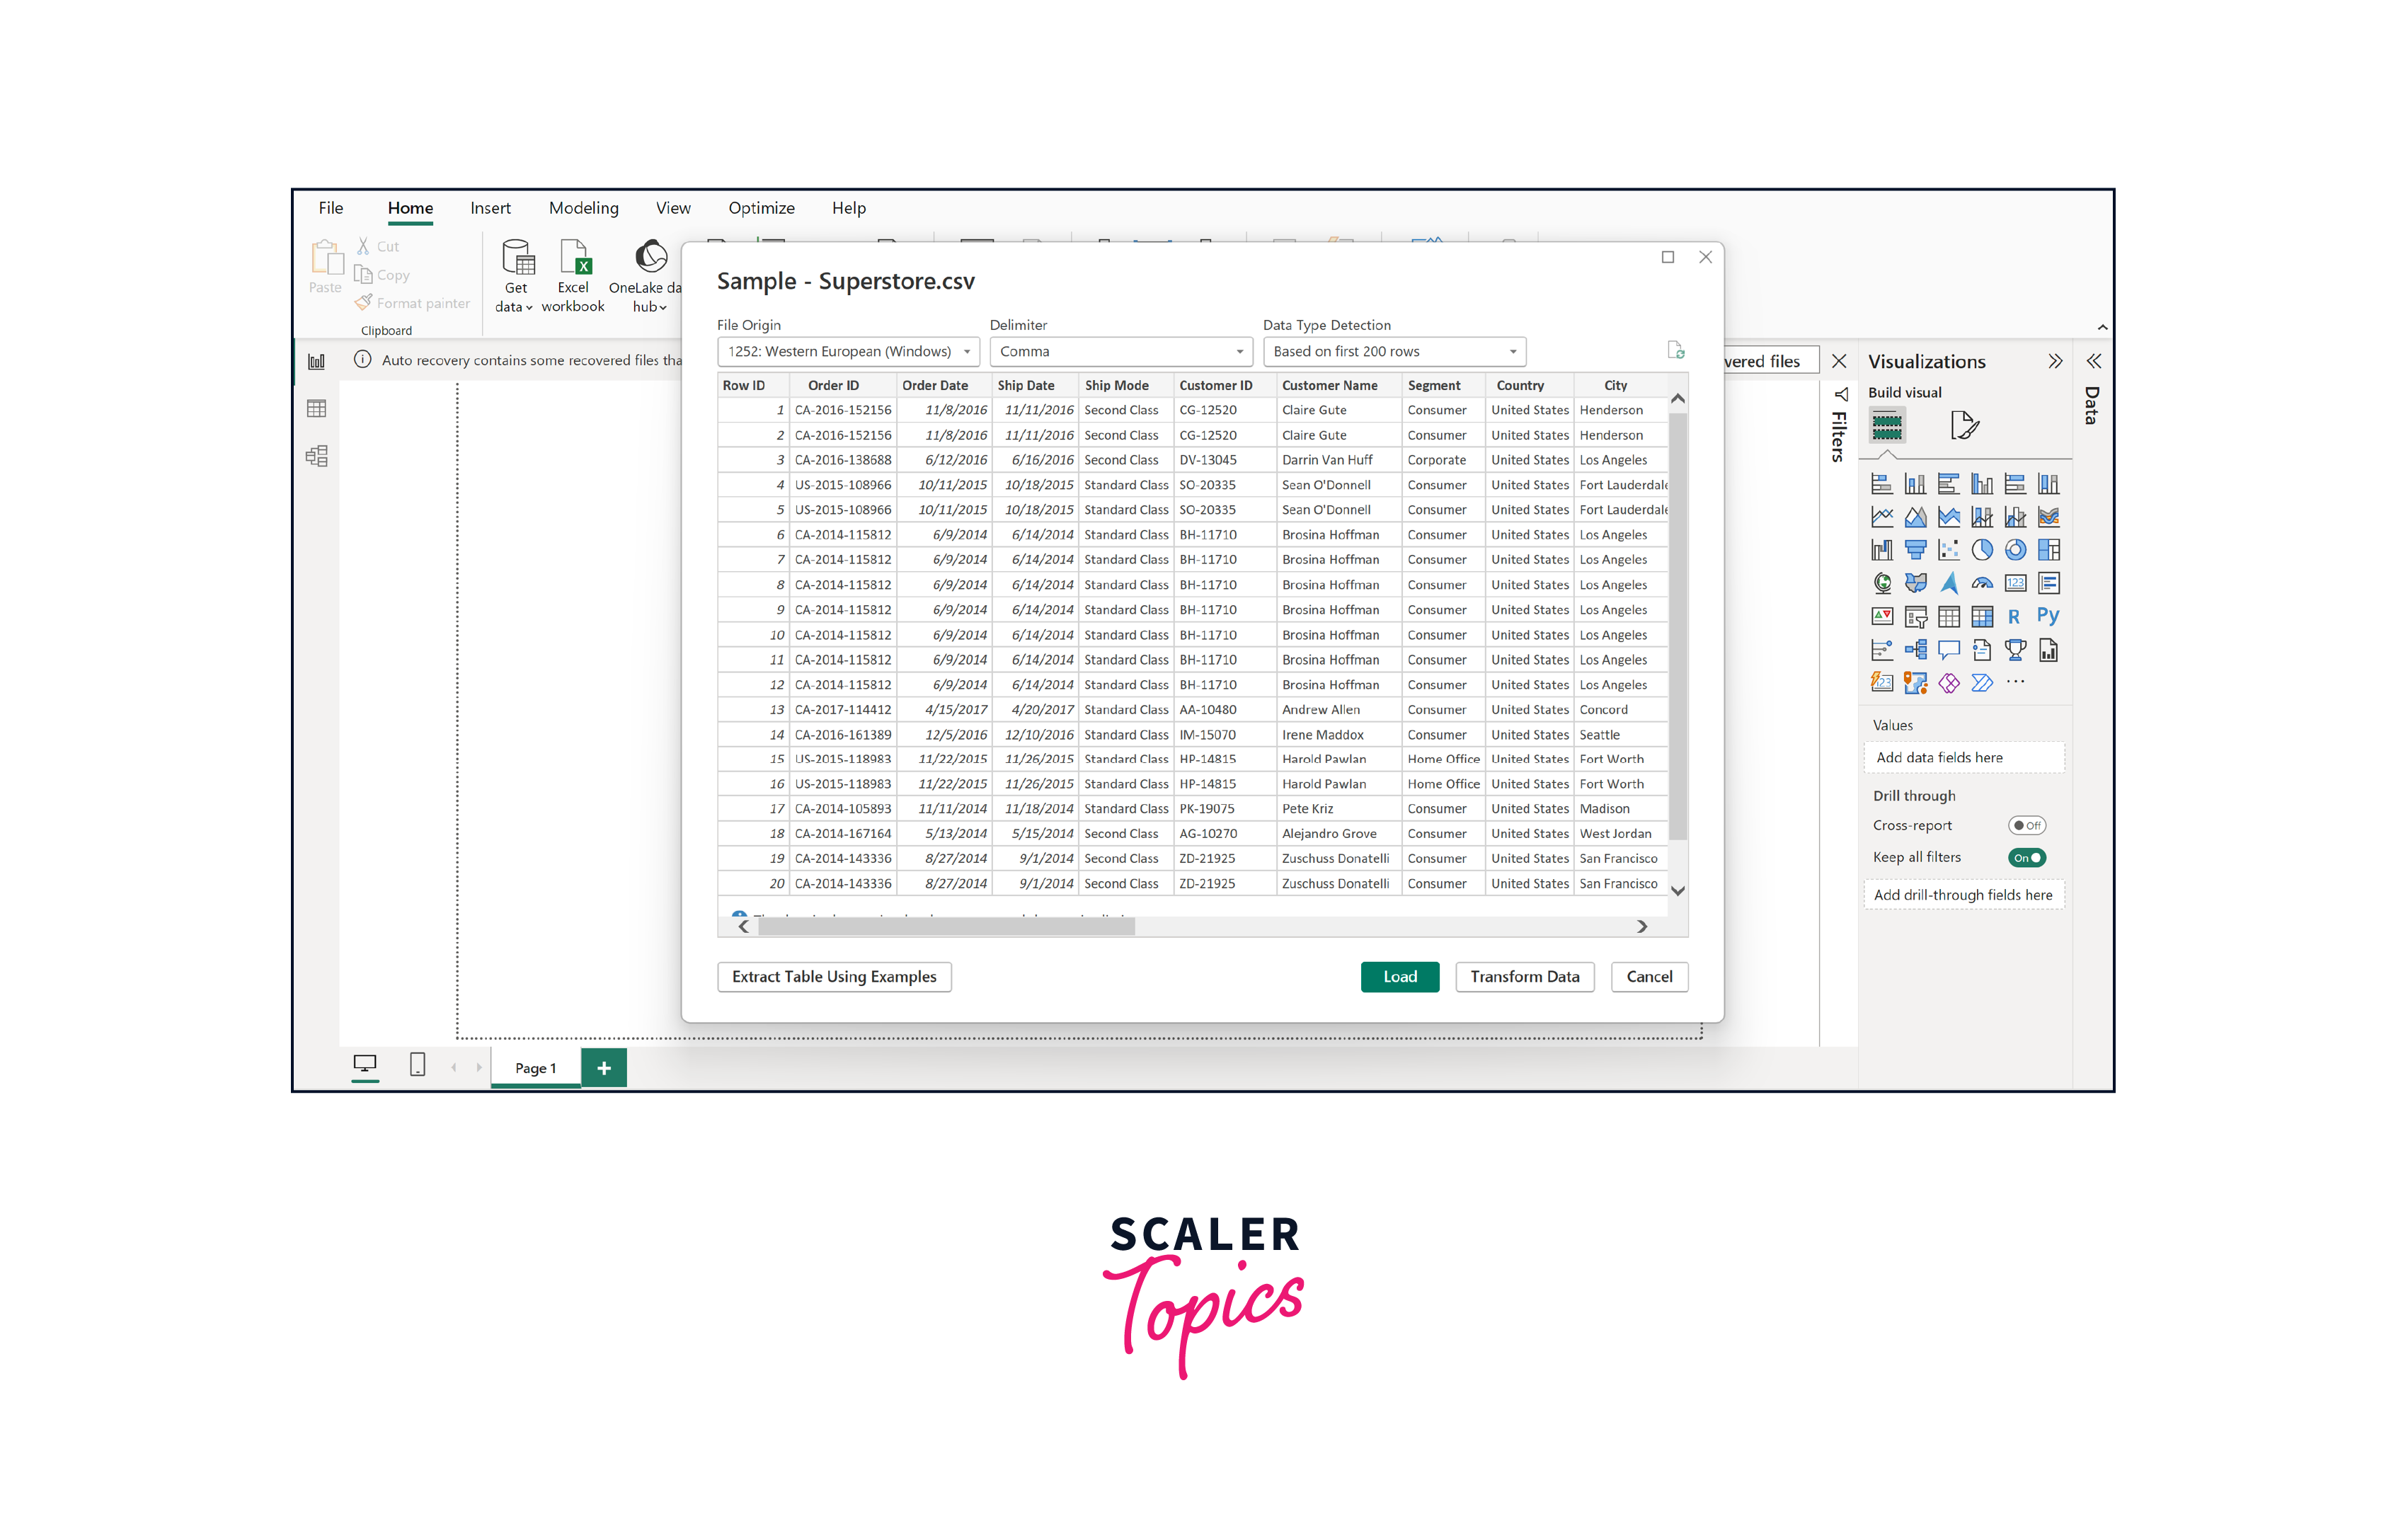
The next step in performing EDA on the Superstore dataset using Power BI is to connect to your data source. For this project, we will utilize a superstore dataset which can be downloaded from here. This dataset contains information about an online store that sells furniture, office supplies, and tech items. The data includes details like order numbers, dates of orders and shipping, customer information, product details, total sales, and the profit made.
To connect to a data store using Power BI -
- Open Power BI Desktop.
- Click "Home" > "Get Data" > select your data source (e.g., CSV, database).
- Browse and select your dataset, then follow the prompts to configure the connection and load data into Power BI.
Scaler Placement Report and Statistics
Scaler learners achieved 2.5x salary growth with average post-Scaler CTC reaching ₹23L.
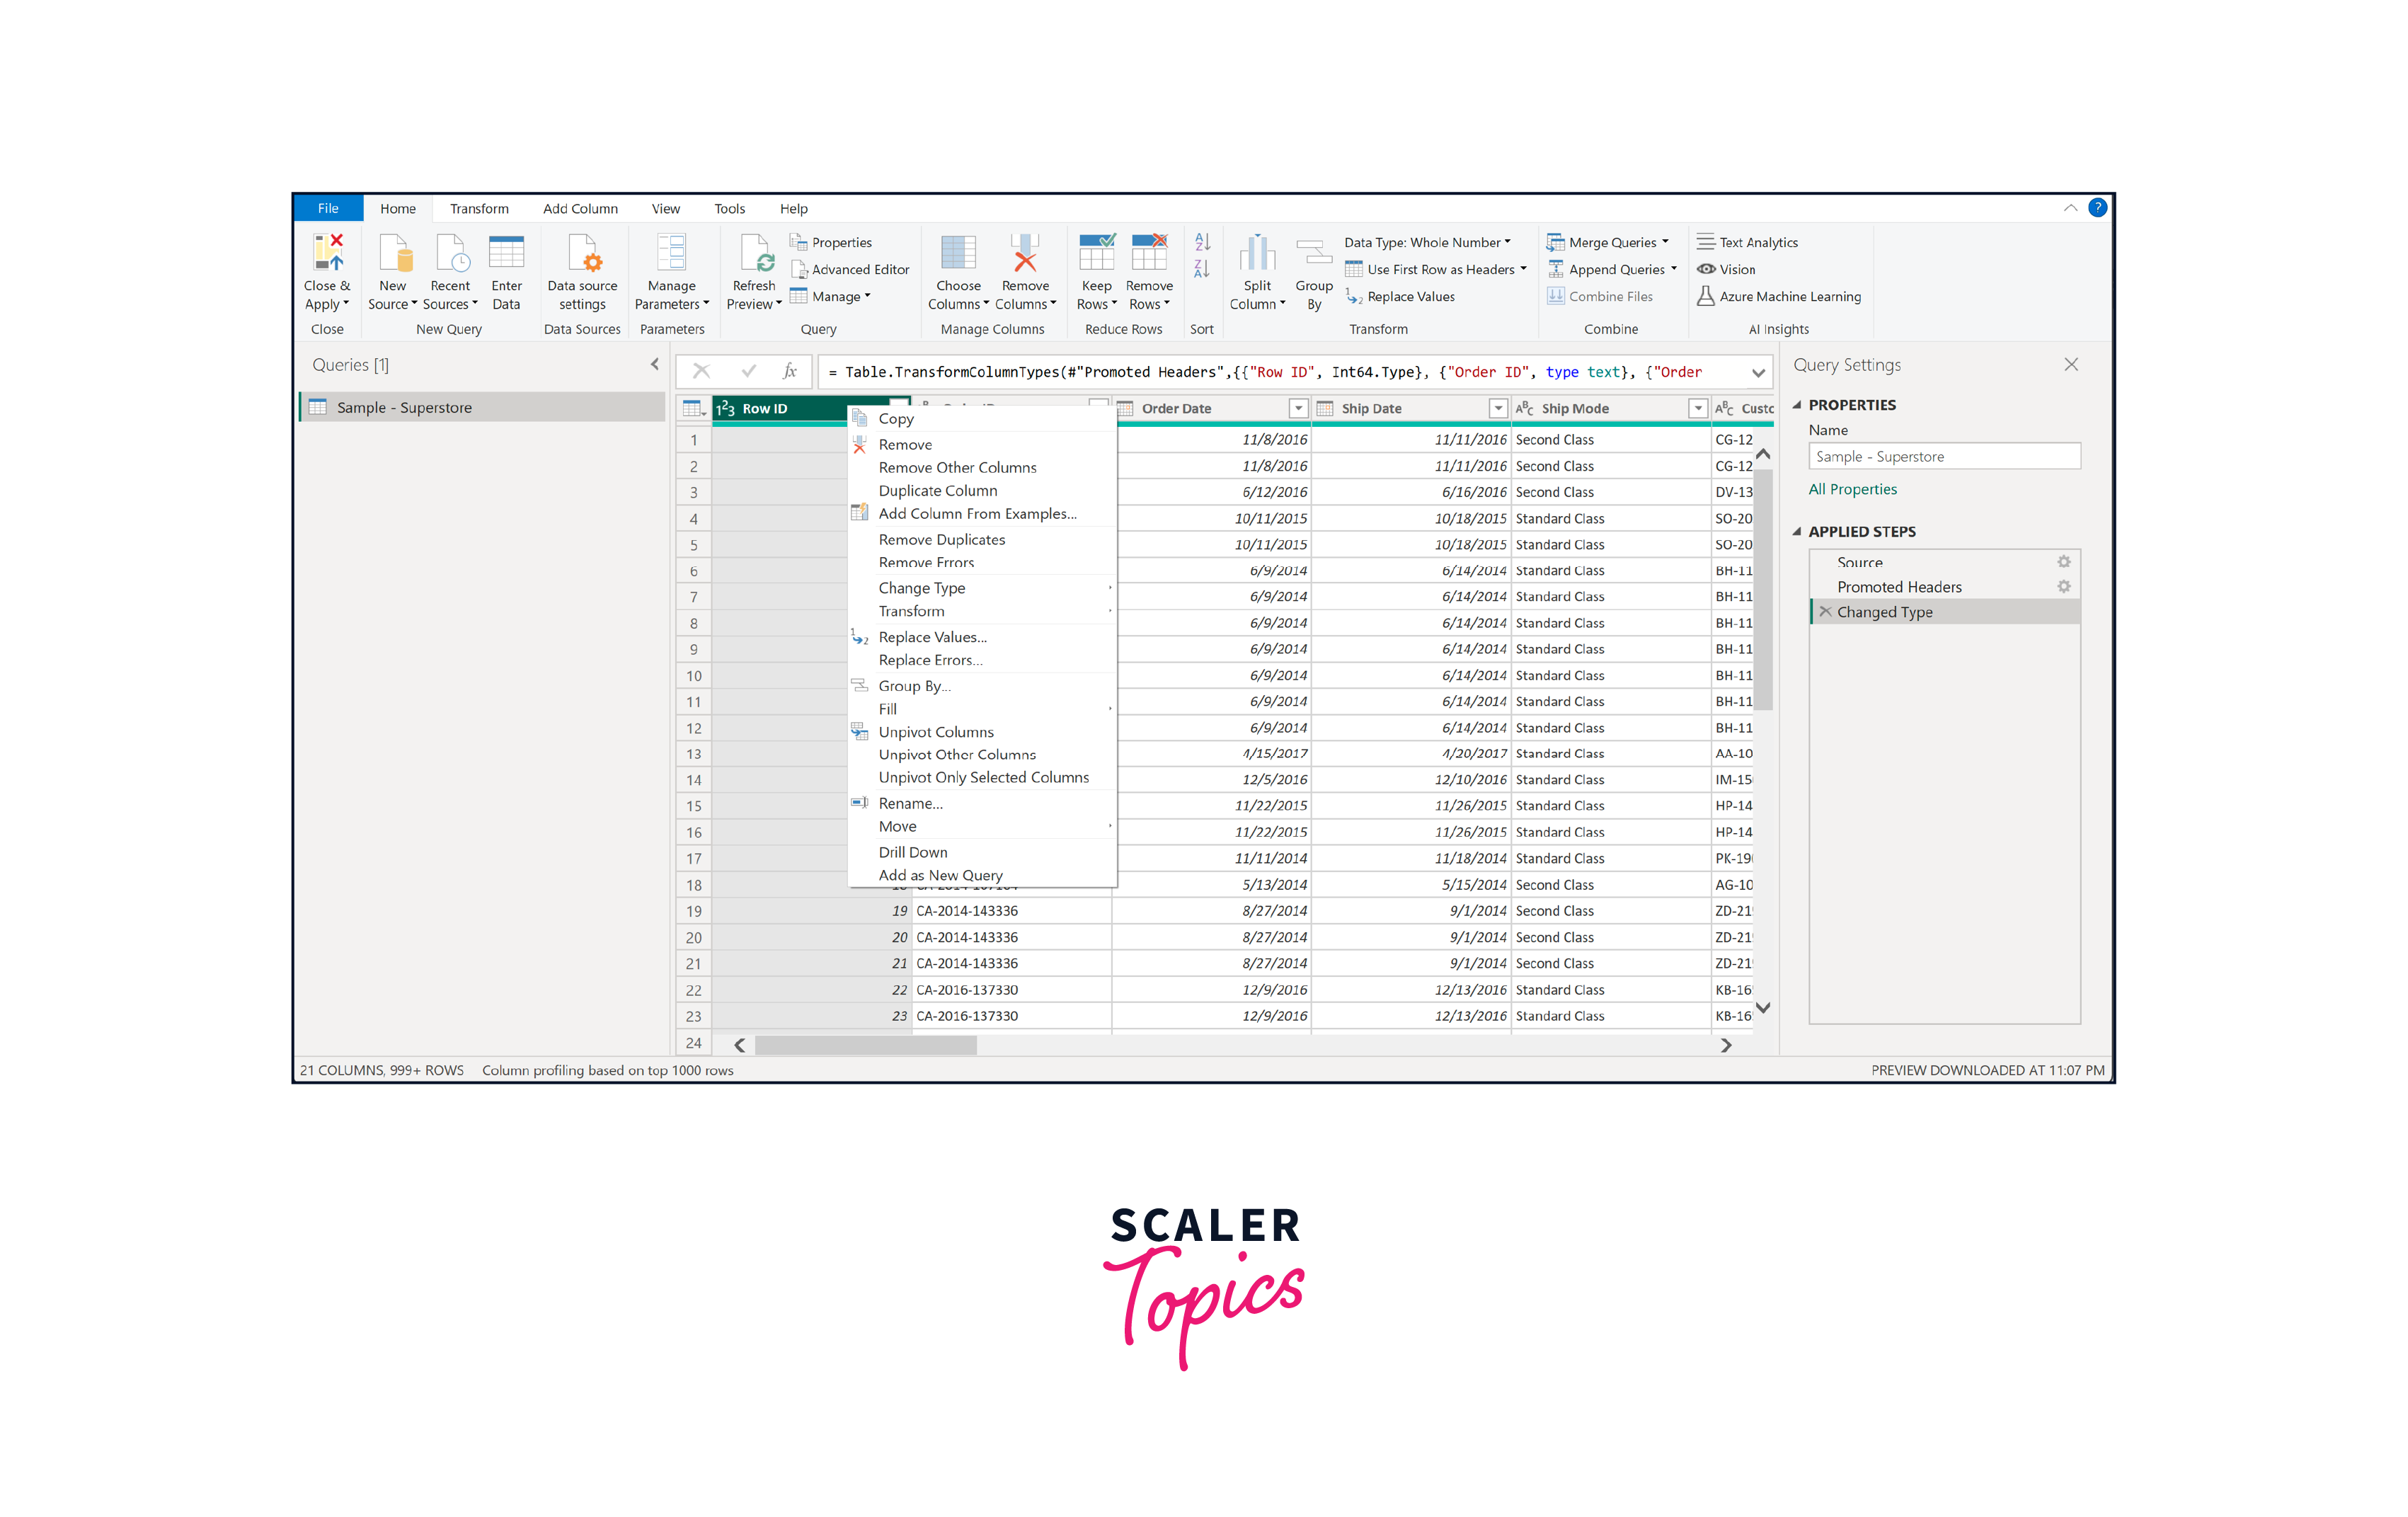
Step 3: Performing Data Transformation
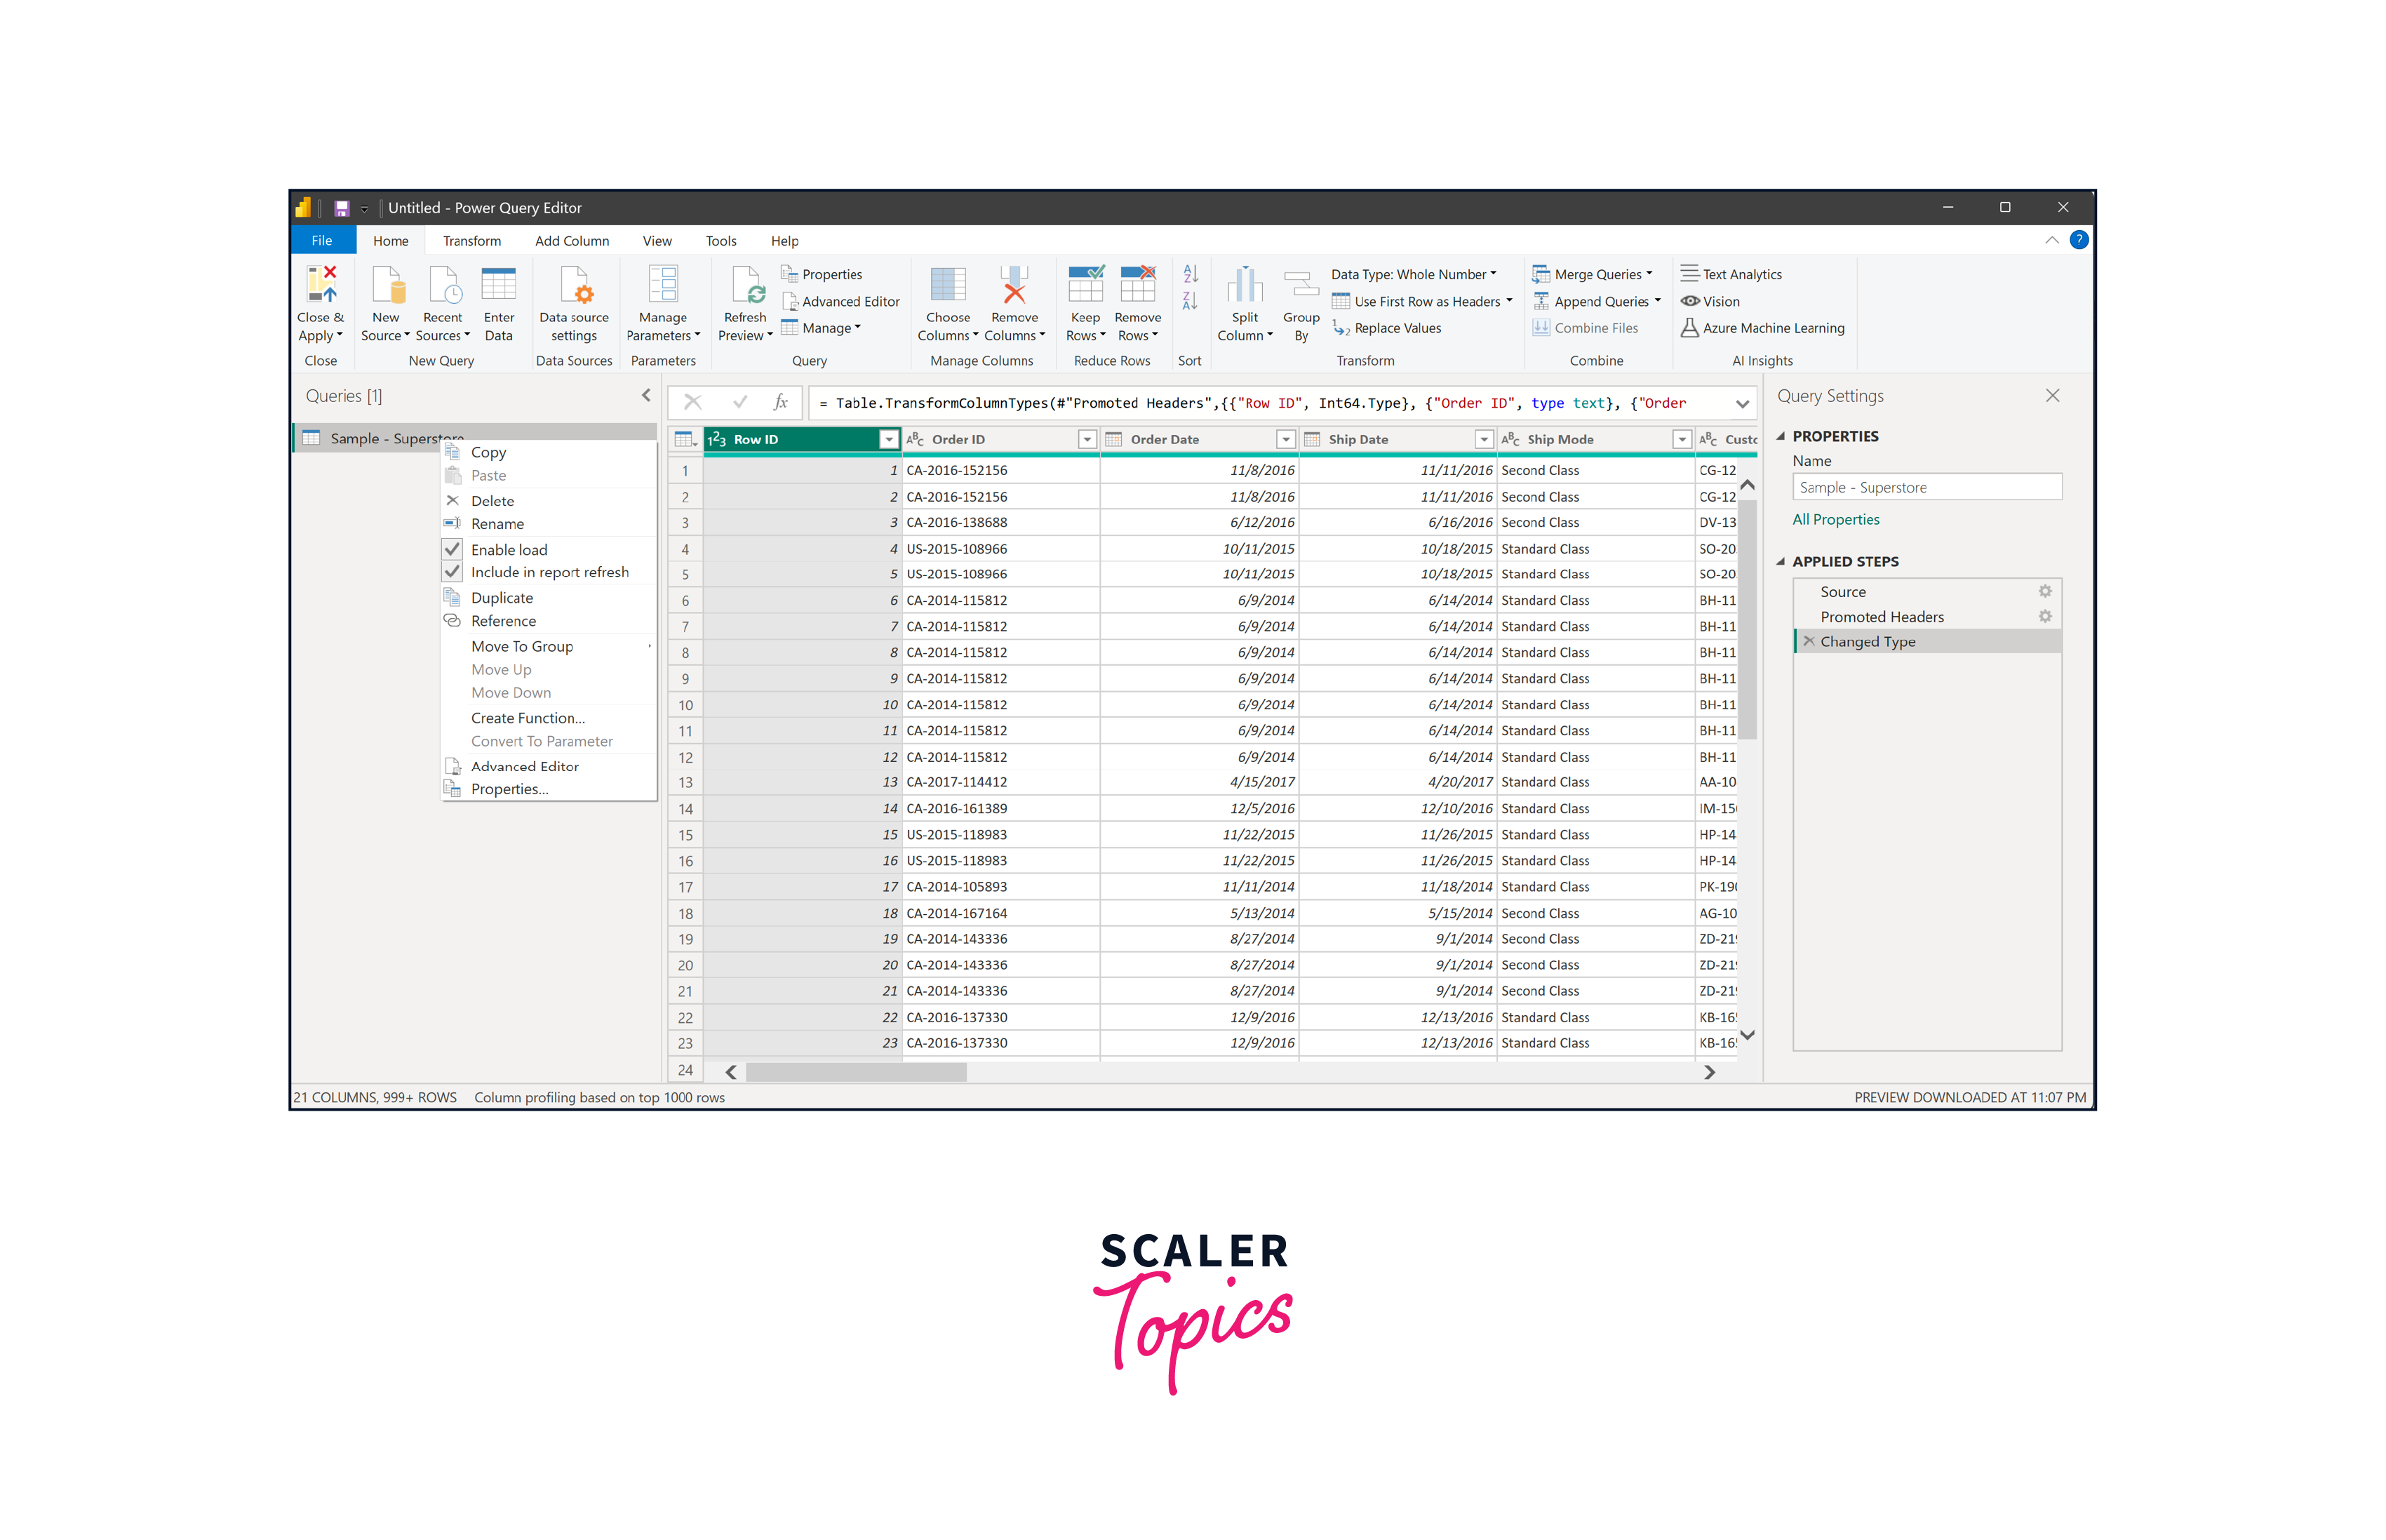
We will click on the "Transform Data" option in the previous image to initiate several data transformation actions on the dataset. Now, let's proceed with the different stages of transforming the loaded Superstore dataset. These steps encompass activities like cleaning the data, verifying column data types, and eliminating records with missing values (NULLs).
-
To rename the sheet, we will go ahead and perform a right-click on Sheet1. After that, rename it to "Orders", as shown in the figure below.
-
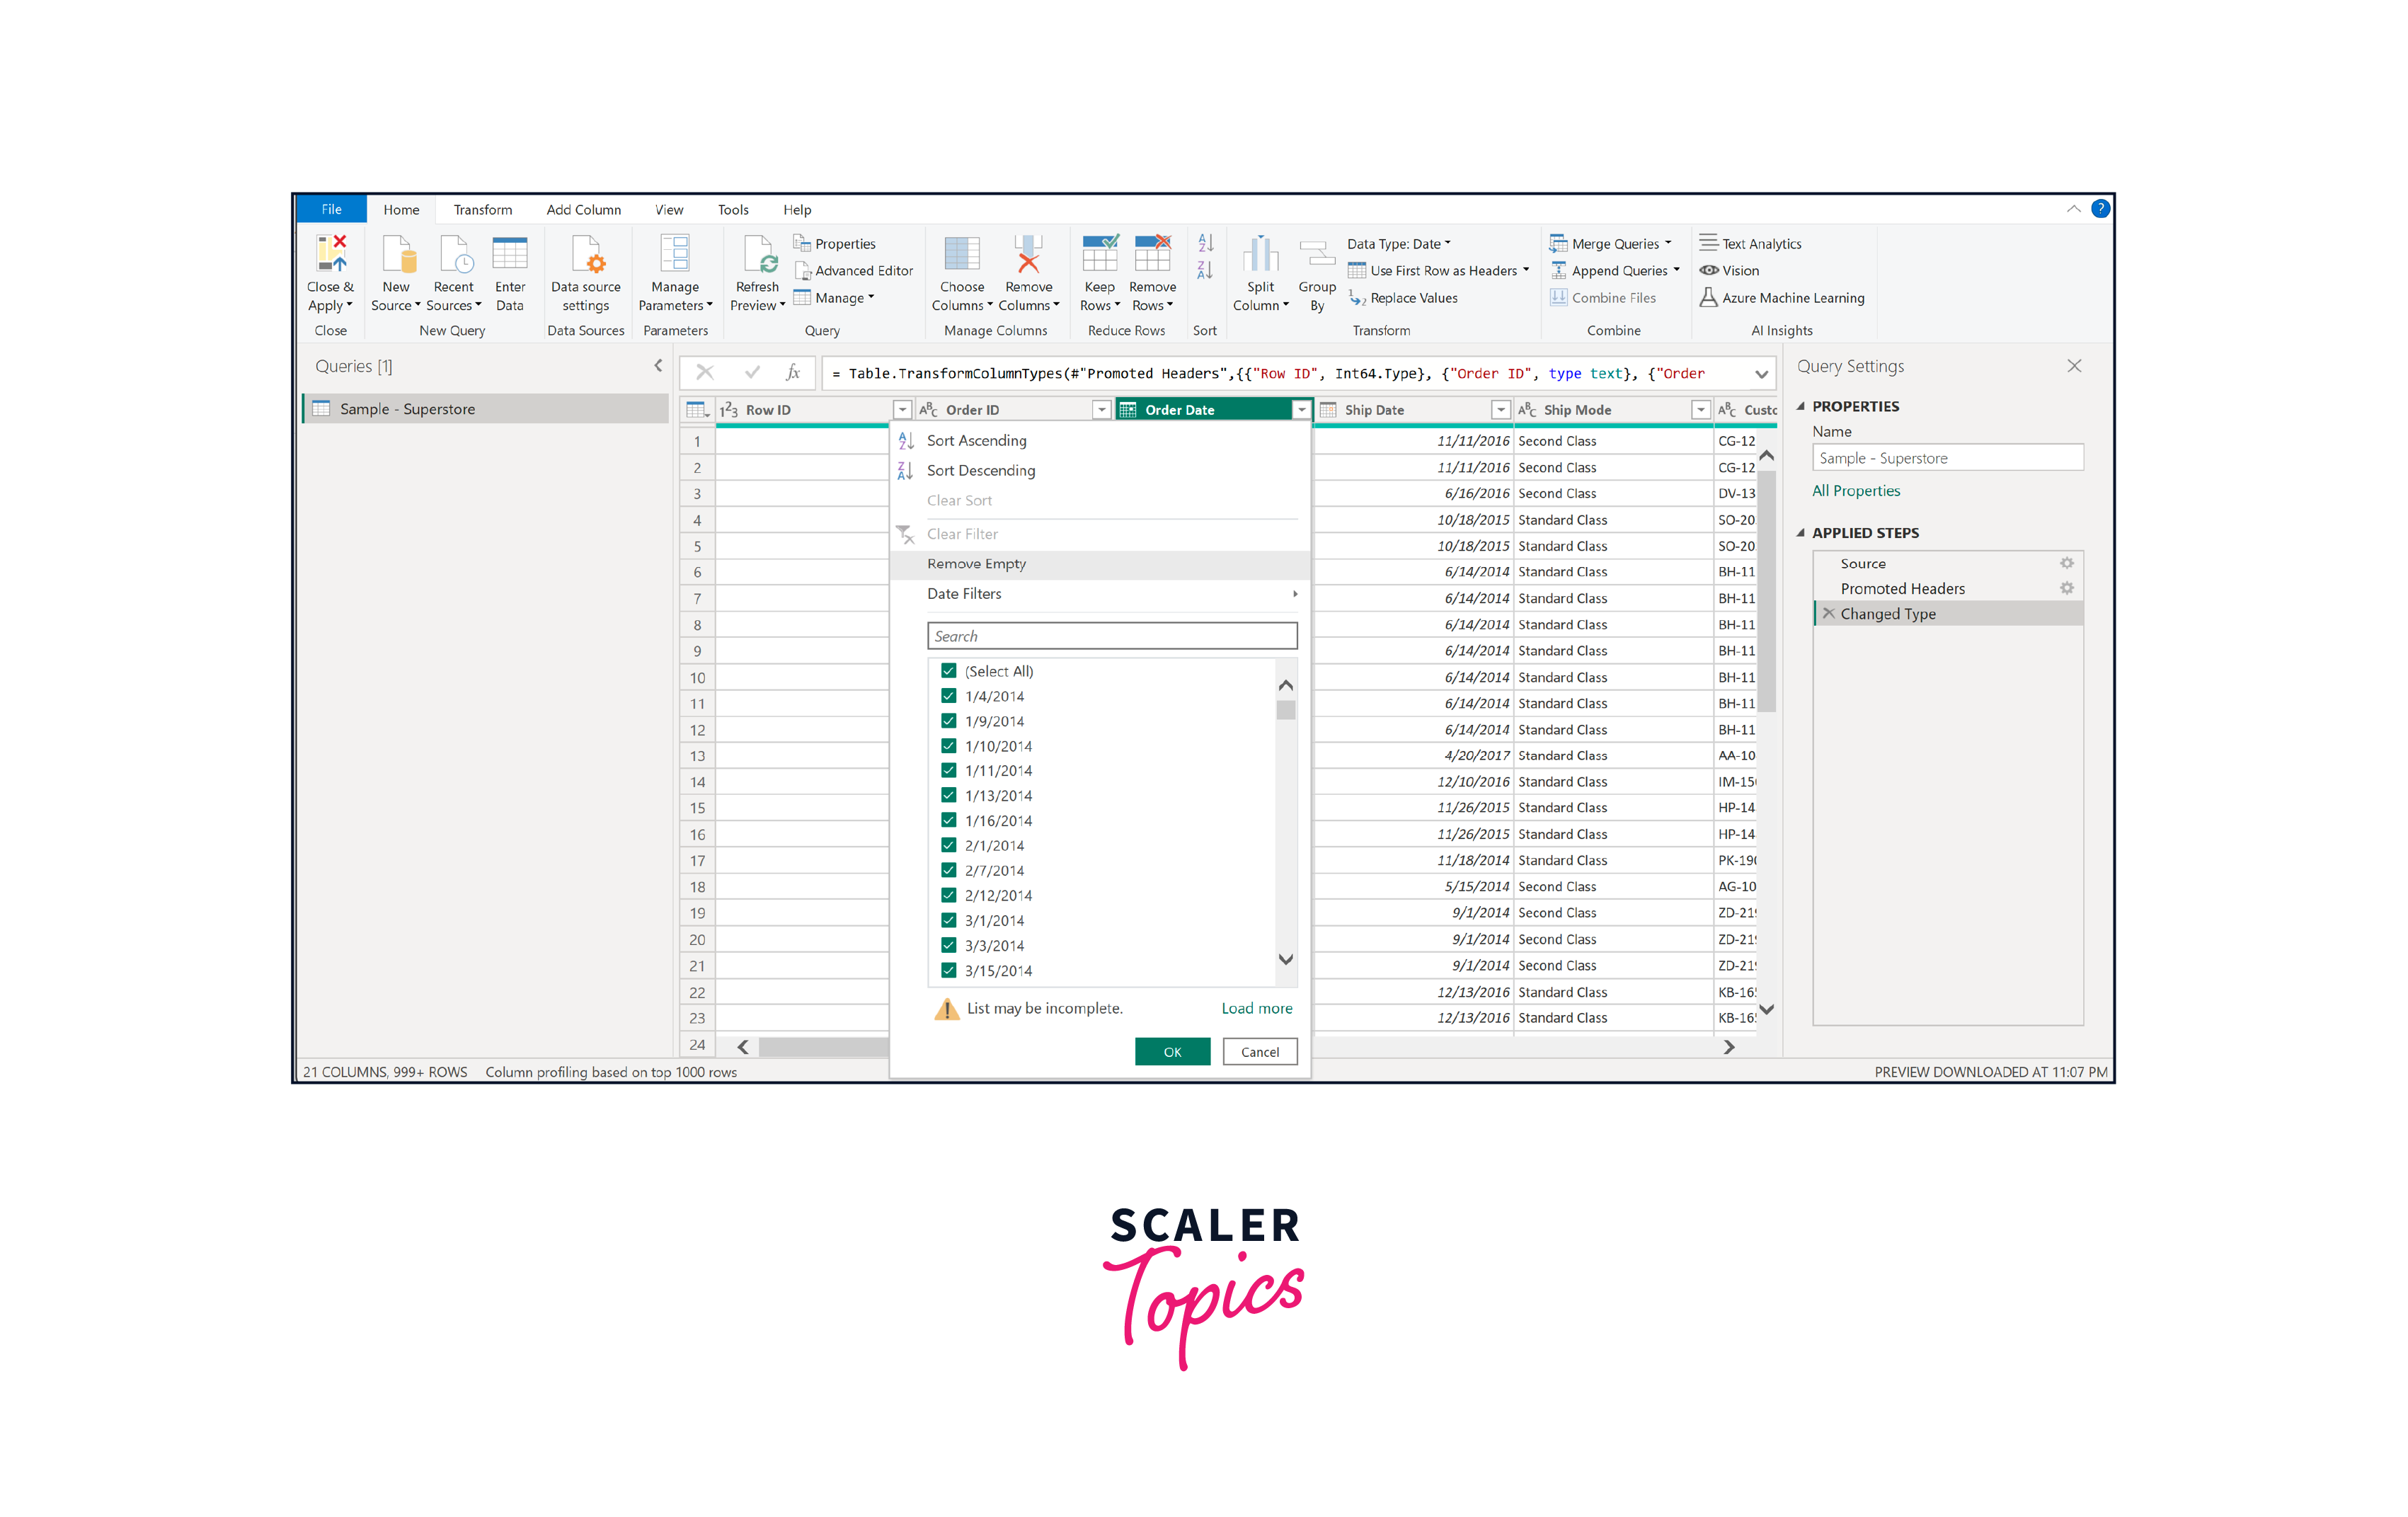
To eliminate records with missing values, we will make use of the Order ID column within the dataset. Simply click on the drop-down of the Order ID column and select the "Remove Empty" option, as shown in the figure below.
-
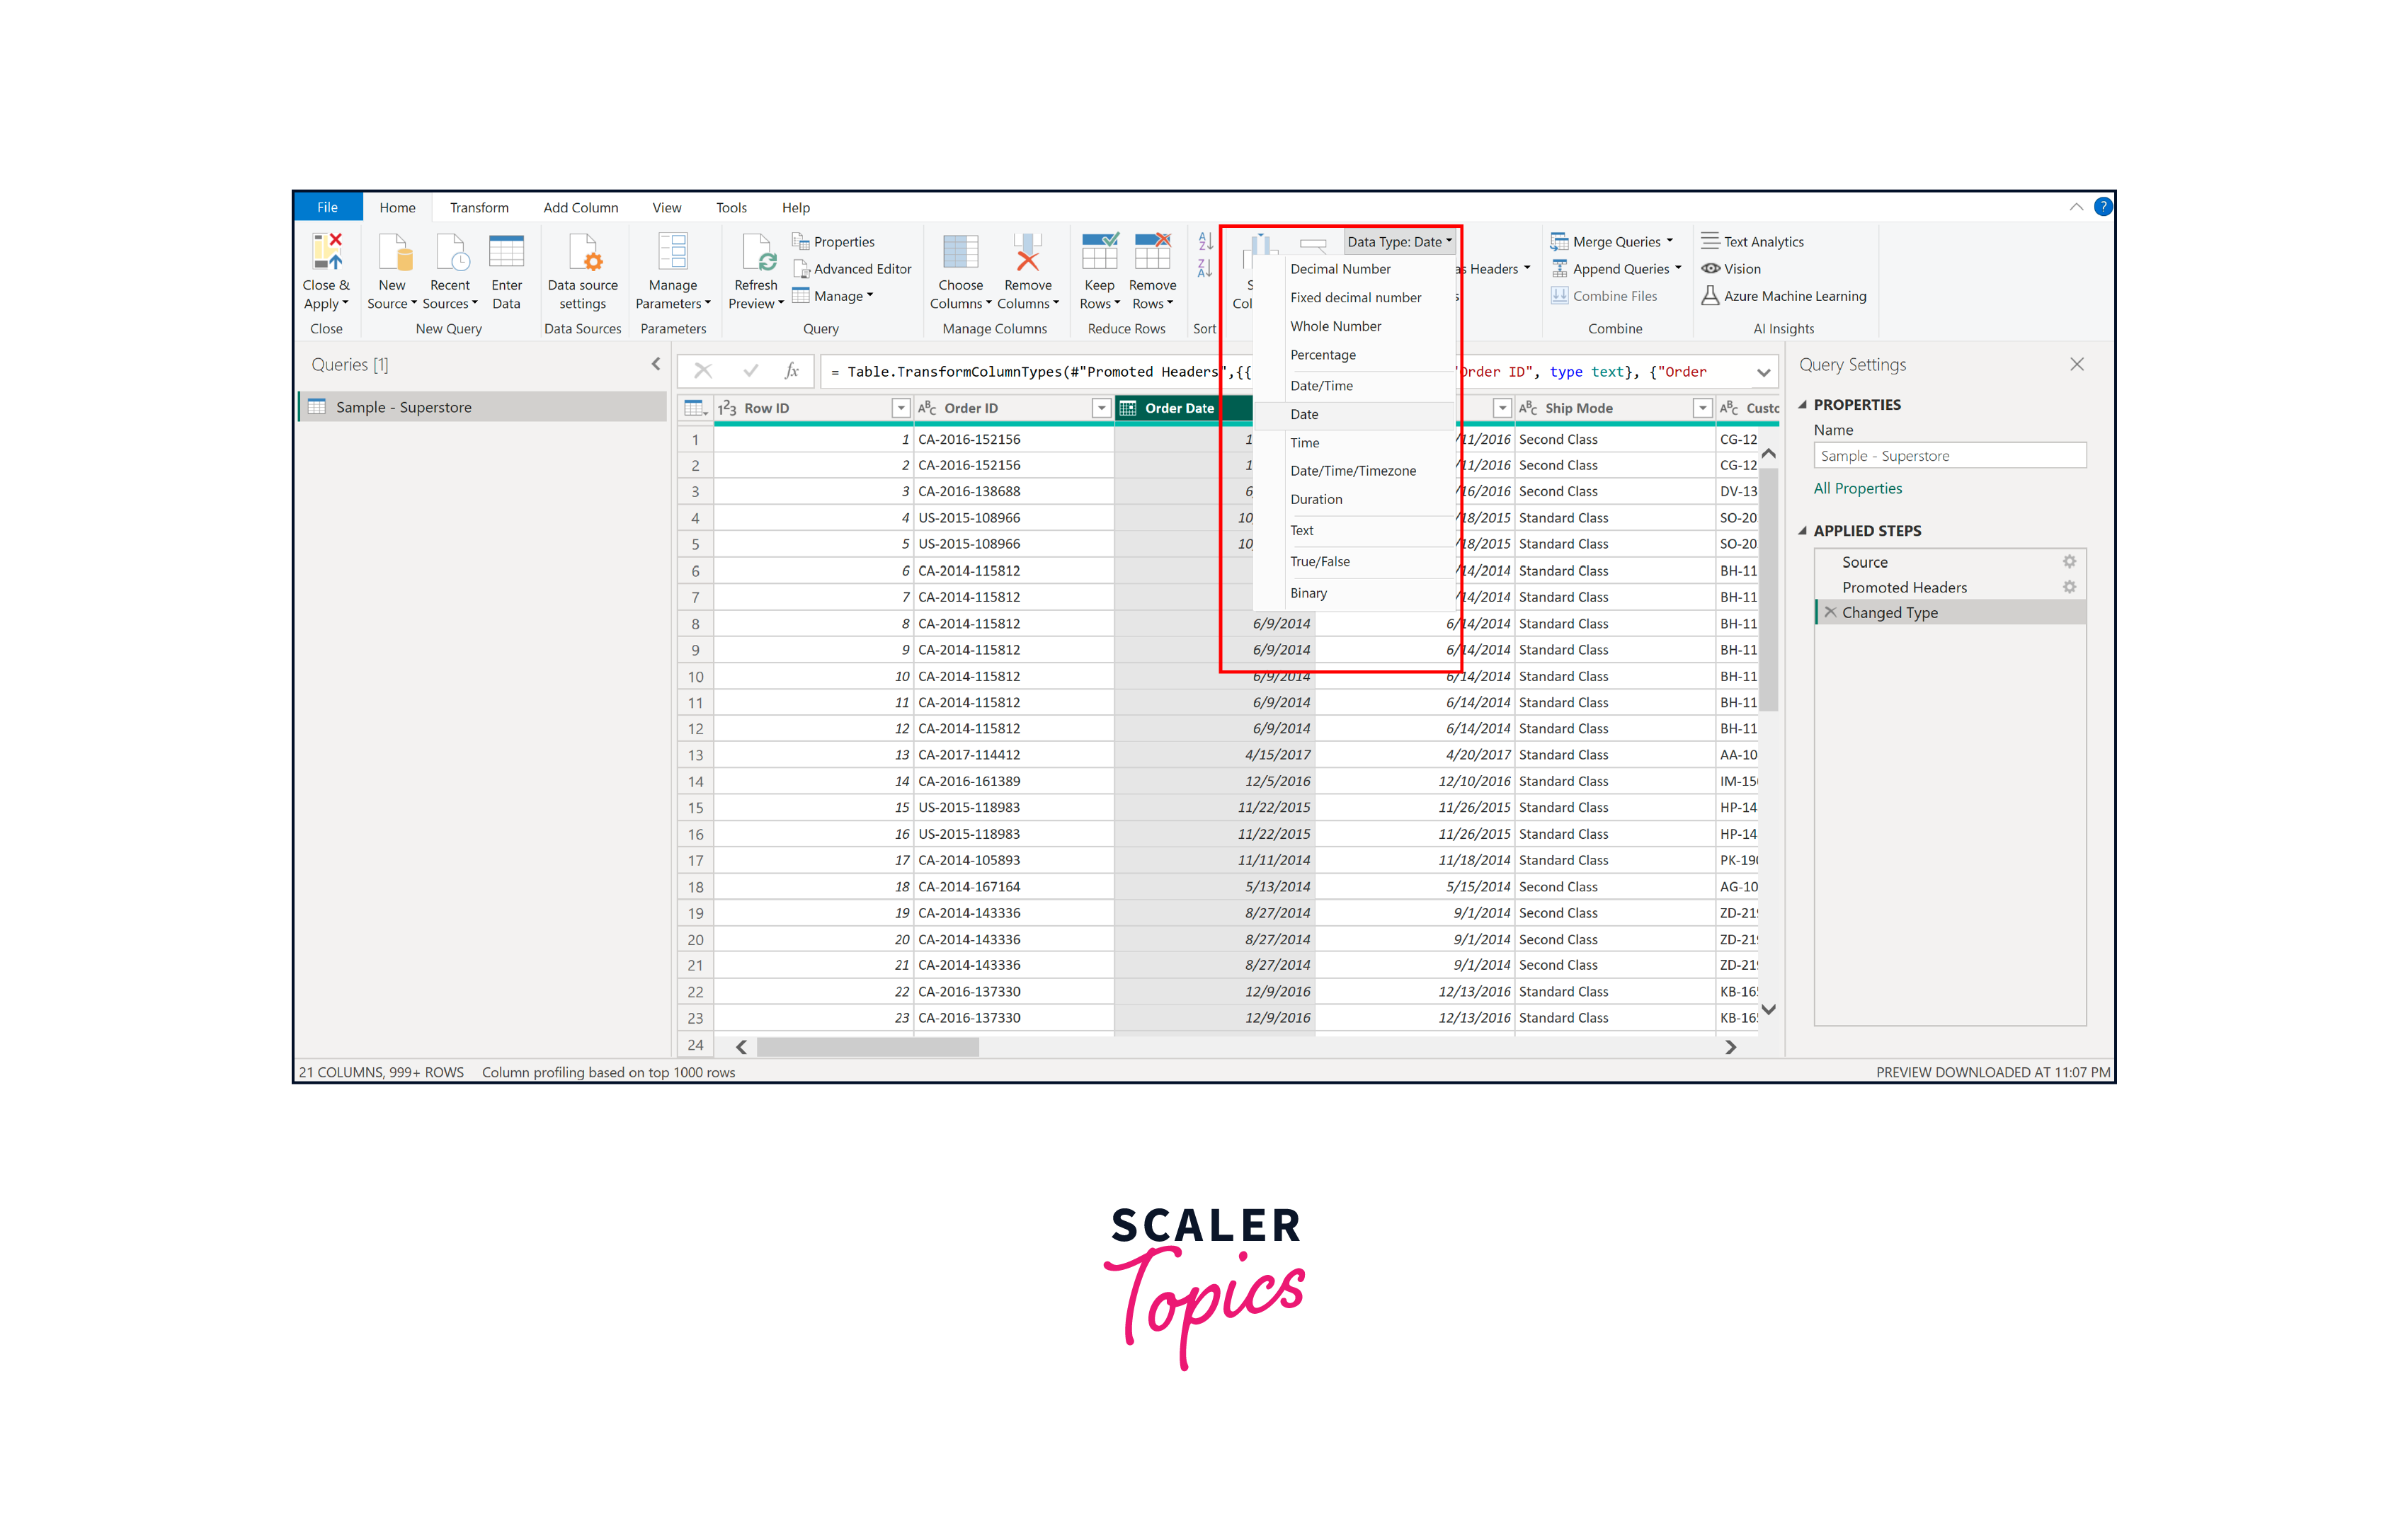
Next, proceed to click on each individual column and verify whether the correct Data Type has been assigned or not. In cases where the Data Type is not accurately assigned, make the necessary adjustments by selecting the appropriate Data Type from the dropdown menu. For instance, ensure that columns like Order Date and Ship Date are set to the "Date" Data Type.
-
Examine the columns and determine which ones are unnecessary for inclusion in the report or the data model. Specifically, in the imported dataset, the Row ID column serves no purpose. Therefore, we should remove it. To do so, simply right-click on the Row ID column and select the "Remove" option.
-
Once you have successfully carried out all the required data transformations, go ahead and click on the "Close & Apply" button. This will ensure that your applied transformations are saved and the dataset is prepared for analysis.
Building the Superstore Sales & Profit Report
-
Sales Report
- Step 1.
Once you've selected "Close & Apply," the report view will be accessible. To rename the report page within Power BI Desktop, click on the "Rename" option, as shown in the figure below.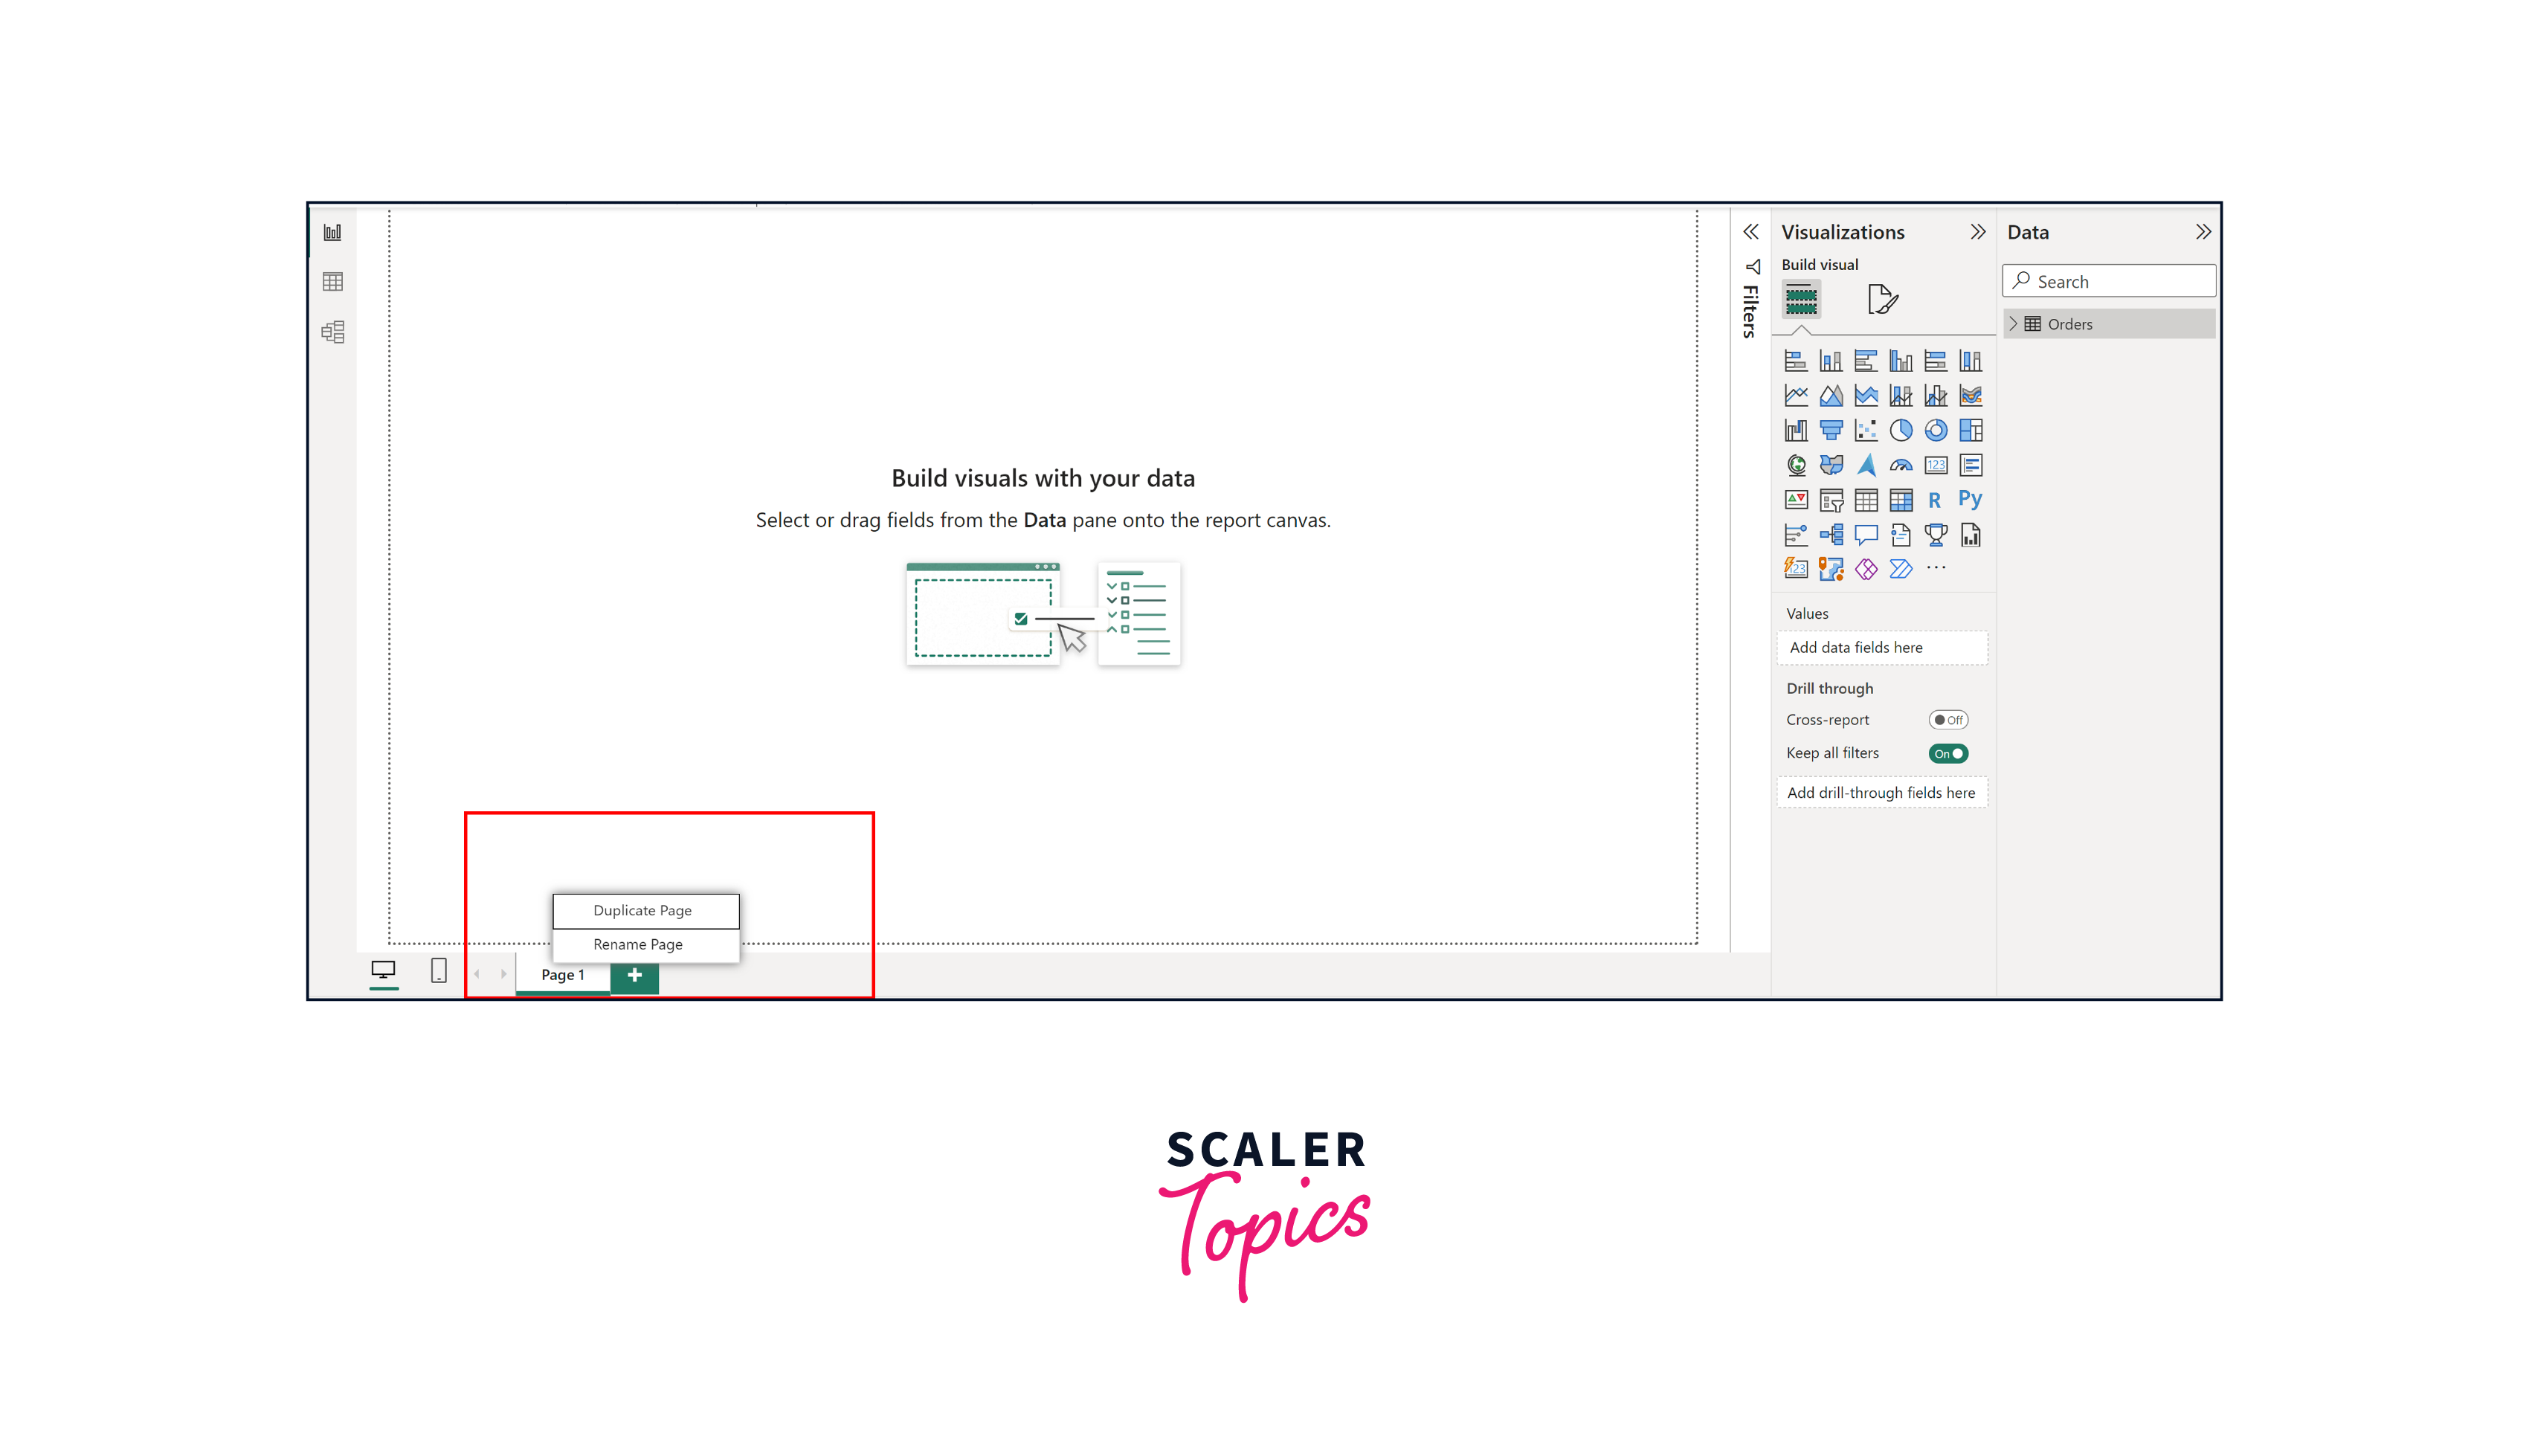
- Step 2.
In the Home tab, opt for the Text box feature. Insert the desired text within the text box – for this instance, we'll use "Sales Dashboard." You also have the flexibility to personalize the font, color, background, and alignment according to your preferences.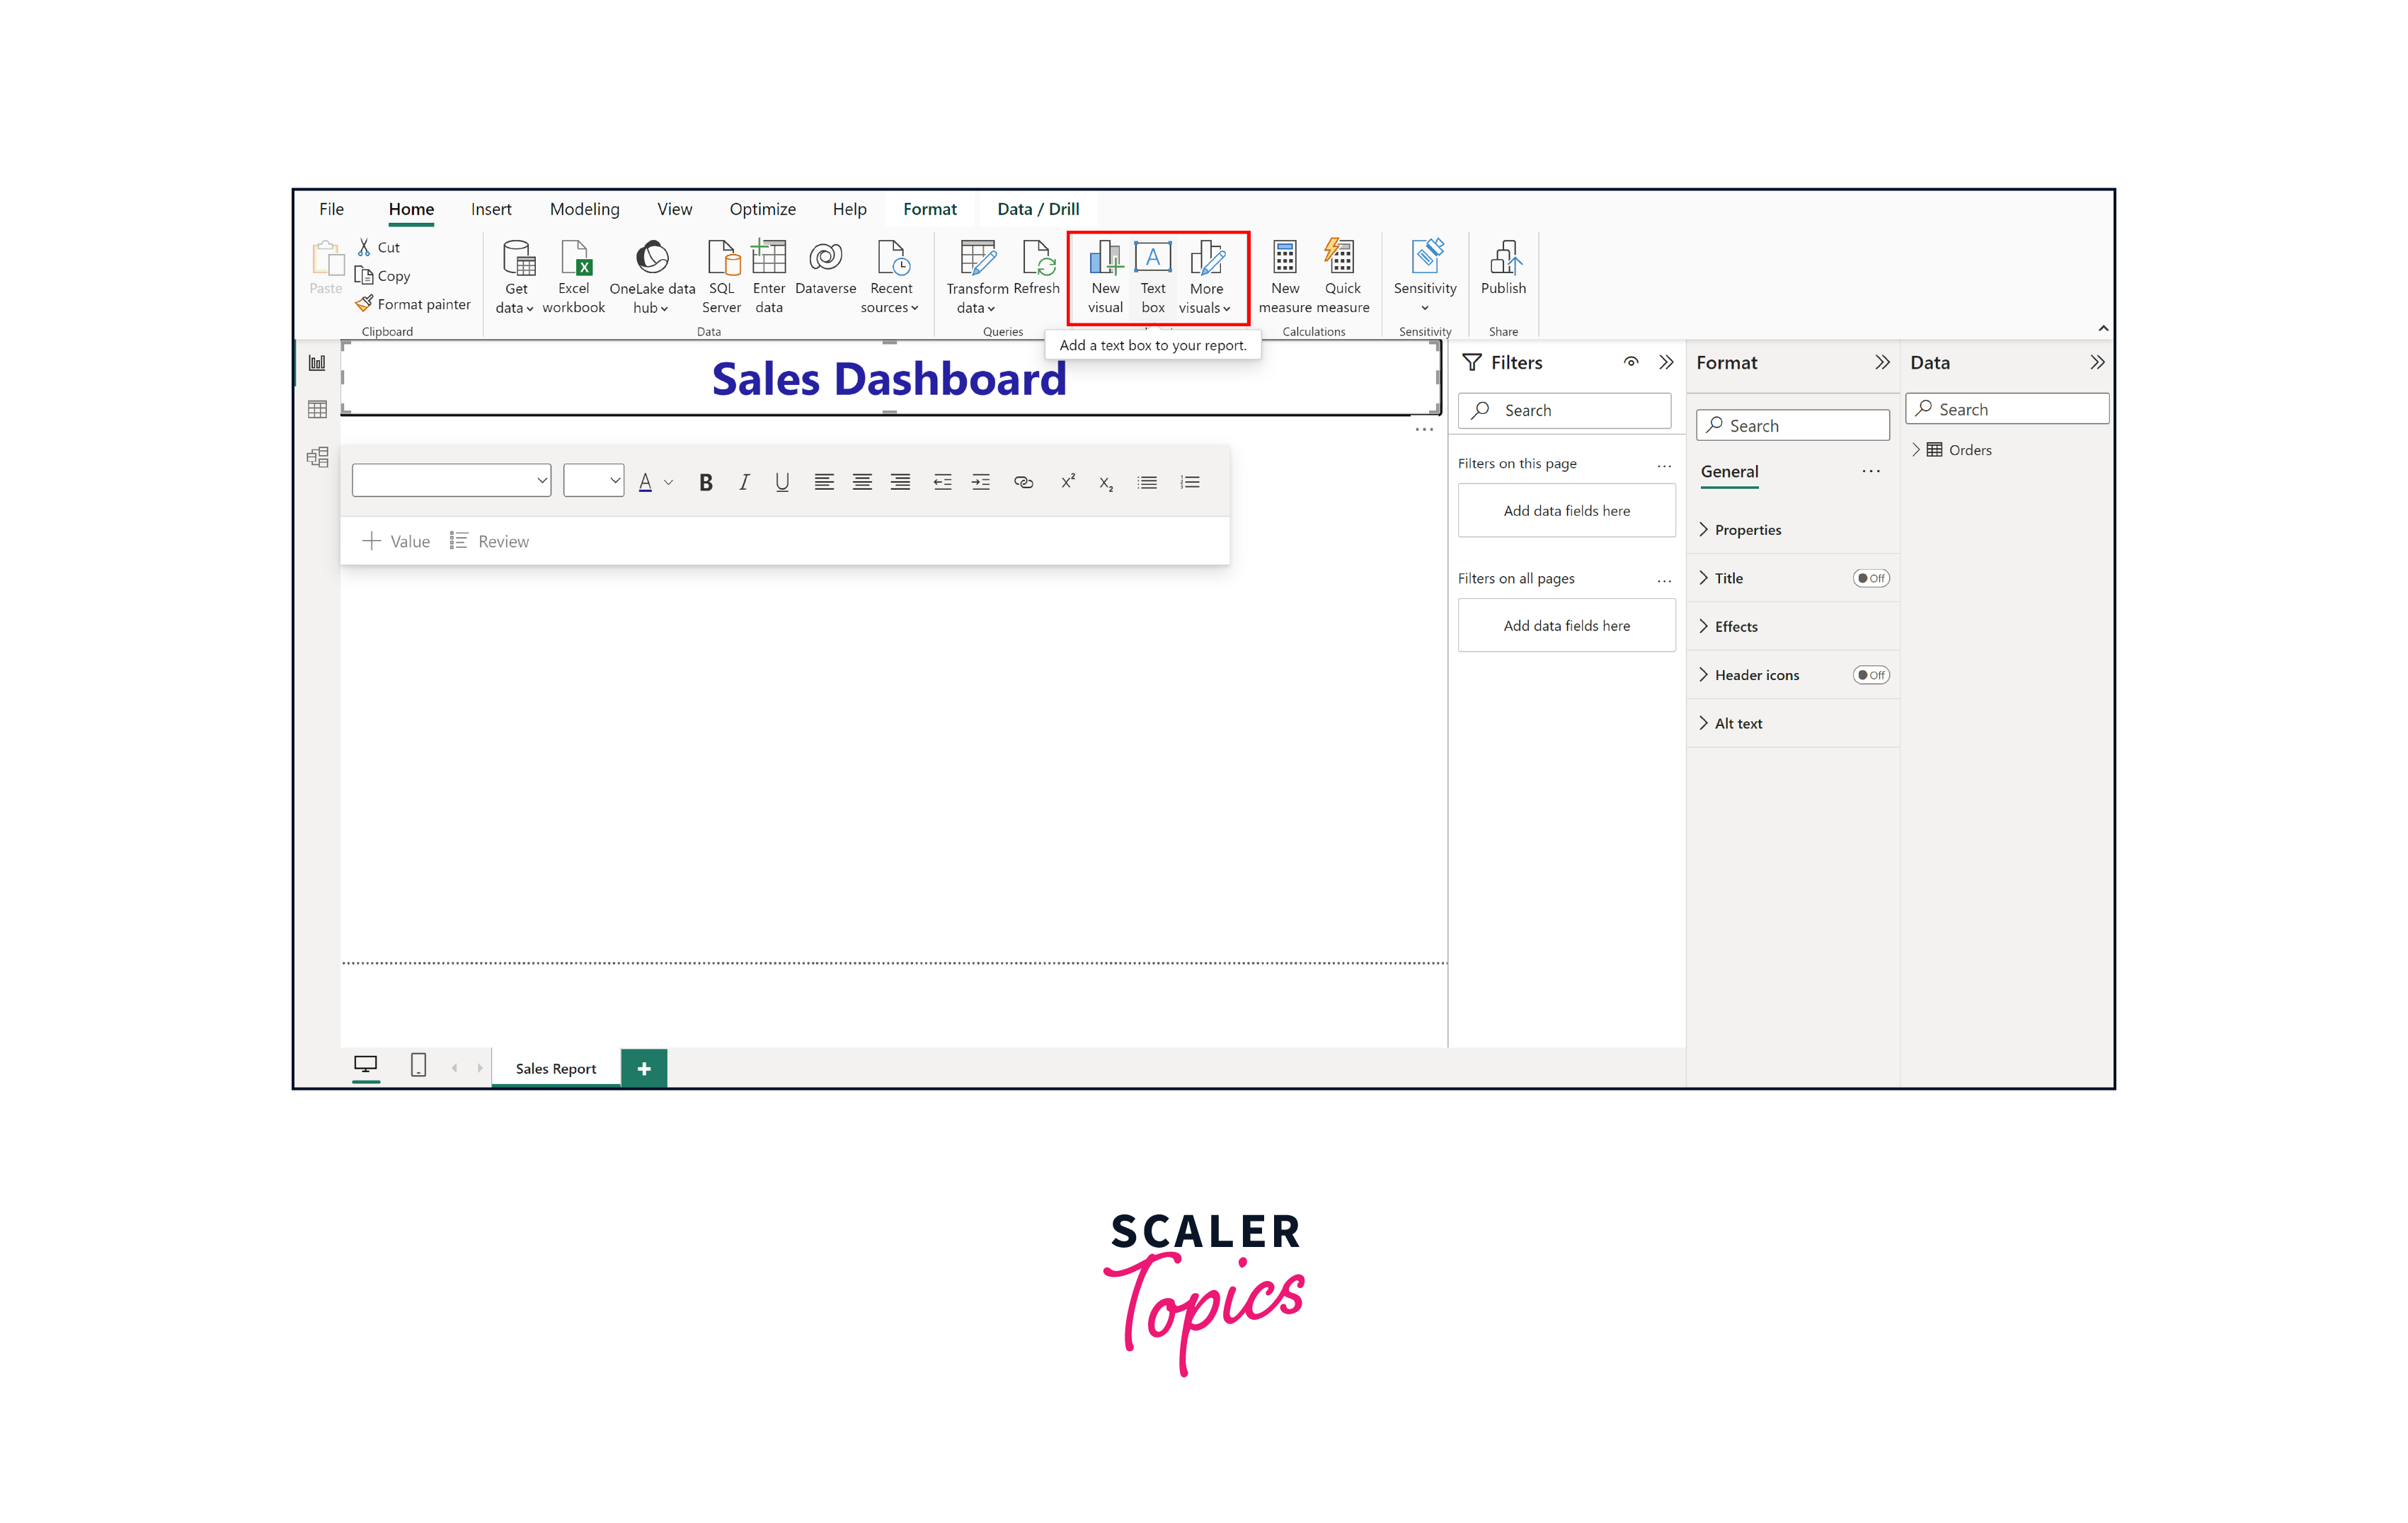
- Step 3.
Now, opt for two card visuals within the Build Visual section. For the first card visual, place the Sales column in the Fields section using the "Sum" aggregation and label the card title as "Total Sales" in the format visual section. In the second card visual, include the Customer Name column in the Fields section with a "Count(Distinct)" aggregation and label the card title as "Total Customers", as shown in the figure below.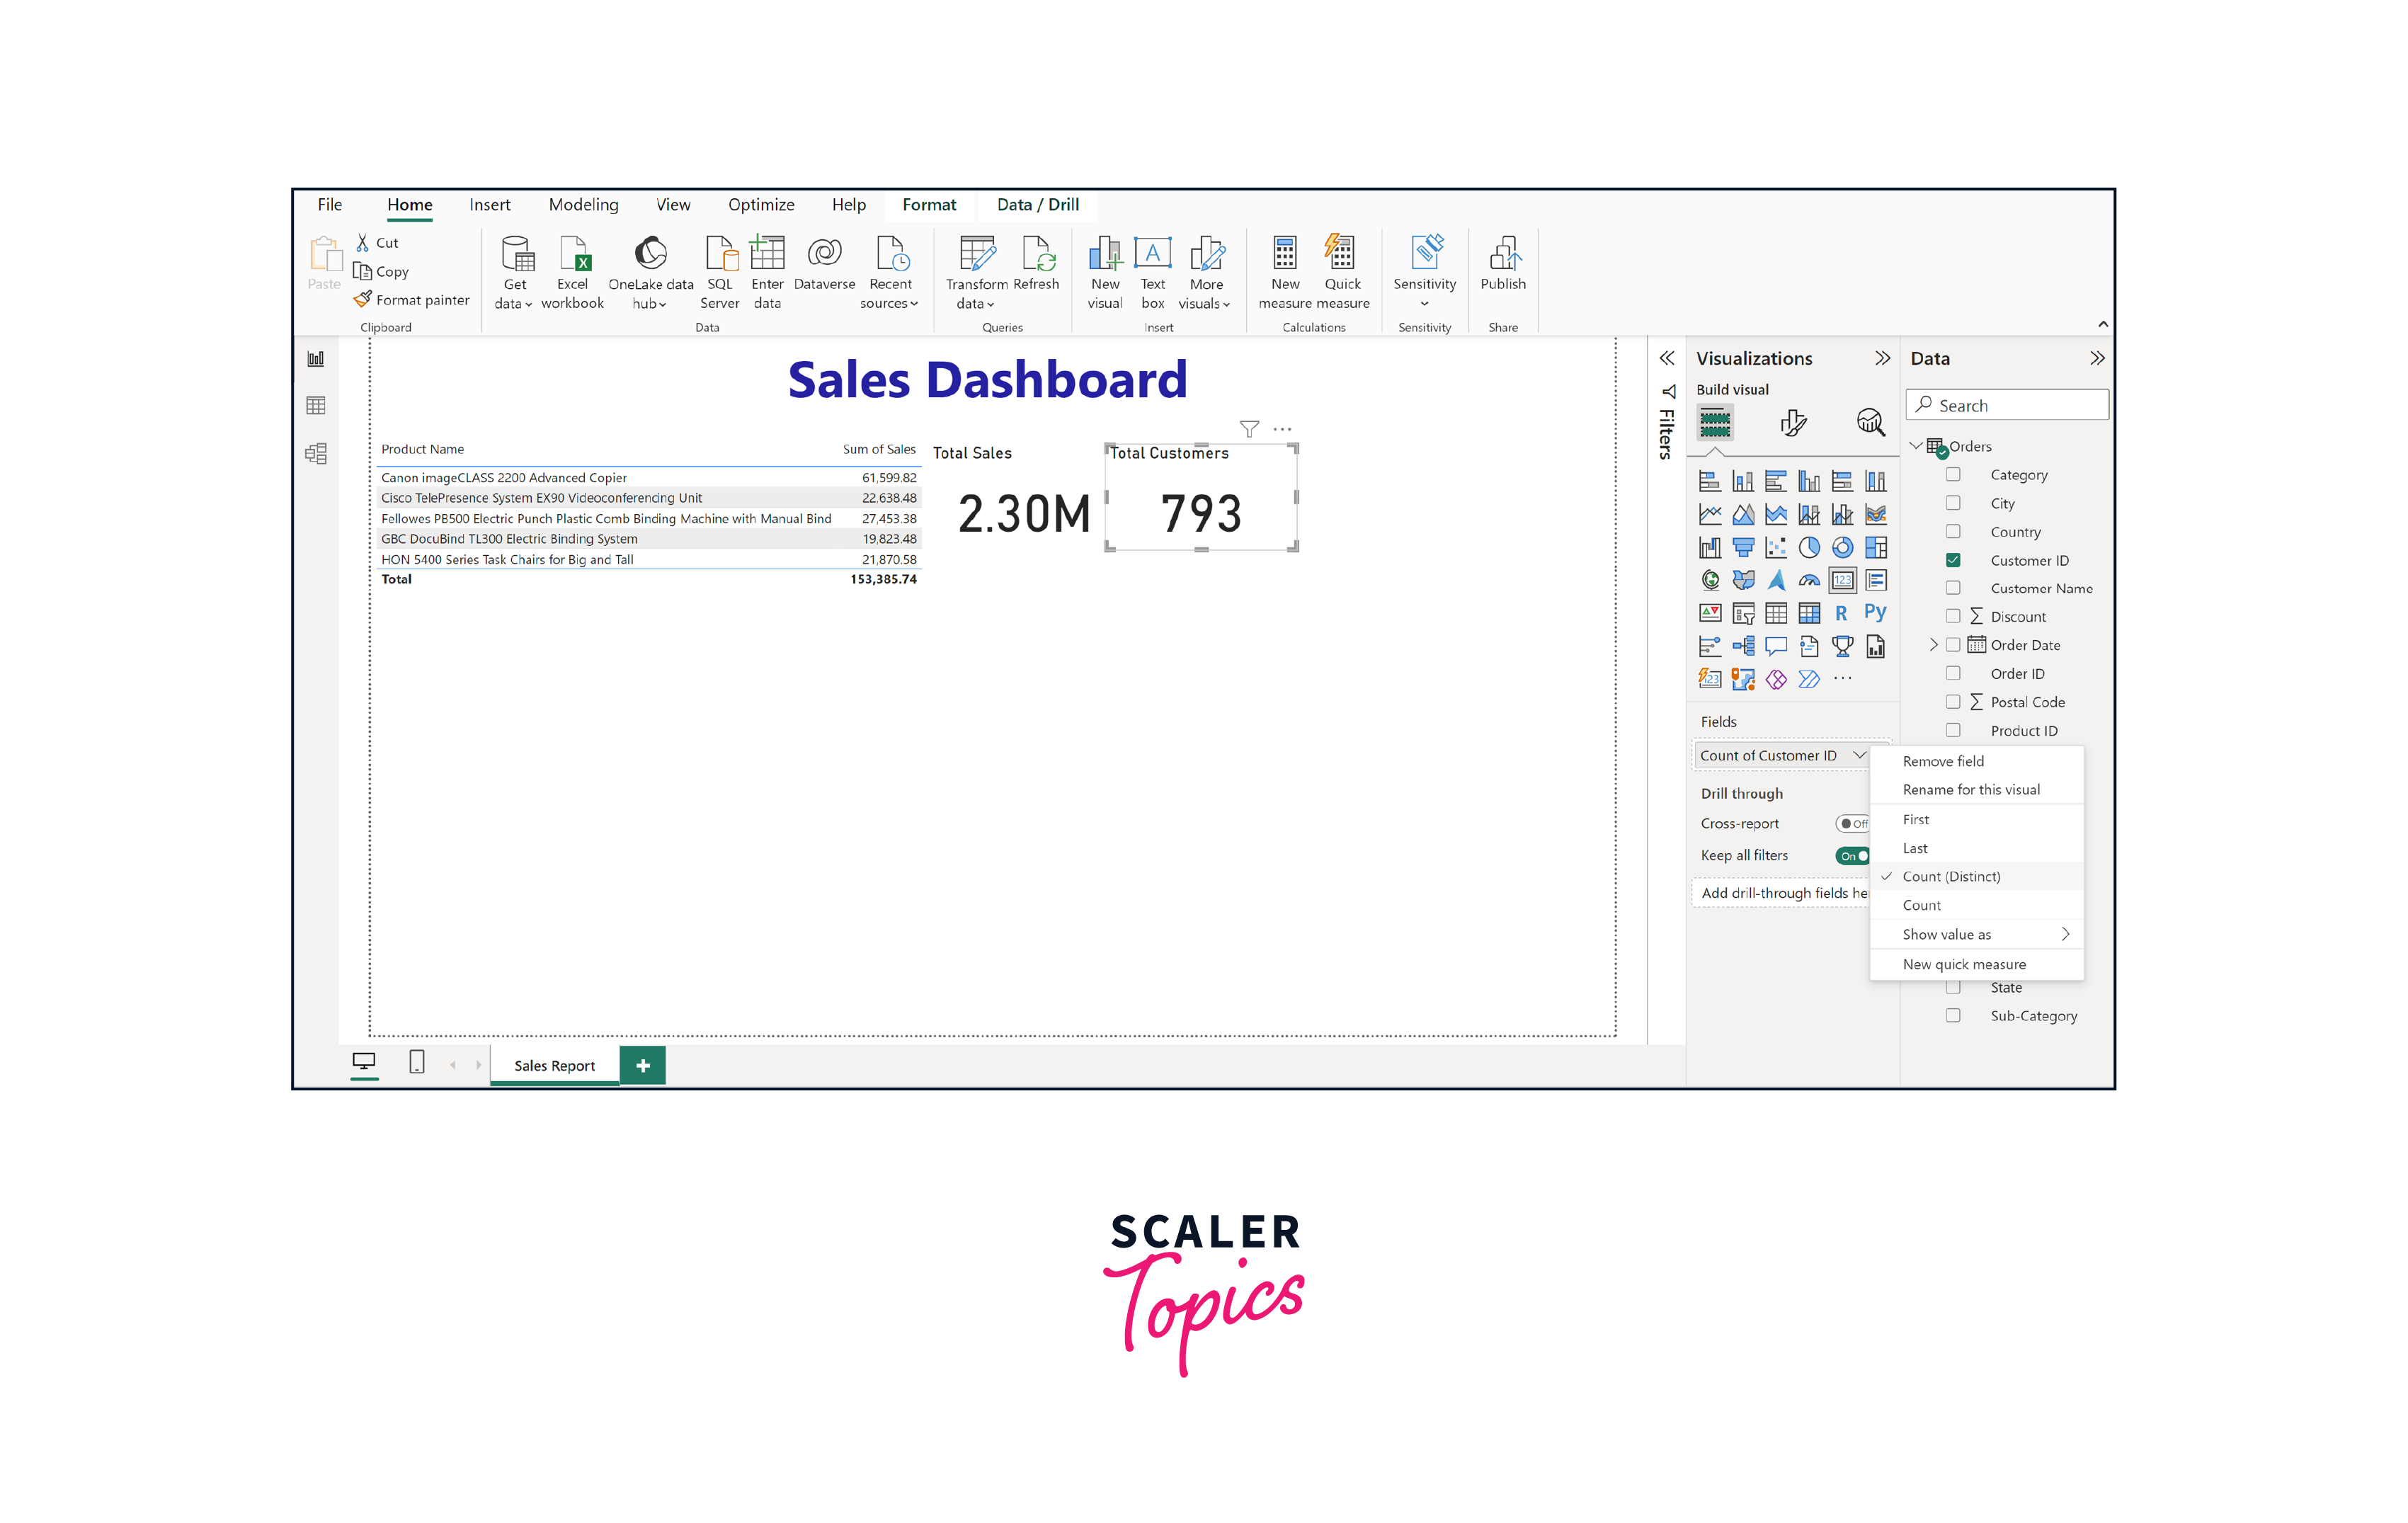
- Step 4.
Opt for the Slicer visual type, then drag the Order Date column into the Fields section. Assign "Order Date" as the Slicer Header. Based on your preferences, you can proceed to choose the desired slider color, border color, position, line width, and any additional formatting options for the slicer visual through the tools available in the Format Visual tab.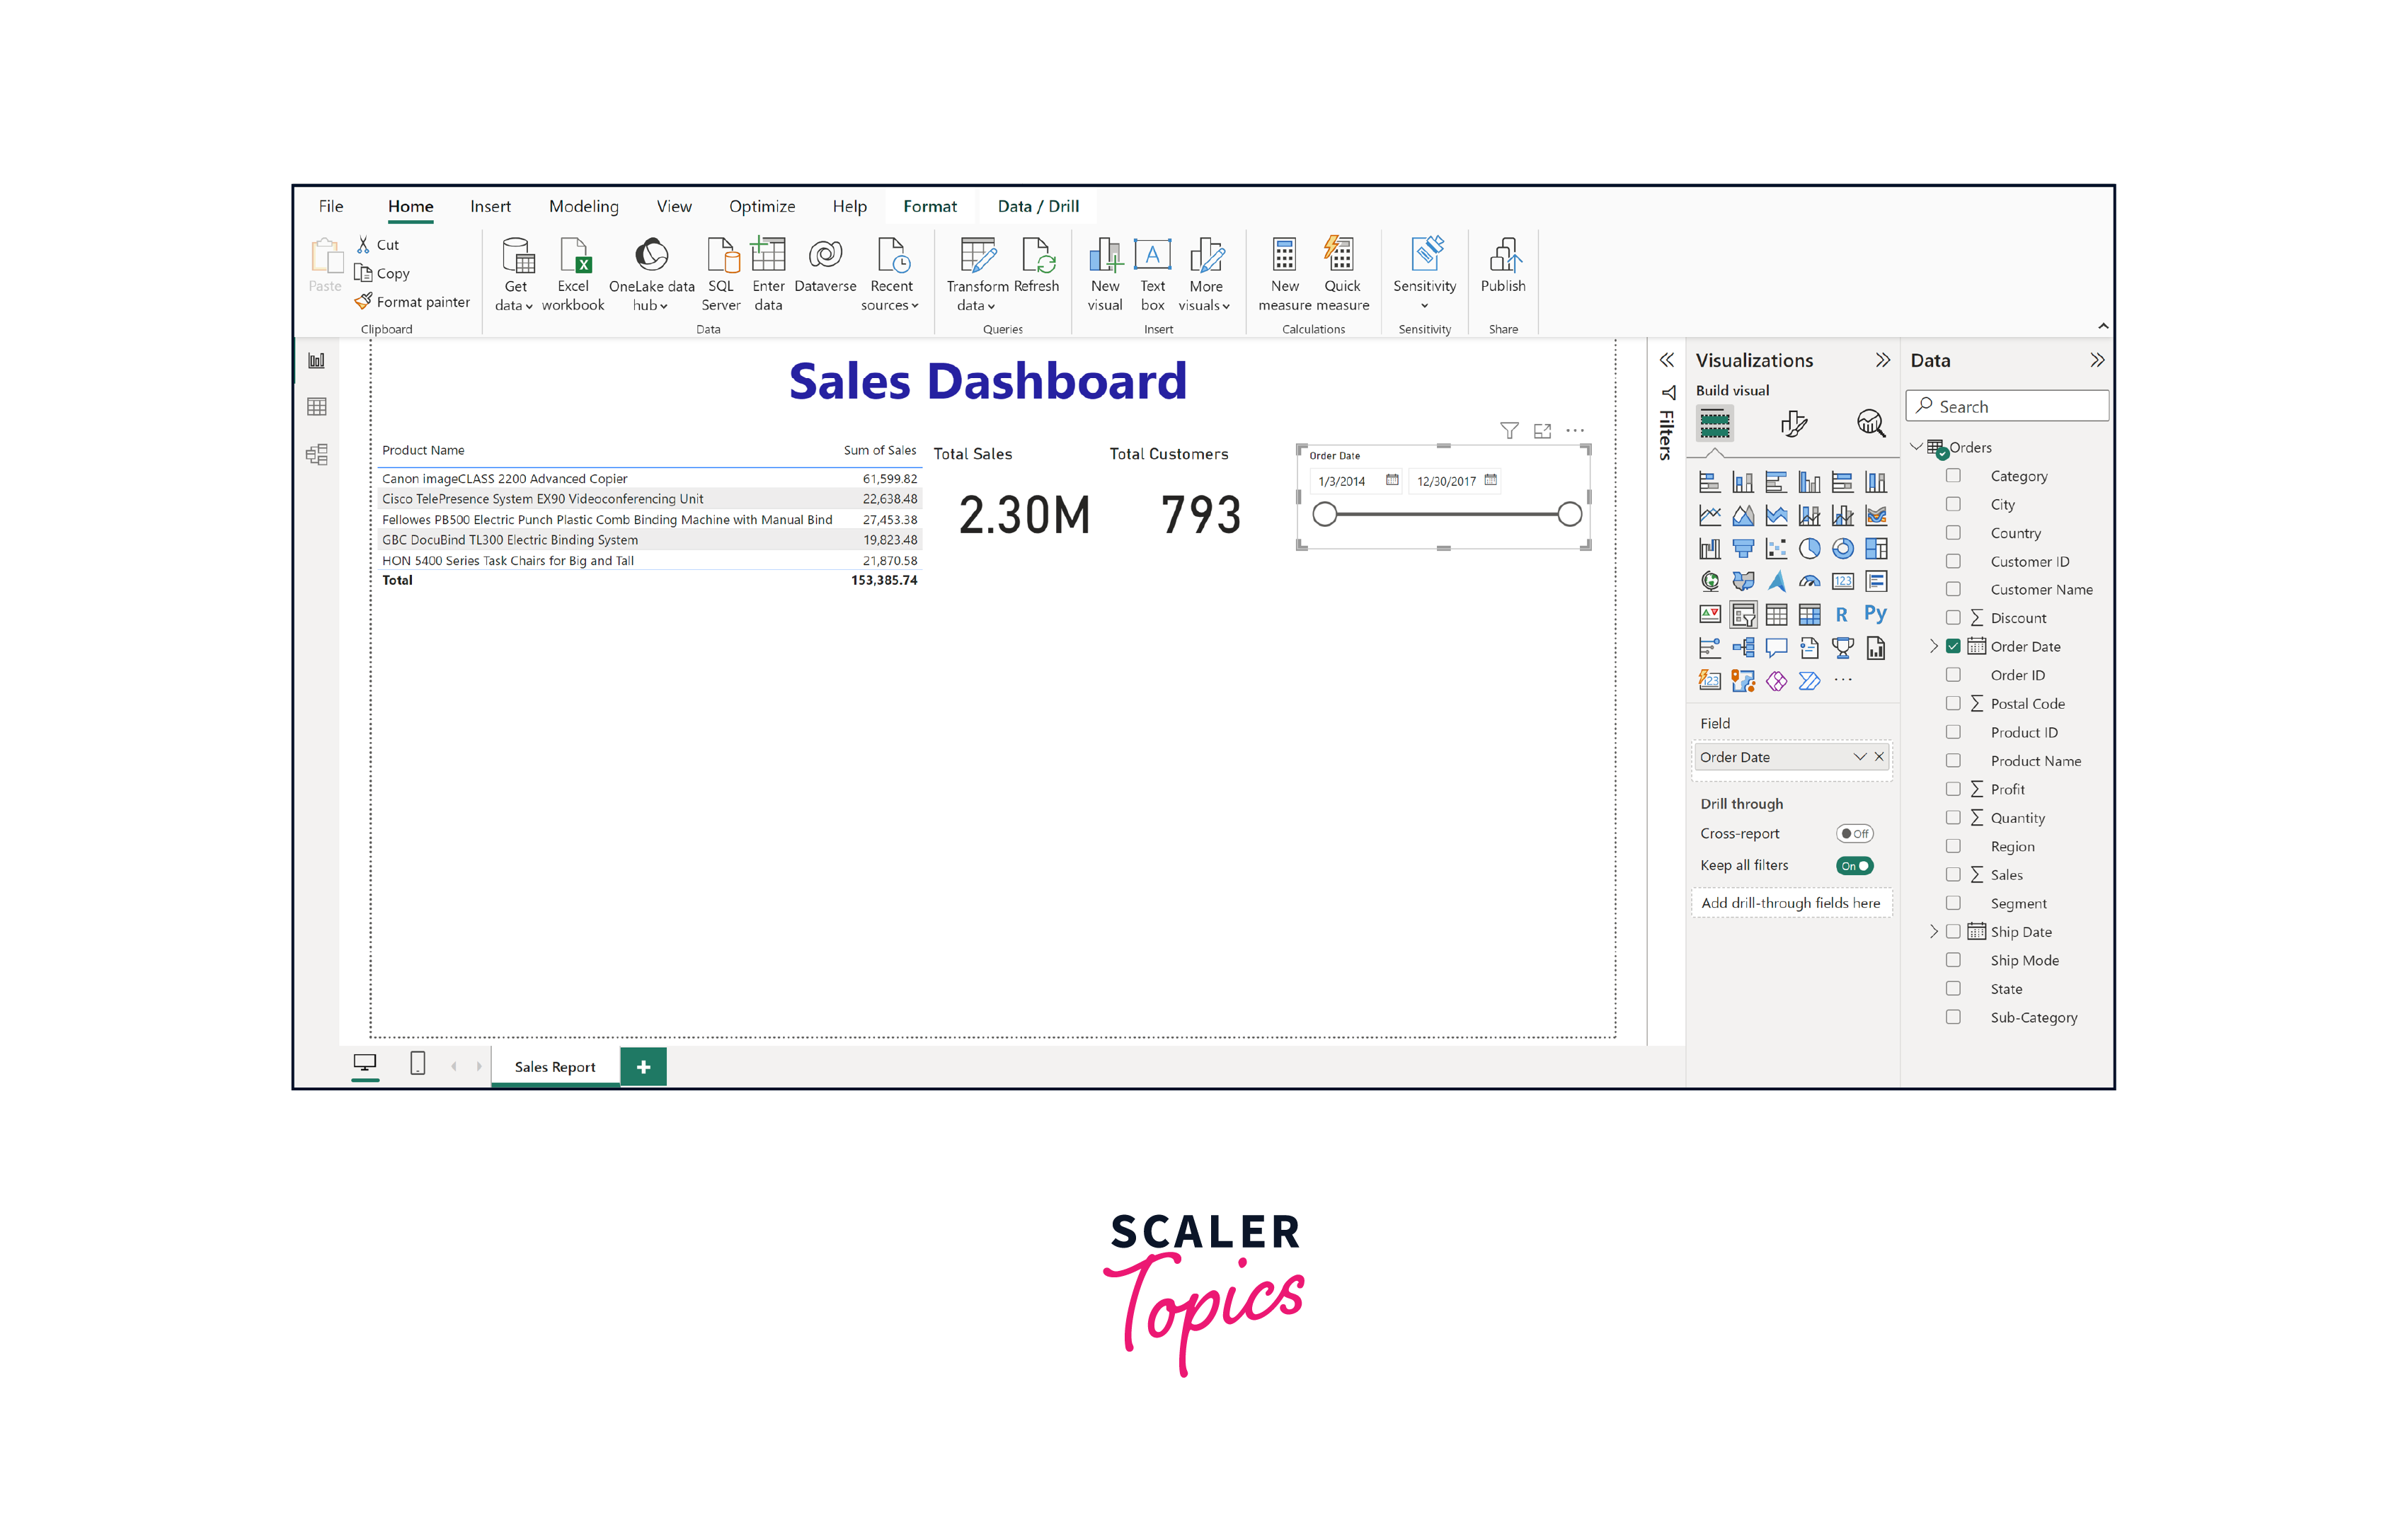
- Step 5.
Next, to achieve a comprehensive understanding of our sales distribution, we will utilize pie charts. These charts will visually represent the distribution of sales among different customer segments and showcase the overall count of products shipped according to different shipping modes.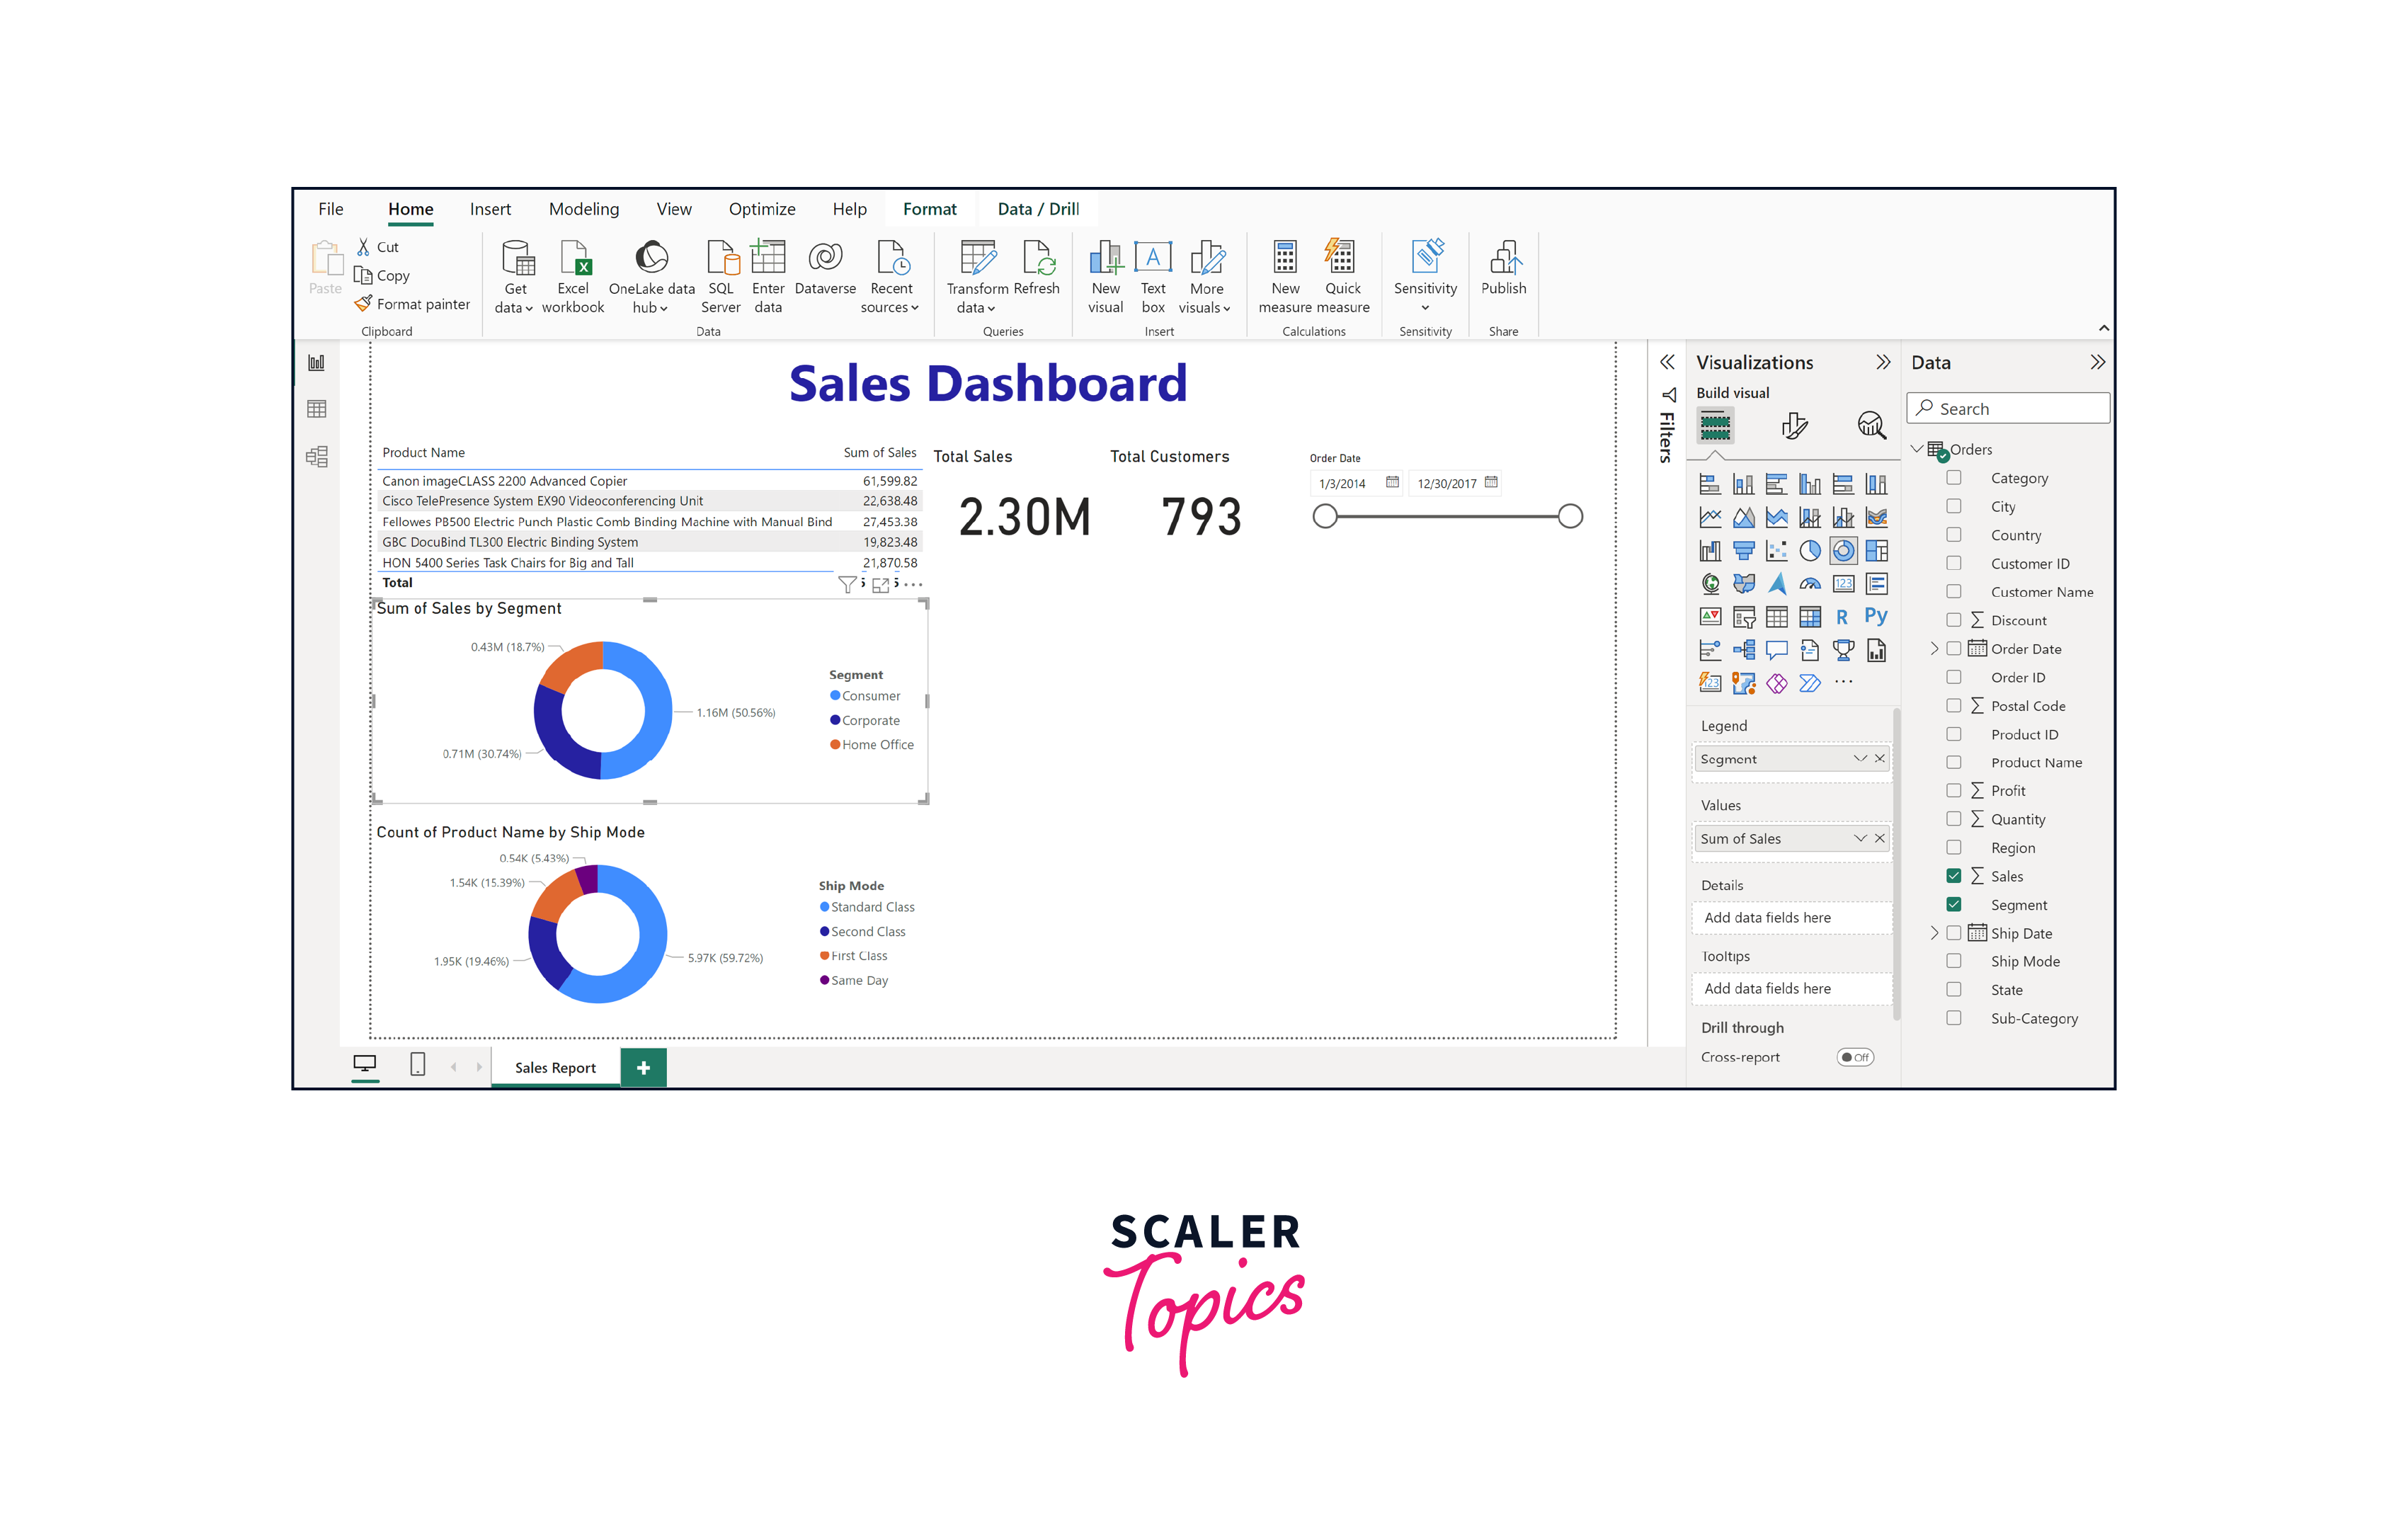
- Step 6.
Moving forward, we will make use of a horizontal bar chart to illustrate the sales figures for each subcategory of our products. Additionally, we'll employ a treemap visualization to showcase the sales distribution across different states, as shown in the below figure. With the sales report now finalized, we'll transition to constructing a profit report using the Superstore dataset.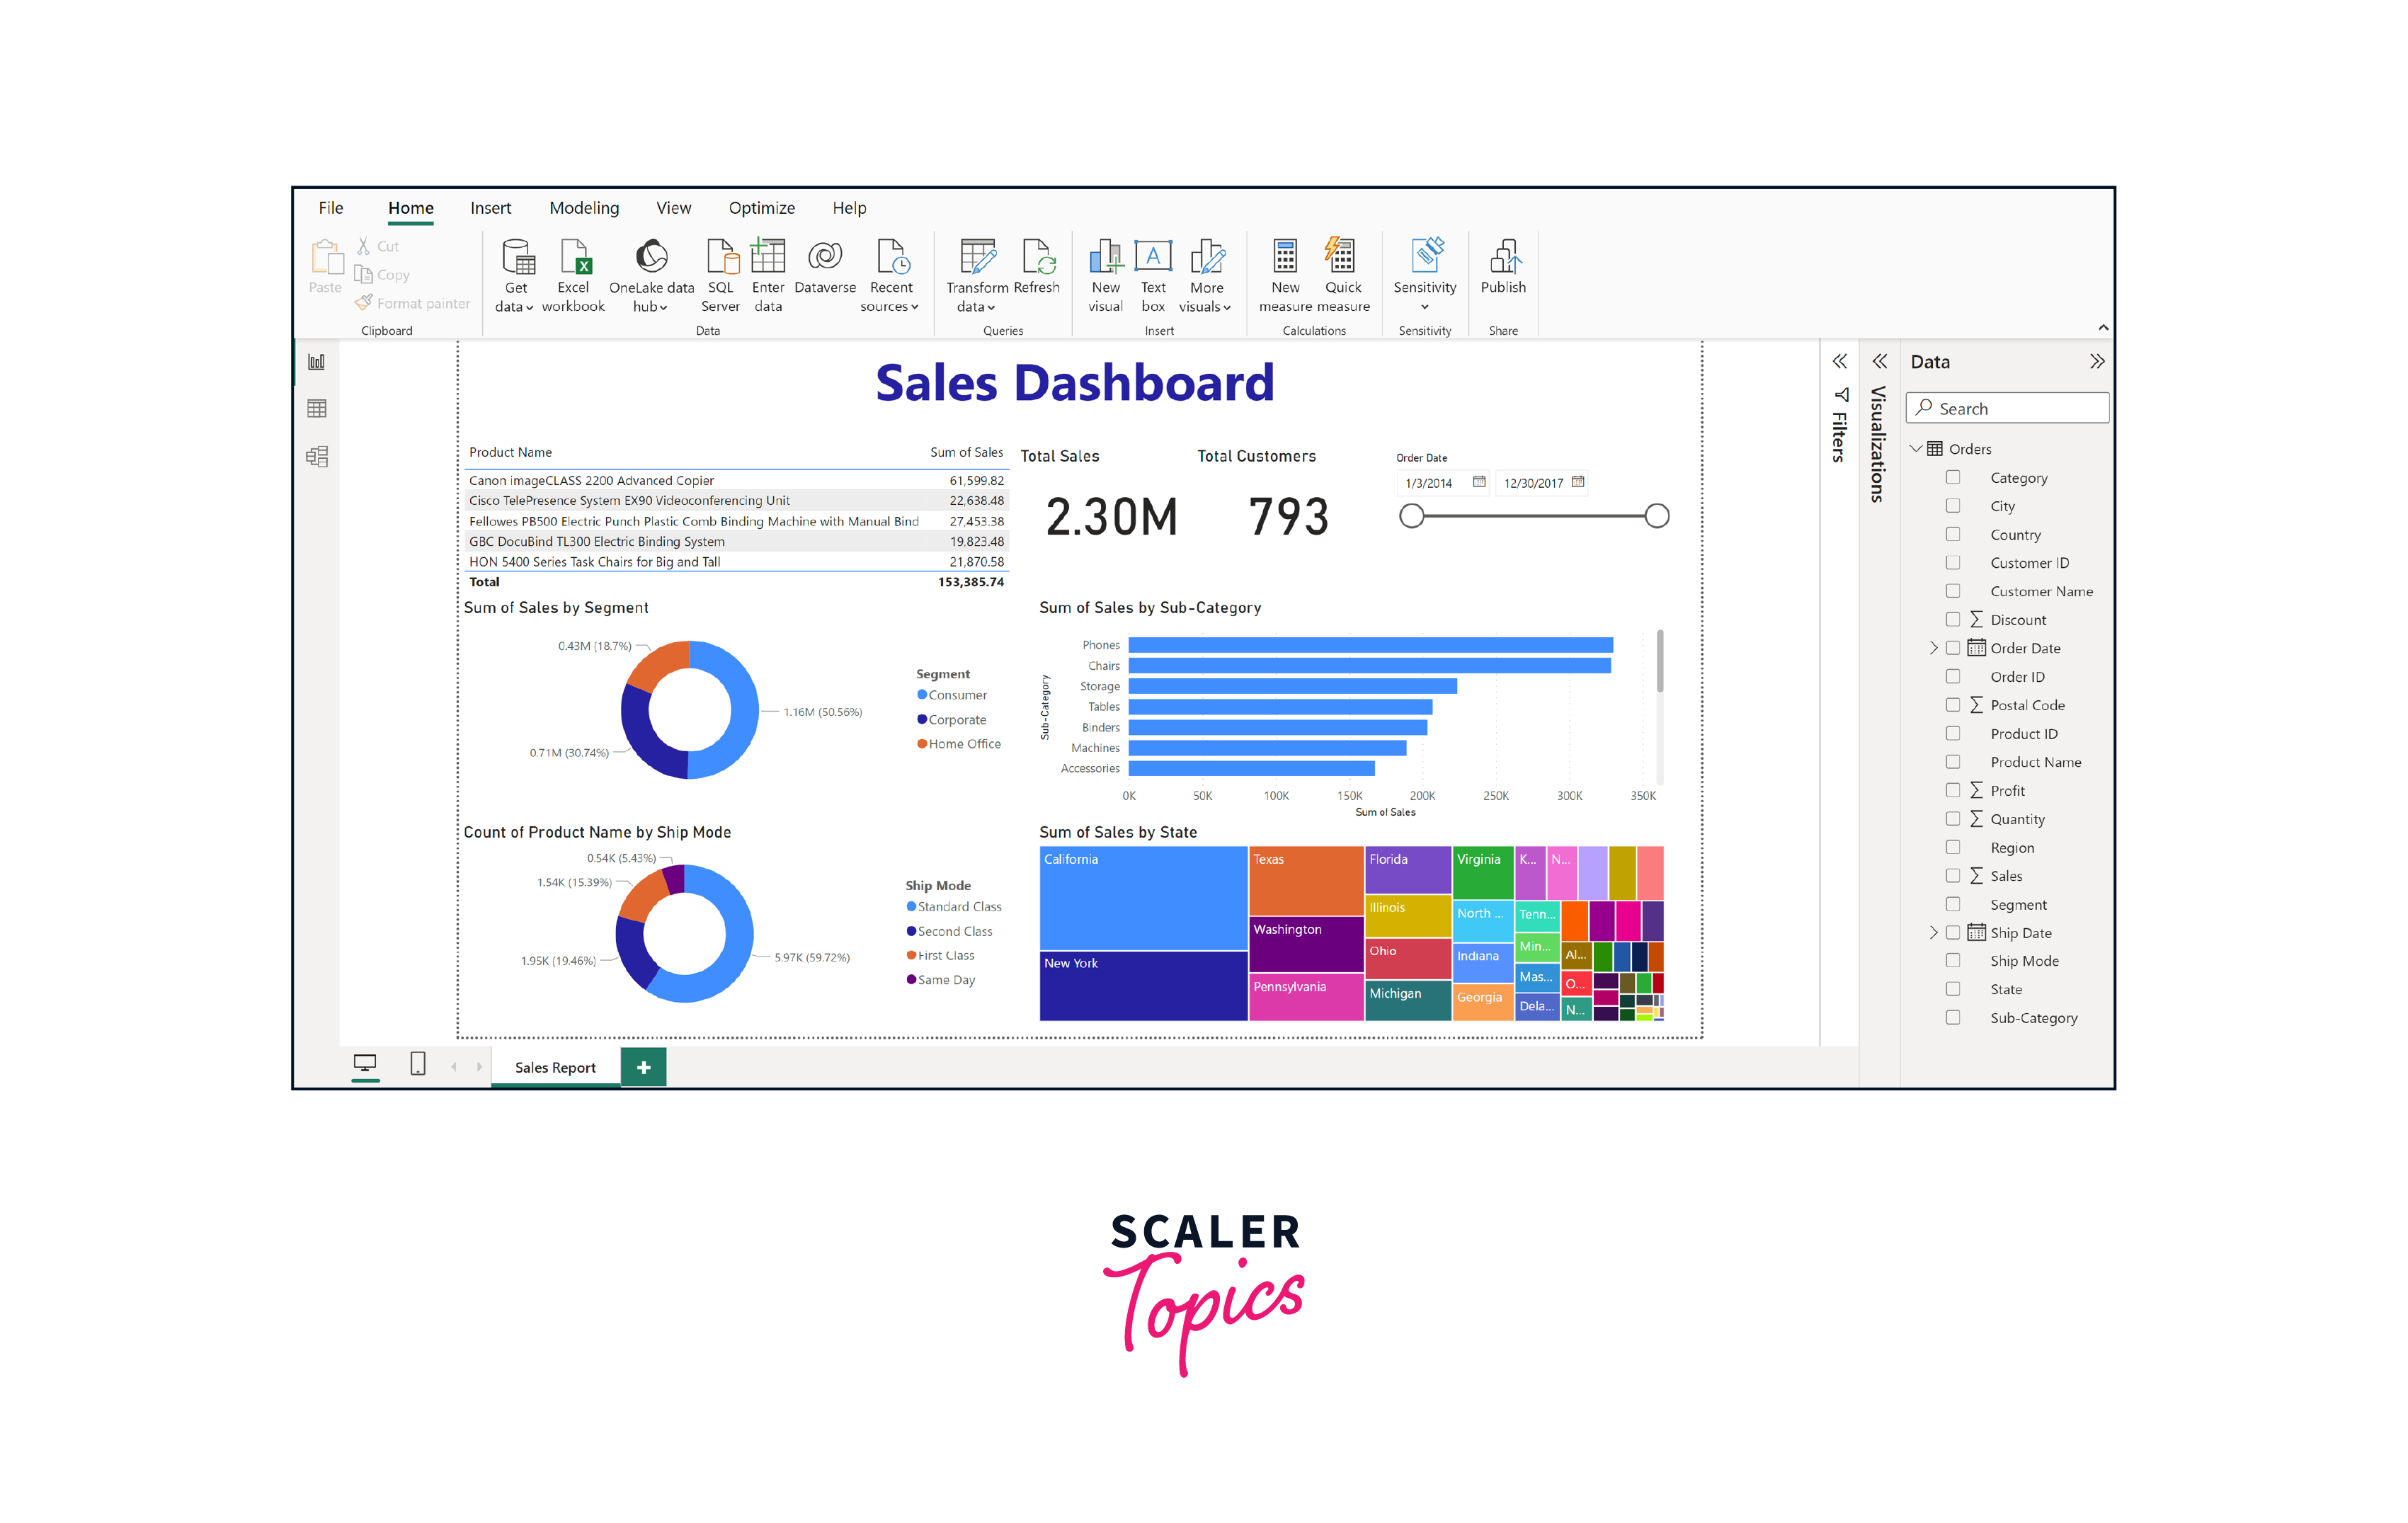
- Step 1.
-
Profit Report
- Step 1.
Let's proceed to build the profit report. Following the approach we employed in the sales report, we'll begin by renaming the report page within Power BI Desktop. To do so, click on the "Rename" option, as indicated in the figure below. - Step 2.
Next, introduce a text box to serve as the title. For this instance, we'll label it as "Profit Dashboard." Within the Build Visual section, we'll again incorporate two card visuals. The first card visual will showcase the Total Profit, while the second card visual will represent the Total Customers. Subsequently, we'll proceed to select the Slicer visual type. We'll drag the Order Date column into the Fields section and assign "Order Date" as the Slicer Header. This slicer will allow us to filter data based on order dates.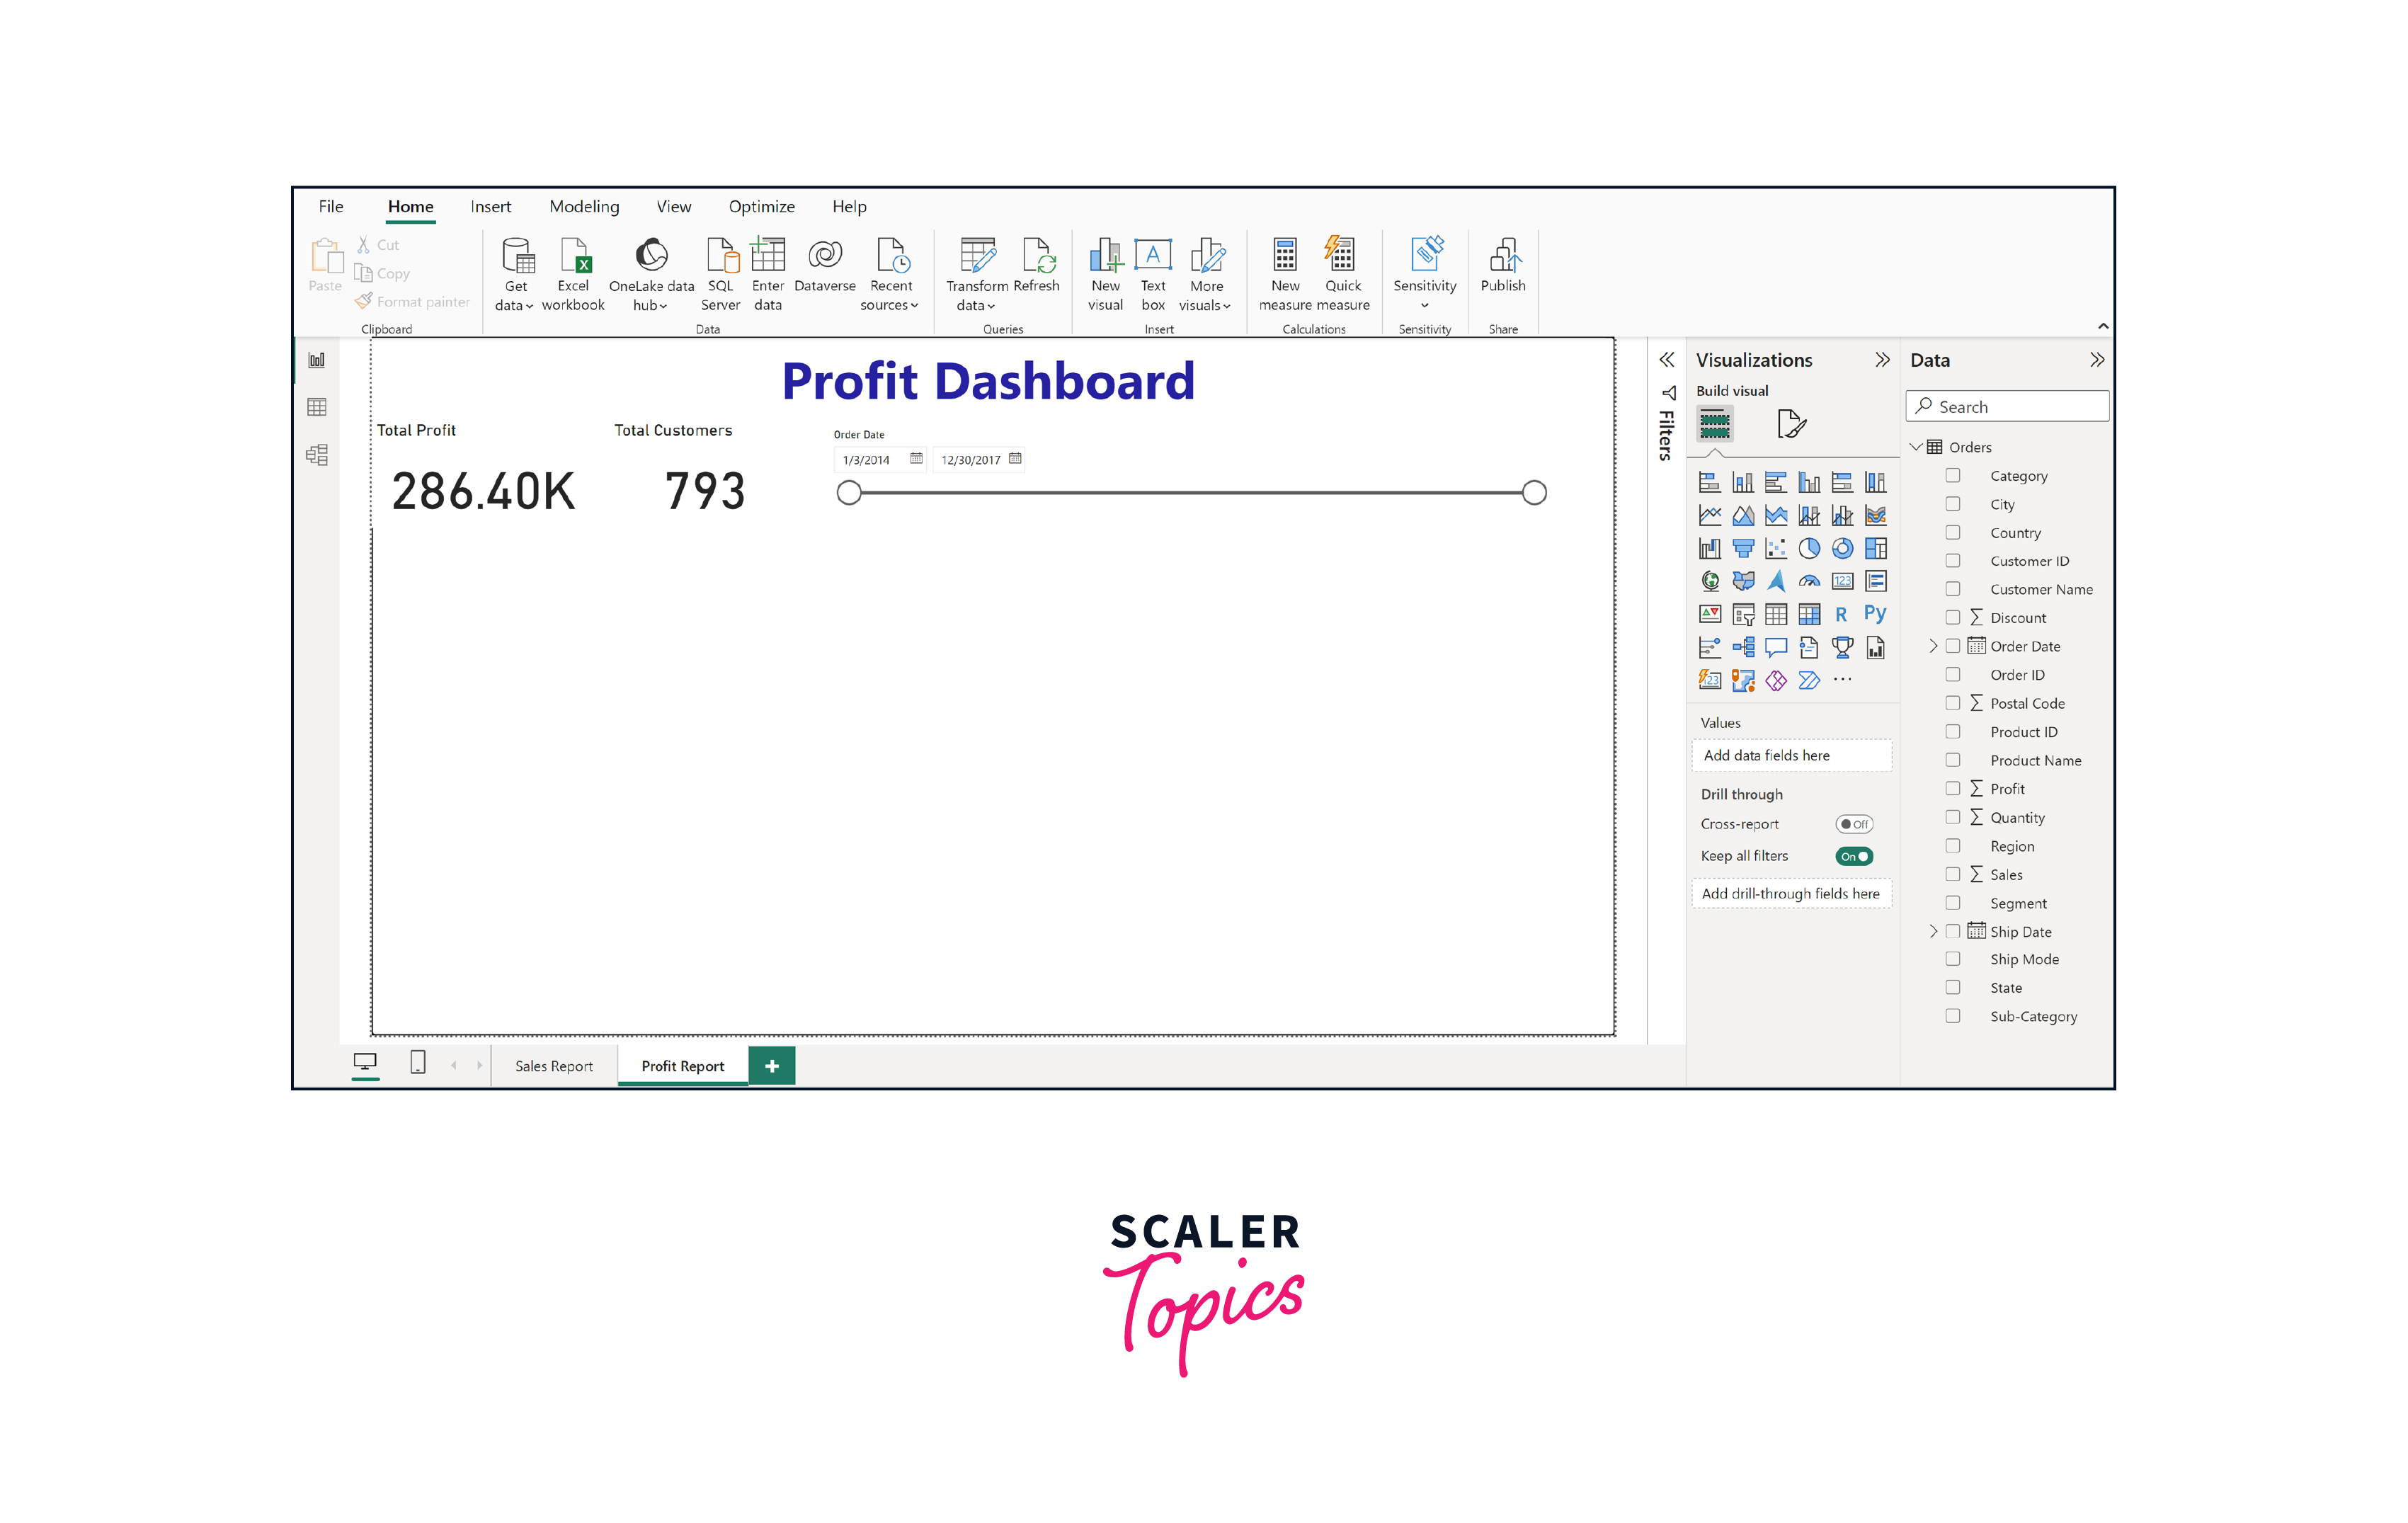
- Step 3.
Moving forward, we will make use of pie charts to visually present the distribution of profits based on customer segments and regions. This visualization will allow us to gain insights into how profits are distributed among different customer segments and regions.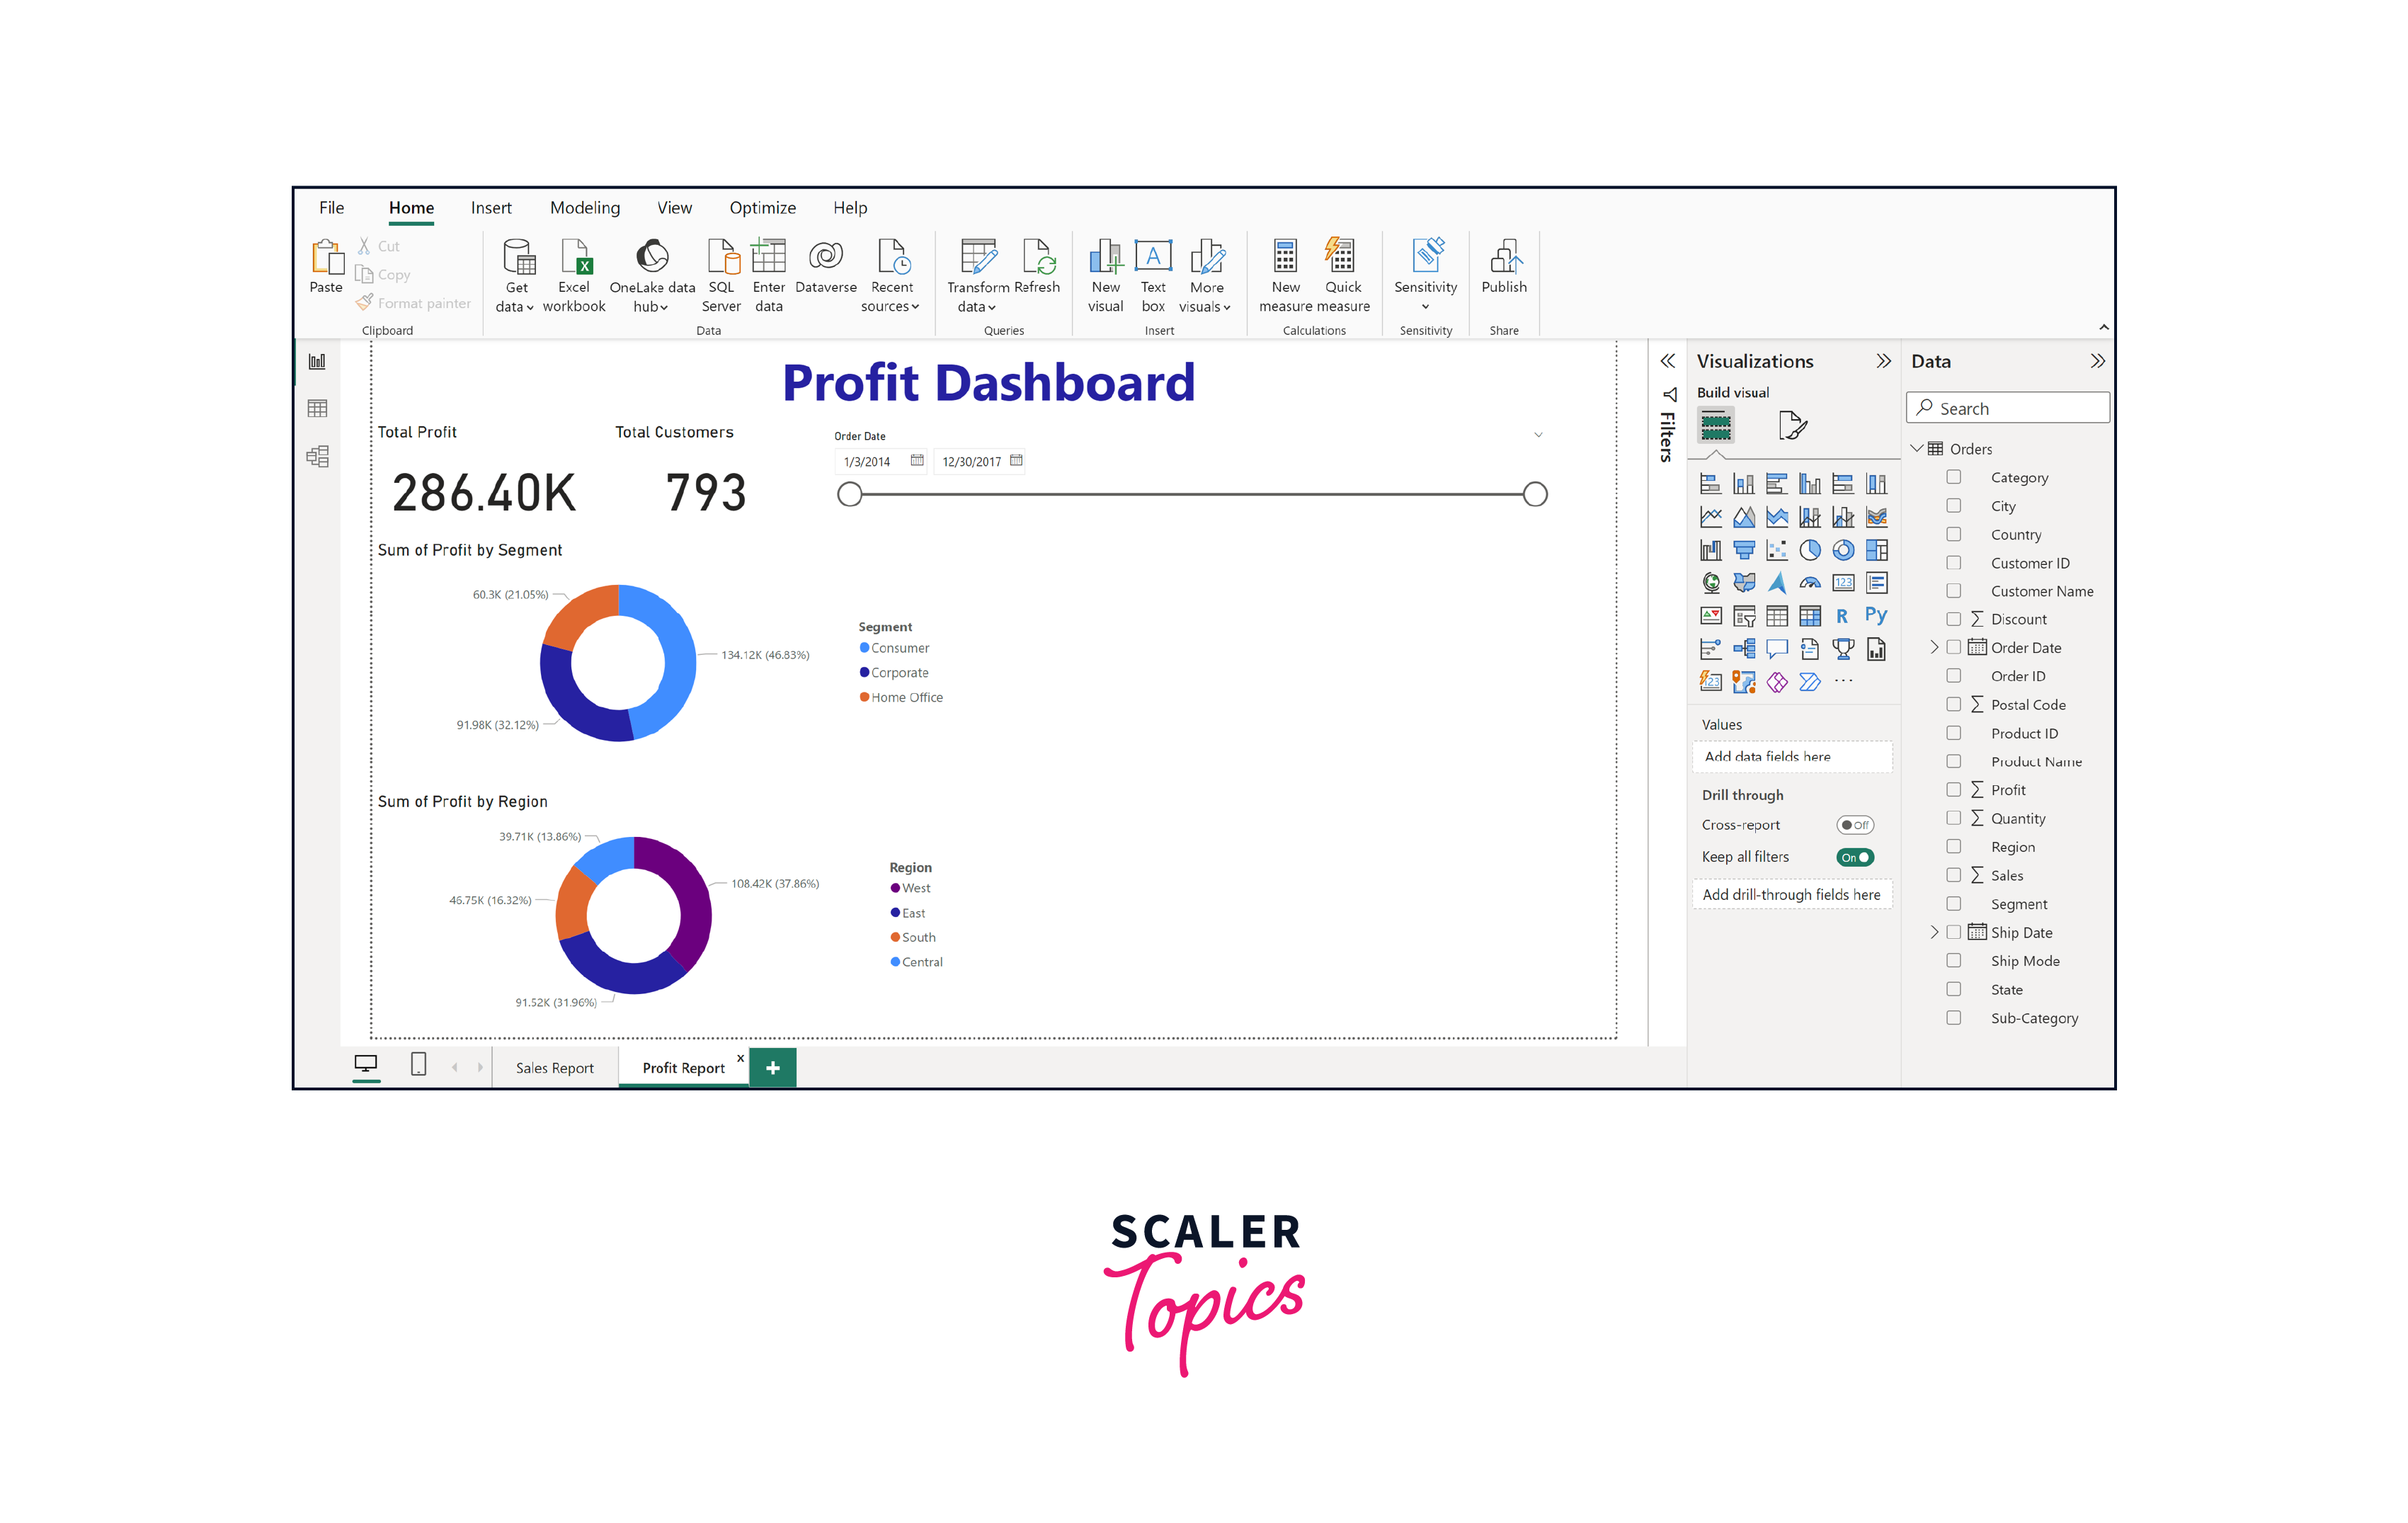
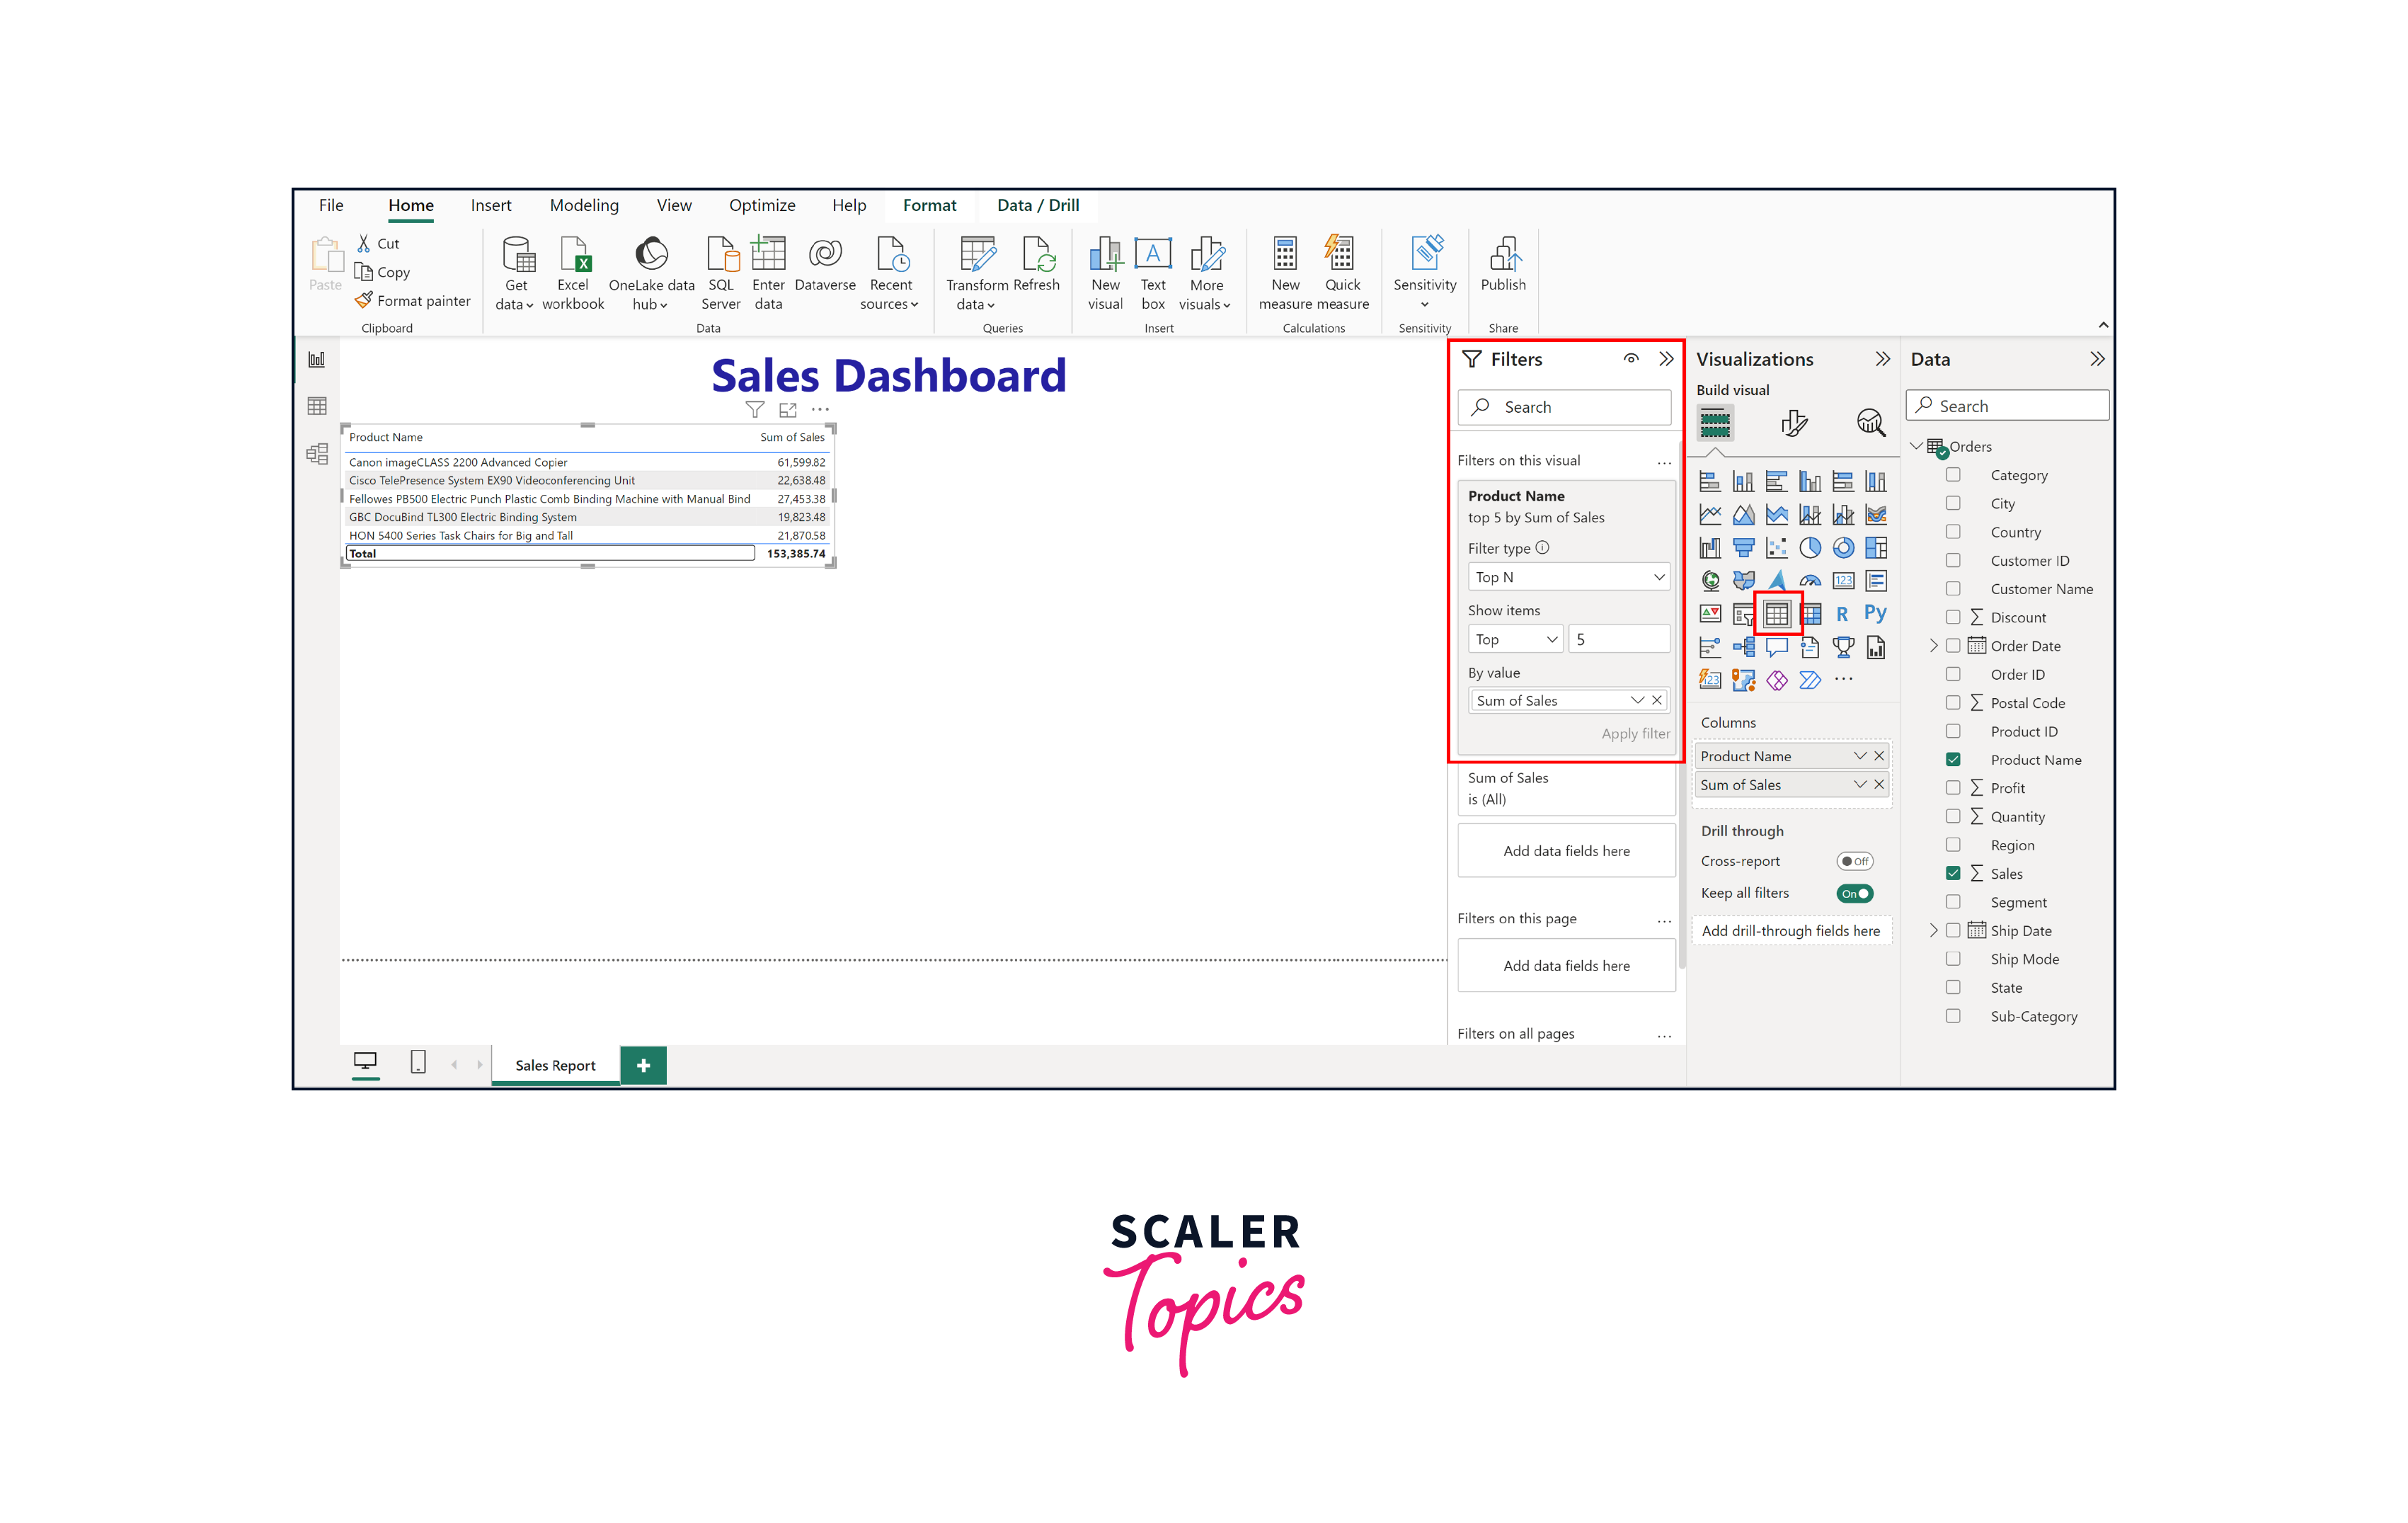
- Step 4.
To effectively visualize the Top 10 States based on Profits, we will employ the Filled Map visual. This can be achieved by applying a Top N filter on the State dimension, showcasing the states that yield the highest profits in a geographical context.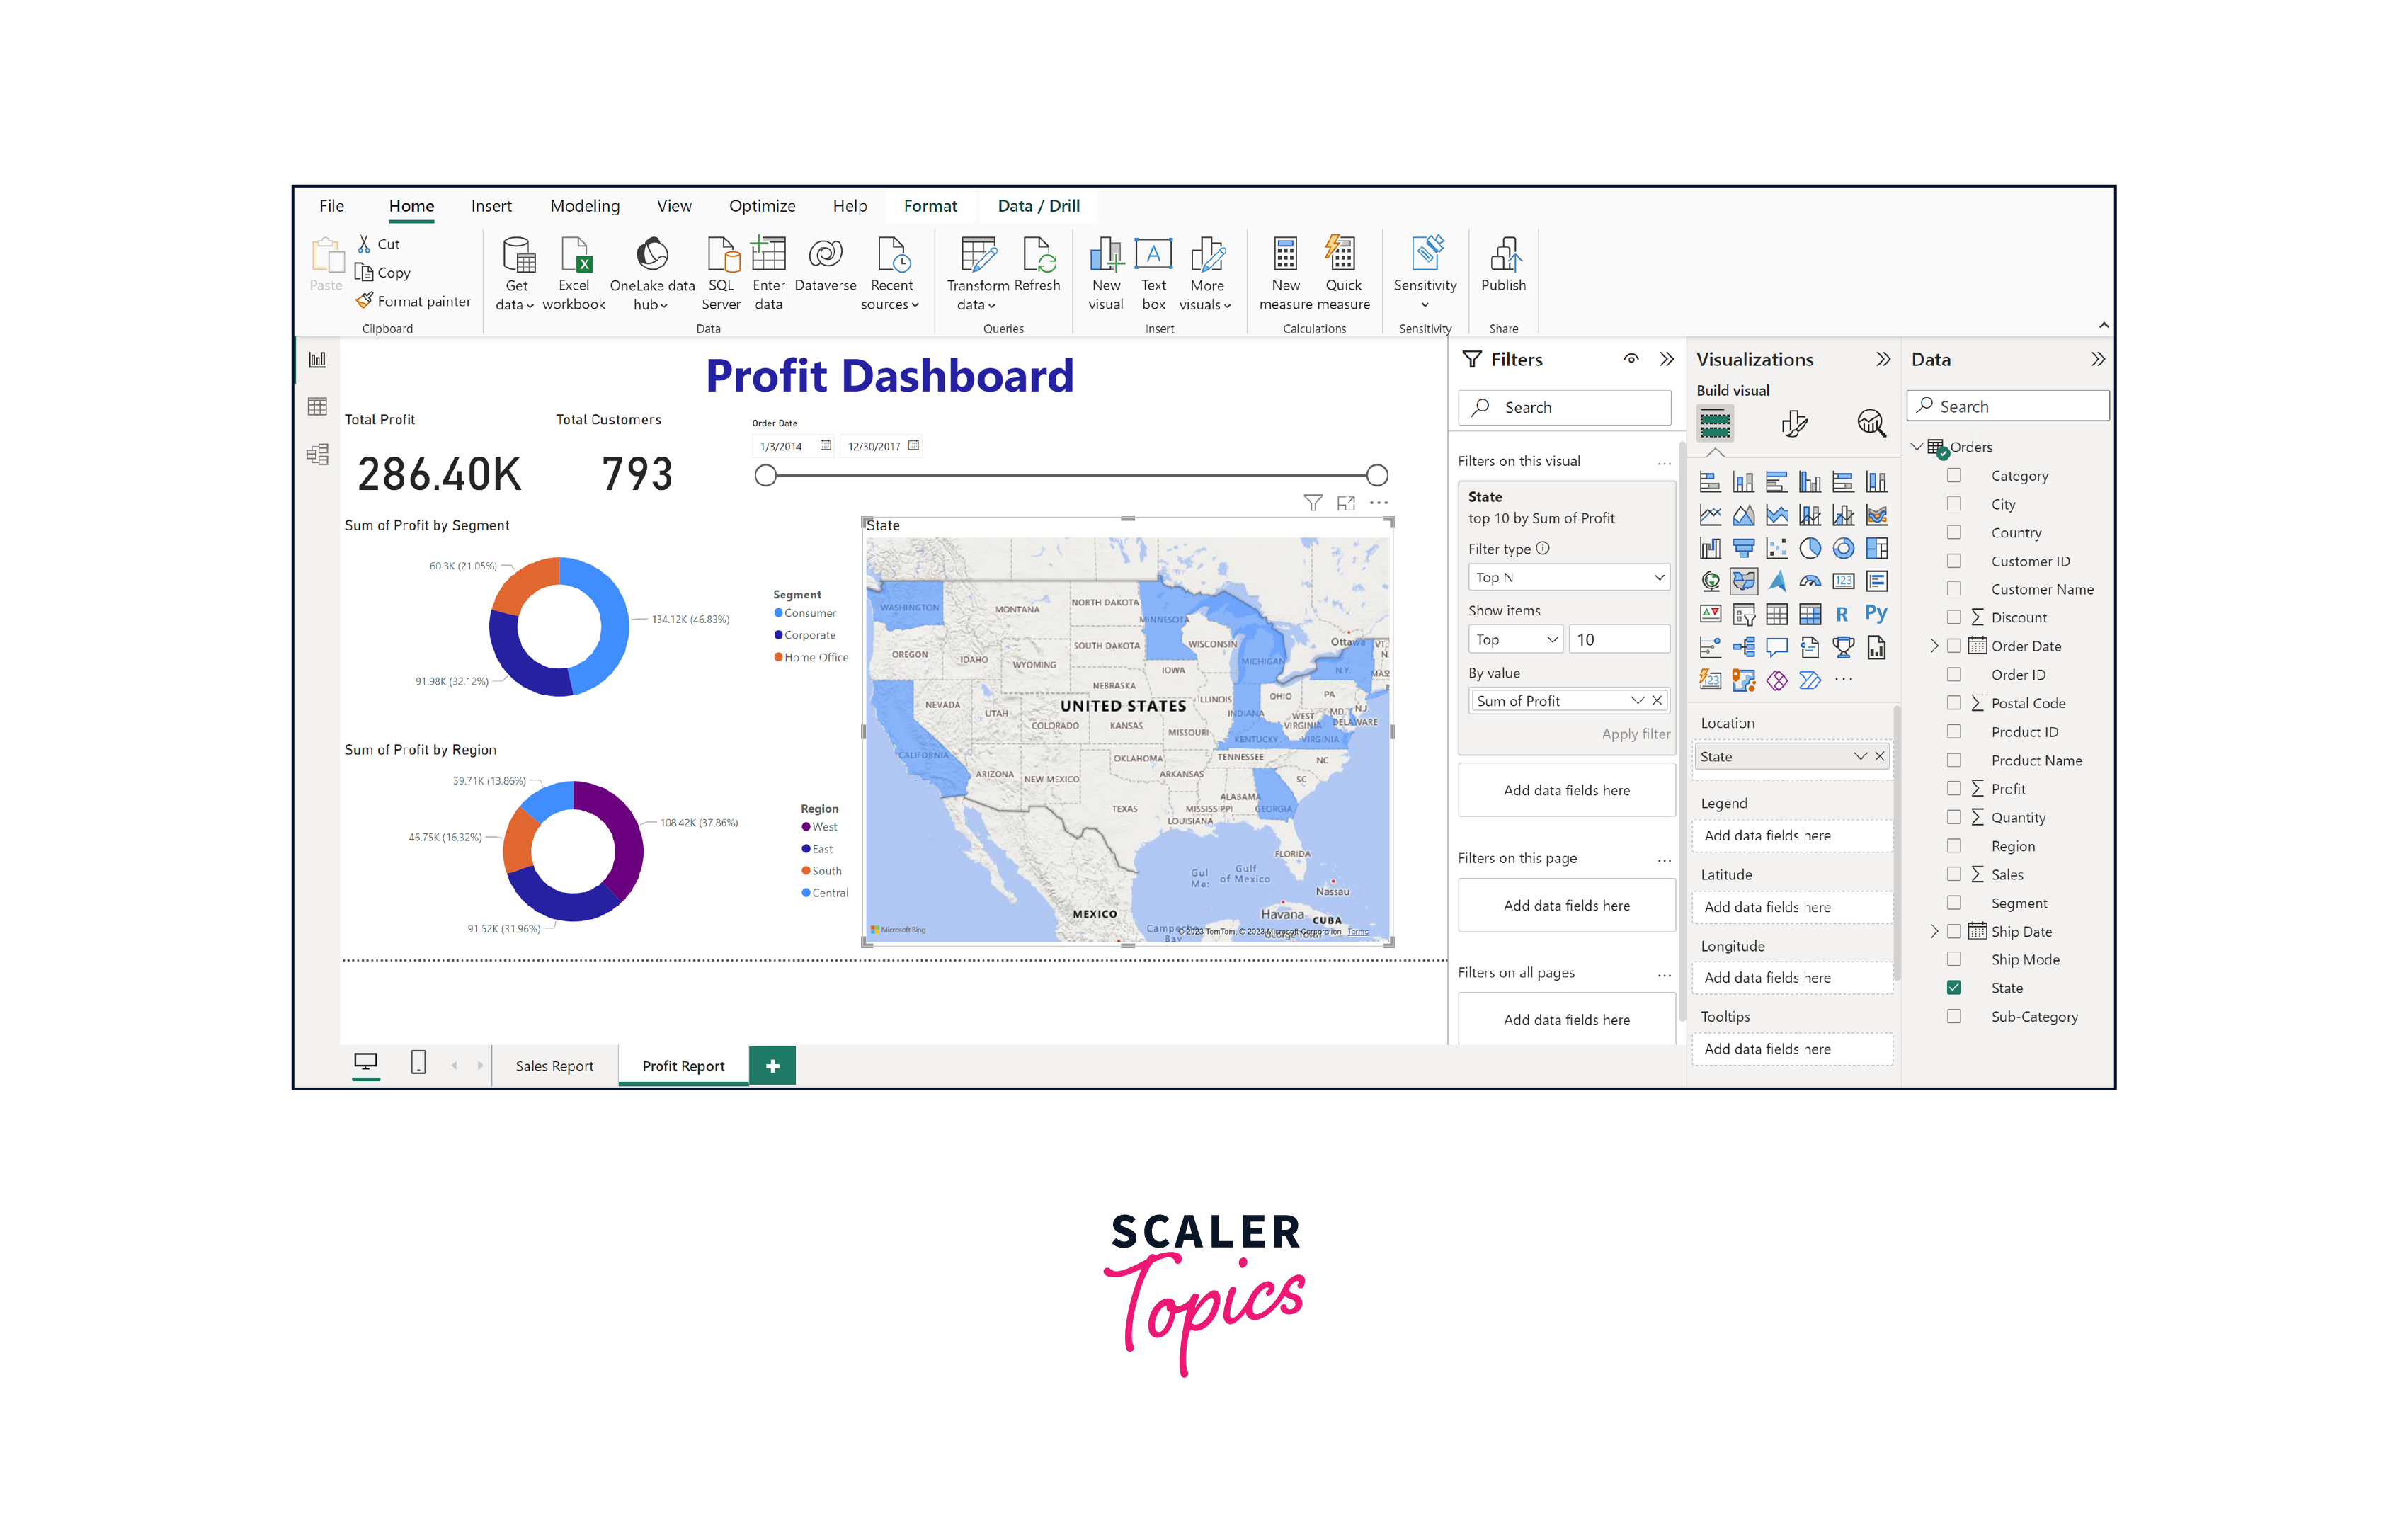
- Step 1.
Publishing the Report
Publishing the report is a crucial step that involves sharing your insights with stakeholders. To accomplish this, you can leverage Power BI's publishing features to upload your report to the Power BI service. By doing so, you make your analysis accessible to a wider audience, enabling collaborators and decision-makers to access real-time insights without requiring them to have Power BI Desktop. The Power BI service also facilitates interactive dashboards and scheduled data refreshes, ensuring that your report remains up-to-date. This seamless sharing enhances collaboration, supports data-driven decision-making, and empowers your team to derive actionable insights from the analysis.
Conclusion
- We explored the Superstore dataset through Power BI, unearthing insights from sales and profit data.
- We also demonstrated step-by-step data transformation, visualization, and analysis techniques and created impactful visualizations including charts, cards, slicers, and maps for comprehensive insights.
- We built two dashboards, one for sales report and other for profit report to understand the performance of sales and profit across regions, segments, etc.
- Finally, we enabled efficient sharing of analysis by publishing the report on the Power BI service, fostering informed decision-making.