PyTorch Profiler
Overview
With the advent of very large neural models in deep learning and AI, measuring or assessing the model's performance during inference or training is a crucial step in deploying or scaling such large models in production or otherwise. This article is an introductory tutorial to one such open-source tool that enables us to get an accurate and efficient performance analysis and to troubleshoot for large-scale deep learning models - the tool is called the PyTorch Profiler.
Introduction
To use deep neural models efficiently, we want to get an idea of the model's performance in terms of memory consumption, the execution time during inference, any bottlenecks as the model is used for inference, and so on.
To this end, various standard performance debugging tools provide GPU hardware-level information on the model performance. The autograd profiler (torch.autograd.profiler) can capture information about PyTorch operations.
The challenge here is that the debugging tools that provide GPU hardware level information are not able to provide data on PyTorch-specific context of operations, and thus to be able to recover that information, we as users will need to combine multiple tools or manually add some information to get an overall sense of the data.
Similarly, the autograd profiler does not have any support to capture information on the device level (GPU hardware level) and thus cannot support visualization.
To get around these caveats or keep them in mind, we have another tool developed by Facebook in collaboration with the Microsoft team called the PyTorch Profiler, which is a very beneficial tool for analyzing our models' performances.
Let us begin by getting an overview of what the tool is.
Scaler Placement Report and Statistics
Scaler learners achieved 2.5x salary growth with average post-Scaler CTC reaching ₹23L.
What is PyTorch Profiler?
The PyTorch Profiler is an open-source tool developed as a part of a collaboration between Microsoft and Facebook. It is designed to enable performance debugging for large deep neural model building.
It allows us to run accurate and efficient performance analyses and troubleshoots large-scale deep-learning models.
The PyTorch Profiler (torch. profiler), unlike GPU hardware level debugging tools and the PyTorch autograd profiler, leverages information from both the sources - GPU hardware and PyTorch-related information and correlates them and hence enables us to be able to realize the full potential of that information. It uses a new GPU profiling engine built using NVIDIA CUPTI APIs to obtain GPU kernel events.
This profiler is also designed to automatically detect any bottlenecks in the model and then generate recommendations on how to get around these bottlenecks. The output from the profiler's debugging can be visualized by the user in TensorBoard.
Transform Your Career
Choose from our industry-leading programs designed for career success
Modern Software and AI Engineering Program
Master full-stack development with AI integration

Modern Data Science and ML with specialisation in AI
Advanced data science techniques with AI specialization
Advanced AIML with Specialisation in Agentic AI
Deep dive into AIML with focus on Agentic systems
DevOps, Cloud & AI Platform Engineering
Build and manage AI-powered cloud infrastructure
AI Engineering Advanced Certification by IIT-Roorkee
Premier AI engineering certification from IIT-Roorkee
Getting Started with PyTorch Profiler
Using the PyTorch profiler to profile our model training loop is as simple as wrapping the code for the training loop in the profiler context manager, as is shown below.
The tensorboard_trace_handler facilitates the automatic saving of profiling results to disk for analysis in TensorBoard.
We can install the PyTorch Profiler TensorBoard Plugin package using the command below to view the results of the profiling session in TensorBoard.
Visual Code Integration
VS Code by Microsoft is among the most popular code editors used by data scientists and ML developers. The Python extension for VS Code comes with integrated support for TensorBoard in the code editor with a built-in lifecycle management feature. Thus it also supports the PyTorch Profiler.
After VS Code and the Python extension are installed on the system (it can be installed from here, use the keyboard shortcut CTRL + SHIFT + P (CMD + SHIFT + P on a Mac) to launch the Command Palette and type "Launch TensorBoard" command.
If those are not on the system, VS Code will automatically install the TensorBoard package and the PyTorch Profiler plugin package. It will also launch the TensorBoard process for us and look for any TensorBoard log files within the current working directory. Finally, the code will automatically close the process of closing the tab VS.
Examples of PyTorch Profiler
PyTorch Profiler has many features and uses. For example, it allows for collecting performance metrics during training and inference time.
By wrapping our code in the Profiler's context manager, we can better understand the most expensive model operators, examine the input shapes and stack traces, study GPU's kernel activity, visualize the execution trace, analyze memory consumption, and so on.
Let us study some examples demonstrating the features offered by the profiler API.
Below is the syntax for the Profiler context manager.
The parameter description follows -
- activities (iterable)– list of activity groups (CPU, CUDA) to use in profiling, supported values:
- torch.profiler.ProfilerActivity.CPU
- torch.profiler.ProfilerActivity.CUDA.
- Default value: ProfilerActivity.CPU and (when available) ProfilerActivity.CUDA.
- schedule (Callable) – callable that takes a step (int) as a single parameter and returns ProfilerAction value that specifies the profiler action to perform at each step.
- on_trace_ready (Callable) – callable that is called at each step when the schedule returns ProfilerAction.RECORD_AND_SAVE during the profiling.
- record_shapes (bool) – save information about the operator's input shapes.
- profile_memory (bool)– whether to track tensor memory allocation/deallocation.
- with_stack (bool) – record source information (file and line number) for the ops.
- with_flops (bool)– whether to use formulae to estimate the FLOPs (floating point operations) of specific operators (matrix multiplication and 2D convolution).
For a full list of parameters, refer to the docs.
Turn Learning into Career Growth
Performing Execution Time with Profiler
Let us first learn how to track the execution time of a particular script using the PyTorch Profiler.
We will first import all the necessary libraries and use the resnet18 model from the torchvision for all our examples. Now, to get info on the execution time, we can use the profiler context manager that we looked at above like so -
Output
In the above code, we have used the record_function context manager to label sections of our code with custom user-provided names.
As seen in the output, the PyTorch Profiler allows us to check all the operators that were called during the execution of a code range wrapped within the profiler's context manager. We can understand which operators take the most time as a block of code is executed (most of the time is spent in the convolution operation aten::mkldnn_convolution).
The self CPU time excludes time spent making operator calls to other operators, while the total CPU time includes the child operator calls. We can sort by the self CPU time by passing sort_by= "self_cpu_time_total" while making the table call.
We can also choose to include operator input shapes while obtaining the results by passing group_by_input_shape=True, like so -
In order to measure the execution time when working with a GPU device, the following code changes can be made -
Using Profiler to Analyze Memory Consumption
We can use the PyTorch profiler to get information on the amount of memory utilized by the model's tensors allocated or released as the model's operators get executed.
The following shows an example of using the PyTorch Profiler to measure the memory usages.
Output
::: section {.main}
Using Tracing Functionality
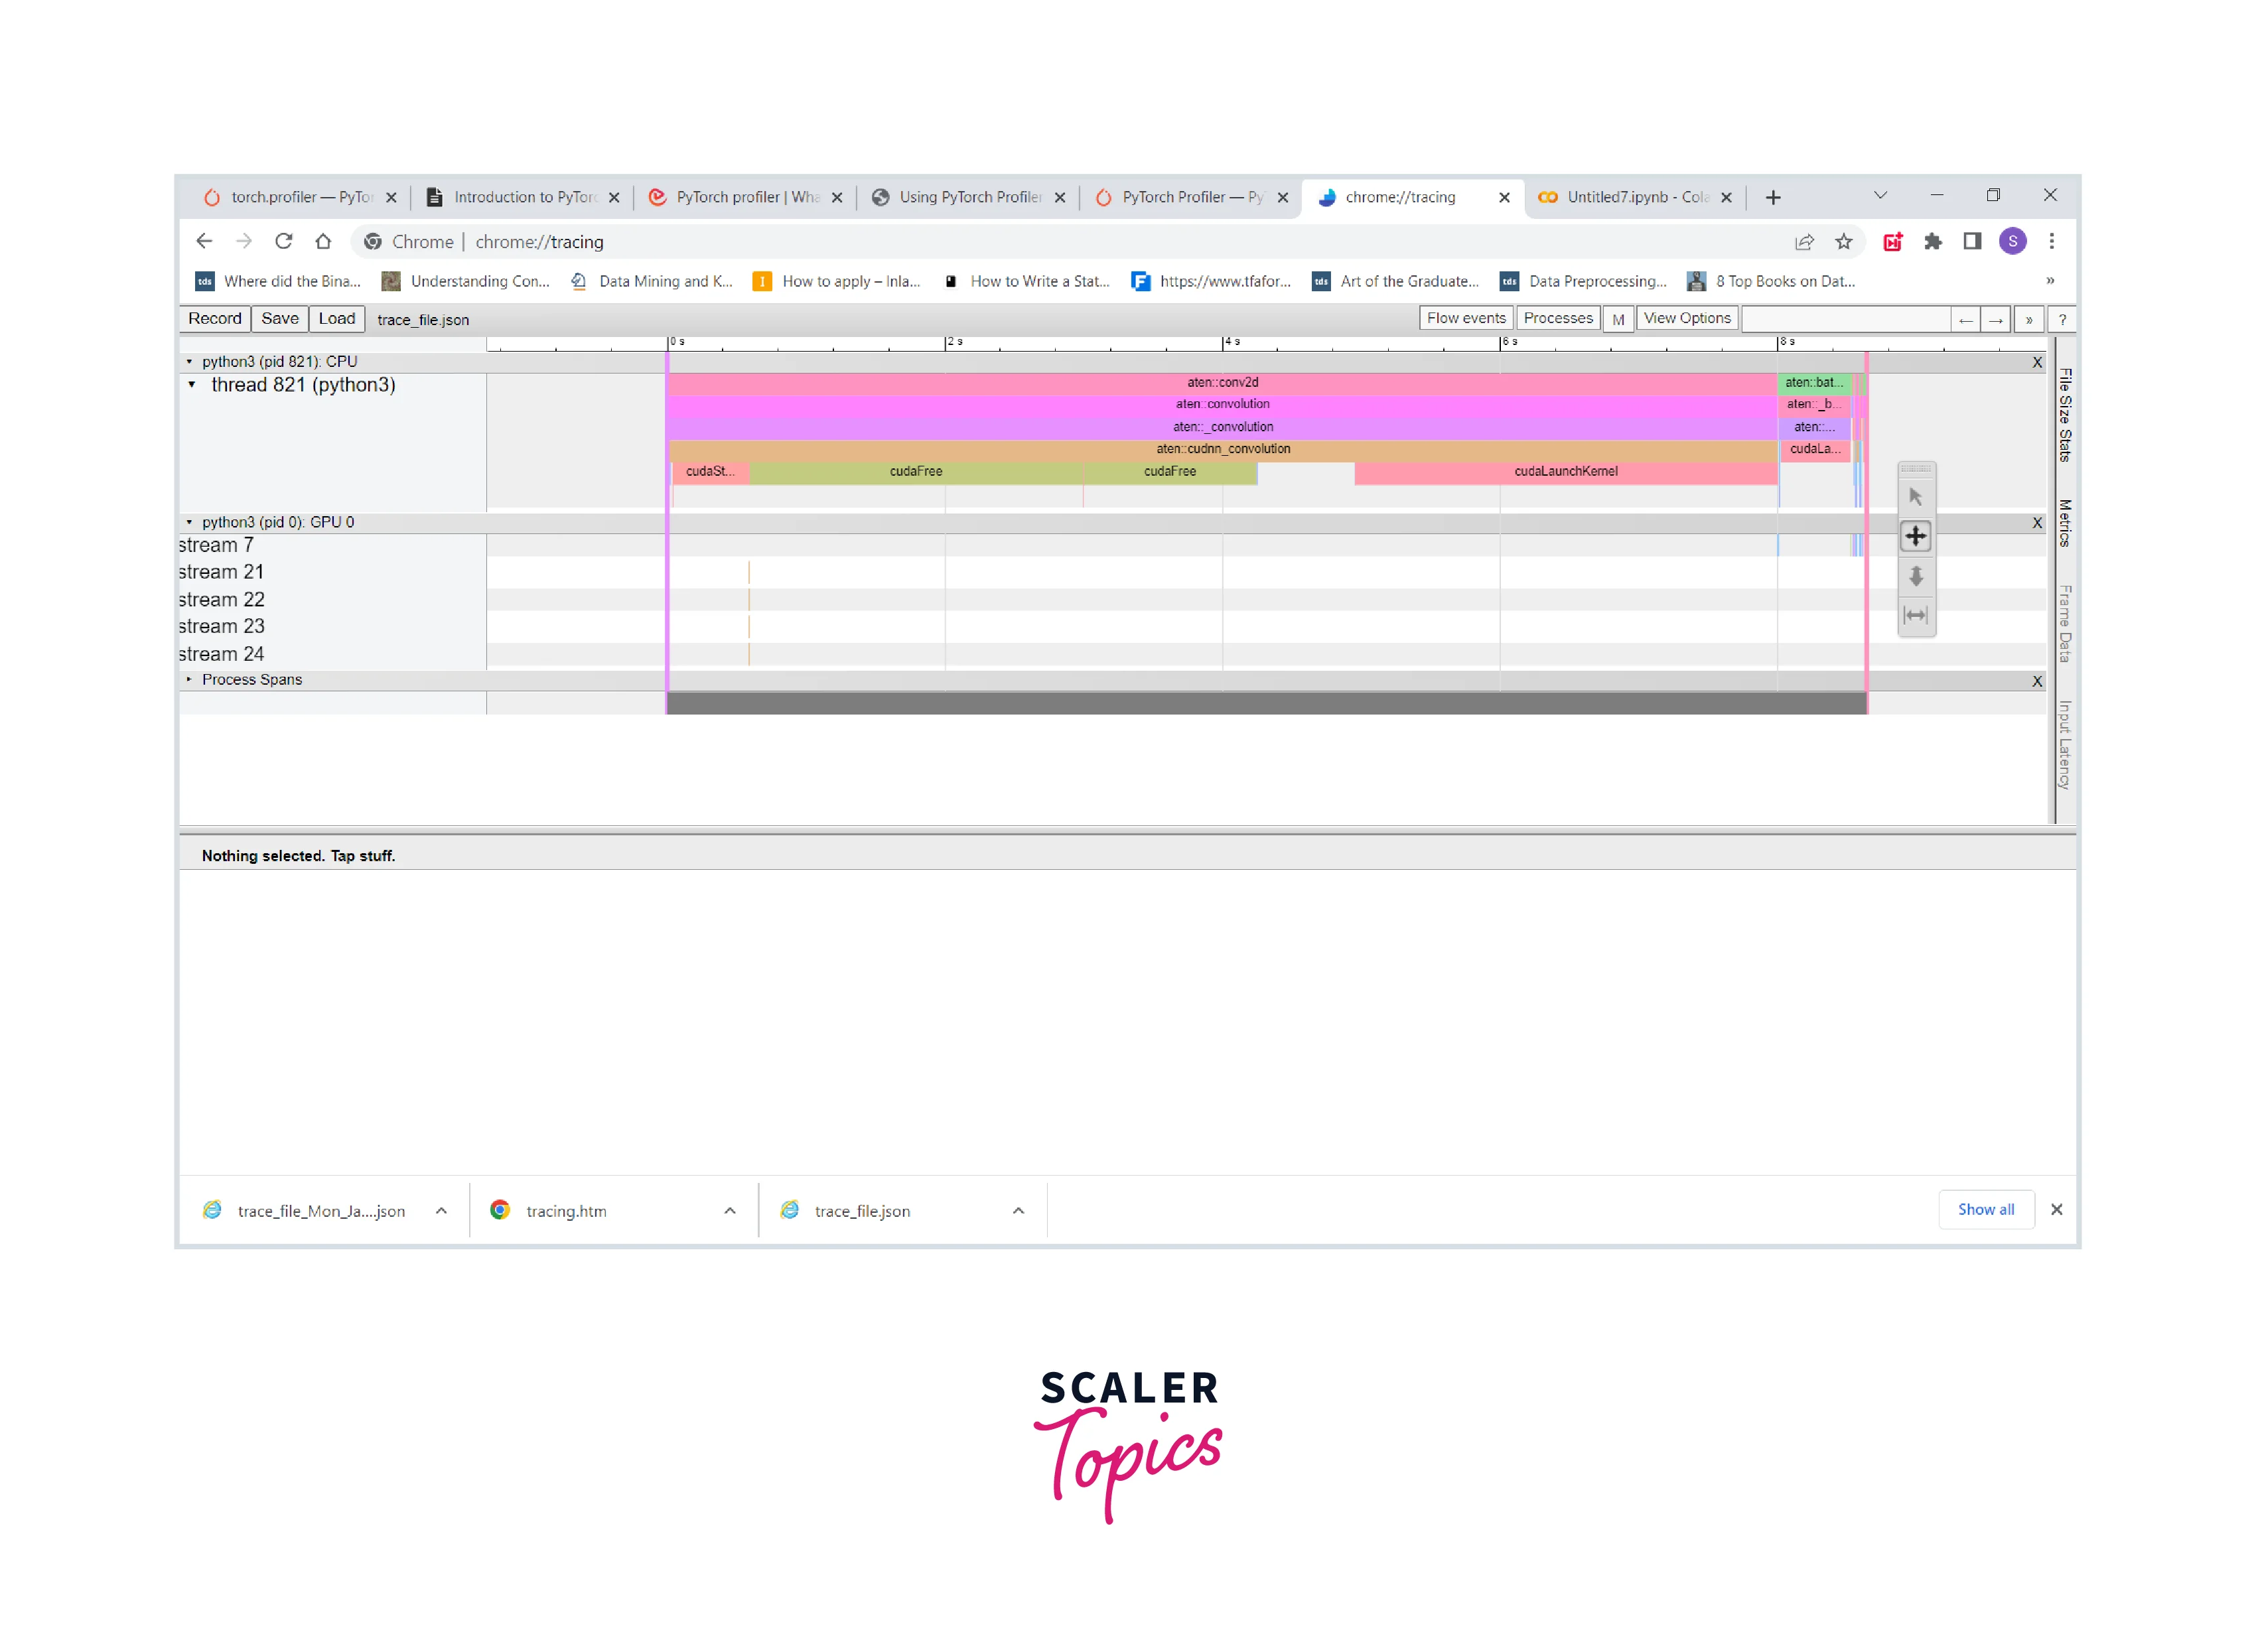
We can use the Chrome trace viewer to examine the sequence of profiled operators and CUDA kernels, like so -
Output
Examining Stack Traces
To examine Python and TorchScript stack traces using the PyTorch Profiler, we can use the following code -
:::
PyTorch Profiler Features
Let us now understand in points the major features offered by the PyTorch Profiler -
- The major purpose of the PyTorch Profiler is to get an accurate and efficient performance analysis of large-scale deep learning models to get an idea of how things will scale in production.
- PyTorch Profiler also automatically detects bottlenecks in the model and then generates recommendations on how to resolve these bottlenecks.
- It can collect GPU level and framework level-related info and correlate them to provide an extensive analysis of the model performance, eliminating the need to combine several tools to analyze model performance.
- The tool leverages the new GPU profiling engine built using the NVIDIA CUPTI APIs to keep a record of the GPU kernel events with high fidelity.
- The PyTorch Profiler can consider several factors during its analysis, like whether to record the input shapes and measure the execution time of CUDA kernels.
- It also allows for measuring the memory consumption used by the model’s tensors allocated during the execution of the model operators.
Conclusion
That was all for this article. Let us review the points that we learned in this article -
- Firstly, we got an introduction to PyTorch Profiler, where we simultaneously looked into its importance and utility in building scalable deep learning models.
- After this, we understood the integration between VS Code and PyTorch Profiler.
- Finally, we used the resent18 model from the torchvision library to demonstrate the various features offered by the PyTorch Profiler context manager with code examples.