R Datasets
Overview
R datasets refer to pre-existing collections of data that are packaged and made available within the R programming language. These datasets cover a wide range of fields, including economics, biology, social sciences, and more. They serve as convenient resources for practising data analysis, statistical modelling, and data visualization techniques. Users can access R Datasets from R's repositories or through dedicated packages.
Most Used In-built Datasets in R
Listed below are the most used datasets to begin with -
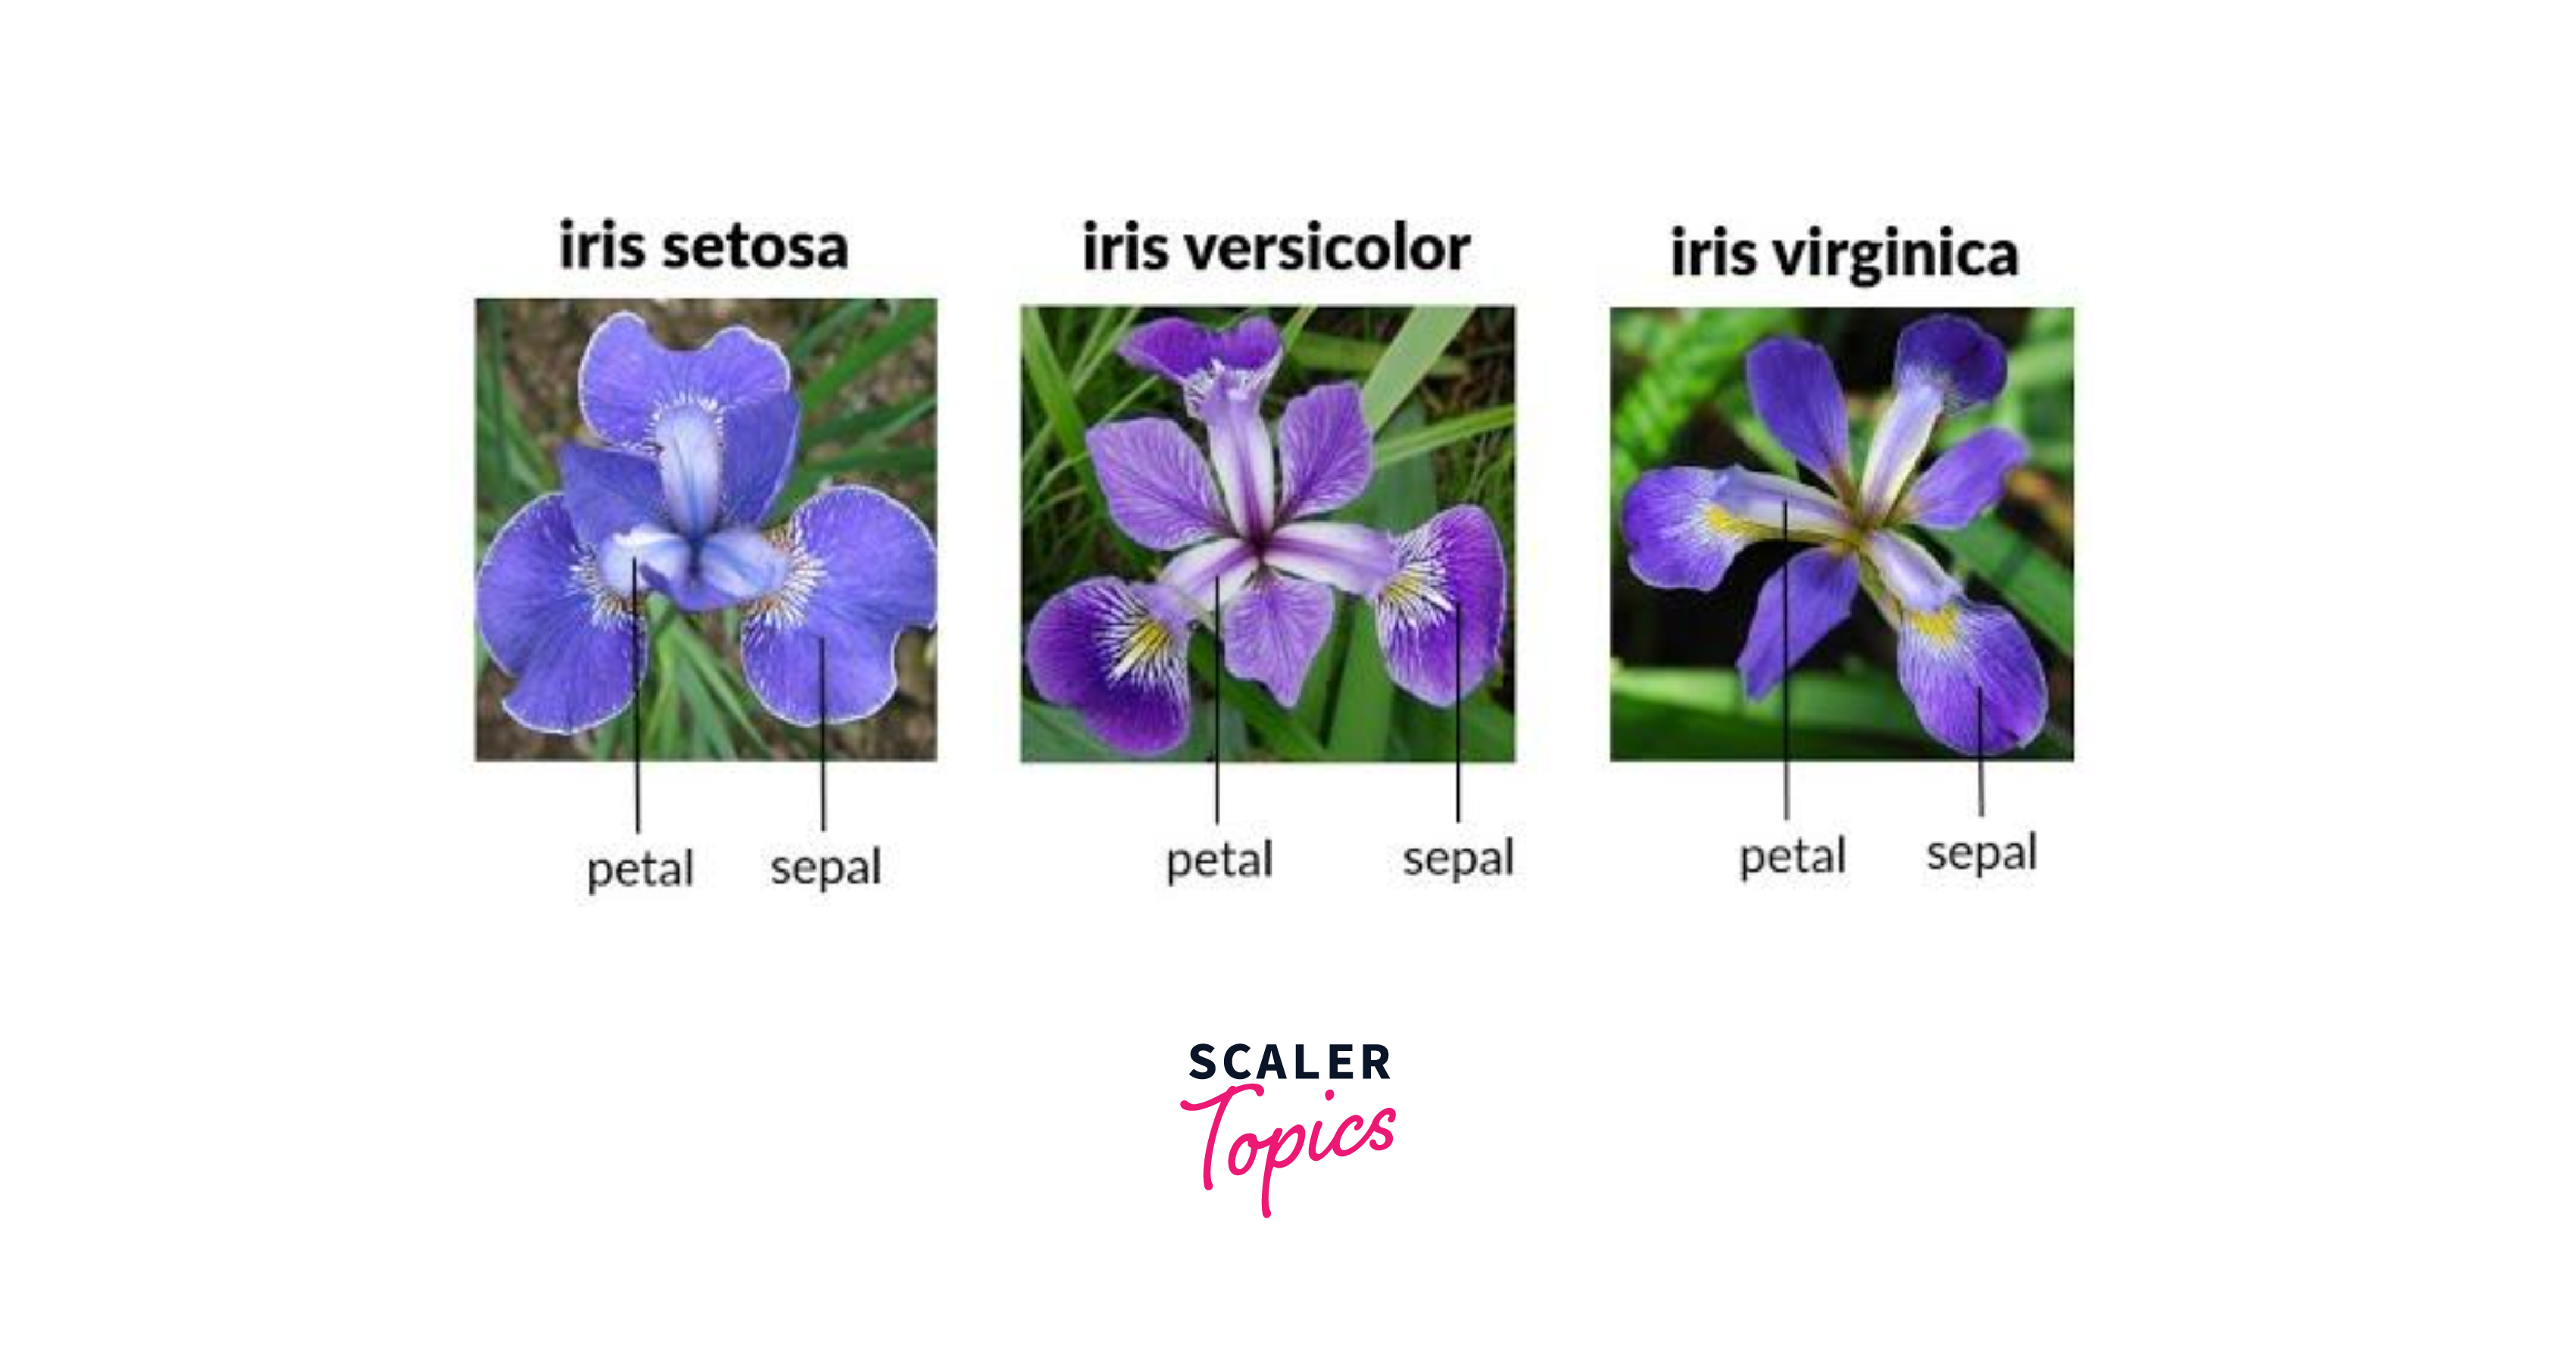
- iris: A dataset containing measurements of iris flowers, including sepal and petal lengths and widths, commonly used for data visualization and classification tasks.

-
mtcars: Data on various car models, including their miles per gallon (mpg), horsepower, and other characteristics, often used for regression and exploratory analysis.
-
airquality: A dataset with daily air quality measurements in New York from May to September, useful for studying air pollution and time series analysis.
-
ChickWeight: Data from an experiment on the effect of diet on the weight of chicks, widely used for longitudinal data analysis and growth modelling.
-
Titanic: A dataset containing information about passengers aboard the Titanic, frequently employed for survival analysis and classification tasks.
Displaying R datasets
Let us consider the airquality dataset as mentioned.
Now, to view this R dataset we can use various methods as listed below -
- View() function: The simplest way to display a dataset is by using the View() function. It opens a graphical user interface (GUI) where you can interactively explore the data in a spreadsheet-like view. Here's how you can use it:
- head() and tail() functions: If you want to quickly see the first few or last few rows of your dataset, you can use the head() and tail() functions, respectively. These functions display a specified number of rows from the beginning or end of the dataset.
Output:
Output:
- print() function: The print() function is used by default to display data frames and tibbles (modern data frame implementation). When you execute the variable name containing your dataset, R will automatically use the print() function to display its content.
Output:
- str() function: If you want to get an overview of the structure of your dataset, including its column names, data types, and a preview of the data, you can use the str() function.
Output:
- summary() function: The summary() function provides a summary of each column in the dataset, including measures like mean, median, minimum, maximum, and quartiles for numeric variables, and frequency tables for categorical variables.
Output:
Techniques used to obtain information about a dataset in R:
Let us consider a dataset as follows, and then look at each of the techniques that we can use,
Output:
Output
- nrow(): Get the number of rows in the dataset.
- ncol(): Get the number of columns in the dataset.
Output
Printing Variable Values in R
In R, you can print the values of variables to the console or output screen using the print() function or simply by typing the name of the variable. Here are two common ways to print variables in R:
- Using print() function:
- Typing the variable name:
Both of these methods will display the value of the variable my_variable (which is 42 in this case) in the console:
You can use either method to print the values of variables or the results of expressions and calculations. R will automatically display the output in the console when you execute the code.
Sorting Variable Values in R
In R, you can sort variables in different ways, depending on the data type and your specific requirements. Here are some common ways to sort variables in R:
- Sorting Numeric/Character Vectors: For numeric or character vectors, you can use the sort() function to sort the elements in ascending order.
You can use sort() with the decreasing = TRUE argument to sort in descending order.
- Sorting Data Frames by a Specific Column: If you have a data frame and want to sort it based on the values in a specific column, you can use the order() function to get the sorted row indices and then use those indices to reorder the rows of the data frame.
- Sorting Lists: For lists containing elements of various types, you can use the order() function as well.
Conclusion
-
R Datasets and Their Importance: R datasets provide pre-existing collections of data across various fields, enabling practitioners to develop and refine data analysis, statistical modelling, and data visualization skills.
-
Commonly Used In-Built Datasets: Several widely used in-built datasets in R include "iris" for classification tasks, "mtcars" for regression and analysis, "airquality" for time series studies, "ChickWeight" for longitudinal analysis, and "Titanic" for survival analysis.
-
Displaying R Datasets: There are various methods to display R datasets. The "View()" function opens a GUI to interactively explore data. The "head()" and "tail()" functions provide quick previews of the first or last rows. Using "print()" displays the dataset by default. The "str()" function offers a summary of the dataset's structure, while "summary()" provides summary statistics for each column.
-
Printing and Sorting Variable Values: Printing variable values can be done using the "print()" function or by typing the variable name, allowing you to inspect and verify data during analysis. Sorting variables involves using the "sort()" function for numeric and character vectors, "order()" for data frames, and the same functions for sorting lists. Sorting helps organize data for analysis and presentation.
In conclusion, R datasets play a crucial role in practical data analysis, offering a range of datasets for learning and experimentation. Displaying, summarizing, printing, and sorting variable values are fundamental techniques in R that aid in exploring and understanding data.