Using React Chart.Js to Create Charts in React
Overview
Chart.js is a JavaScript library used to create charts and graphs in React. These charts and graphs can be used to display on websites.
React ChartJs makes the creation of charts simple for users. We can create various charts like bar graphs, line graphs, and pie charts. It is open-source and maintained by an active community.
Transform Your Career
Choose from our industry-leading programs designed for career success
Modern Software and AI Engineering Program
Master full-stack development with AI integration

Modern Data Science and ML with specialisation in AI
Advanced data science techniques with AI specialization
Advanced AIML with Specialisation in Agentic AI
Deep dive into AIML with focus on Agentic systems
DevOps, Cloud & AI Platform Engineering
Build and manage AI-powered cloud infrastructure
AI Engineering Advanced Certification by IIT-Roorkee
Premier AI engineering certification from IIT-Roorkee
Prerequisites
To understand the ChartJs React library, you will need to have a basic understanding of React. For starting with the same, React's documentation is a good place.
What is React Chart.Js?
As front-end developers, we often need to add elements that can help the users to visualize the data. Data visualization is a very important element of any website that can help the users to visualize the data and comprehend it easily. By using React Chart.js, it can be made possible to use charts.
React Chart.js is a JavaScript library used to create charts and graphs in React. These charts and graphs can be used to display on websites. React ChartJs makes the creation of charts simple for users.
It is well-suited for large datasets. Also, the rendering of the chart elements is done on an HTML5 canvas. The following charts can be made using the Chart.js library:
- Bar graphs
- Line graphs
- Pie charts
How to Install React Chart.Js?
If you are working on a code editor or IDE, first create a new React app. In that app's terminal, install the React ChartJs library. You can do it as follows-
Here, chart.js is a library, and react-chartjs-2is a wrapper for Chart.js 2.0 and Chart.js 3.0, which lets us use ChartJs elements as React components.


Components of React Chart Js
The main component of this package is data and options which are shown in the example.
In the above code, data is an object. There are various properties inside the data object.
Scaler Placement Report and Statistics
Scaler learners achieved 2.5x salary growth with average post-Scaler CTC reaching ₹23L.
Creating Charts Using React Chart Js
a. Pie Chart
We will create a Pie Chart using React ChartJs.
Code:
Output:
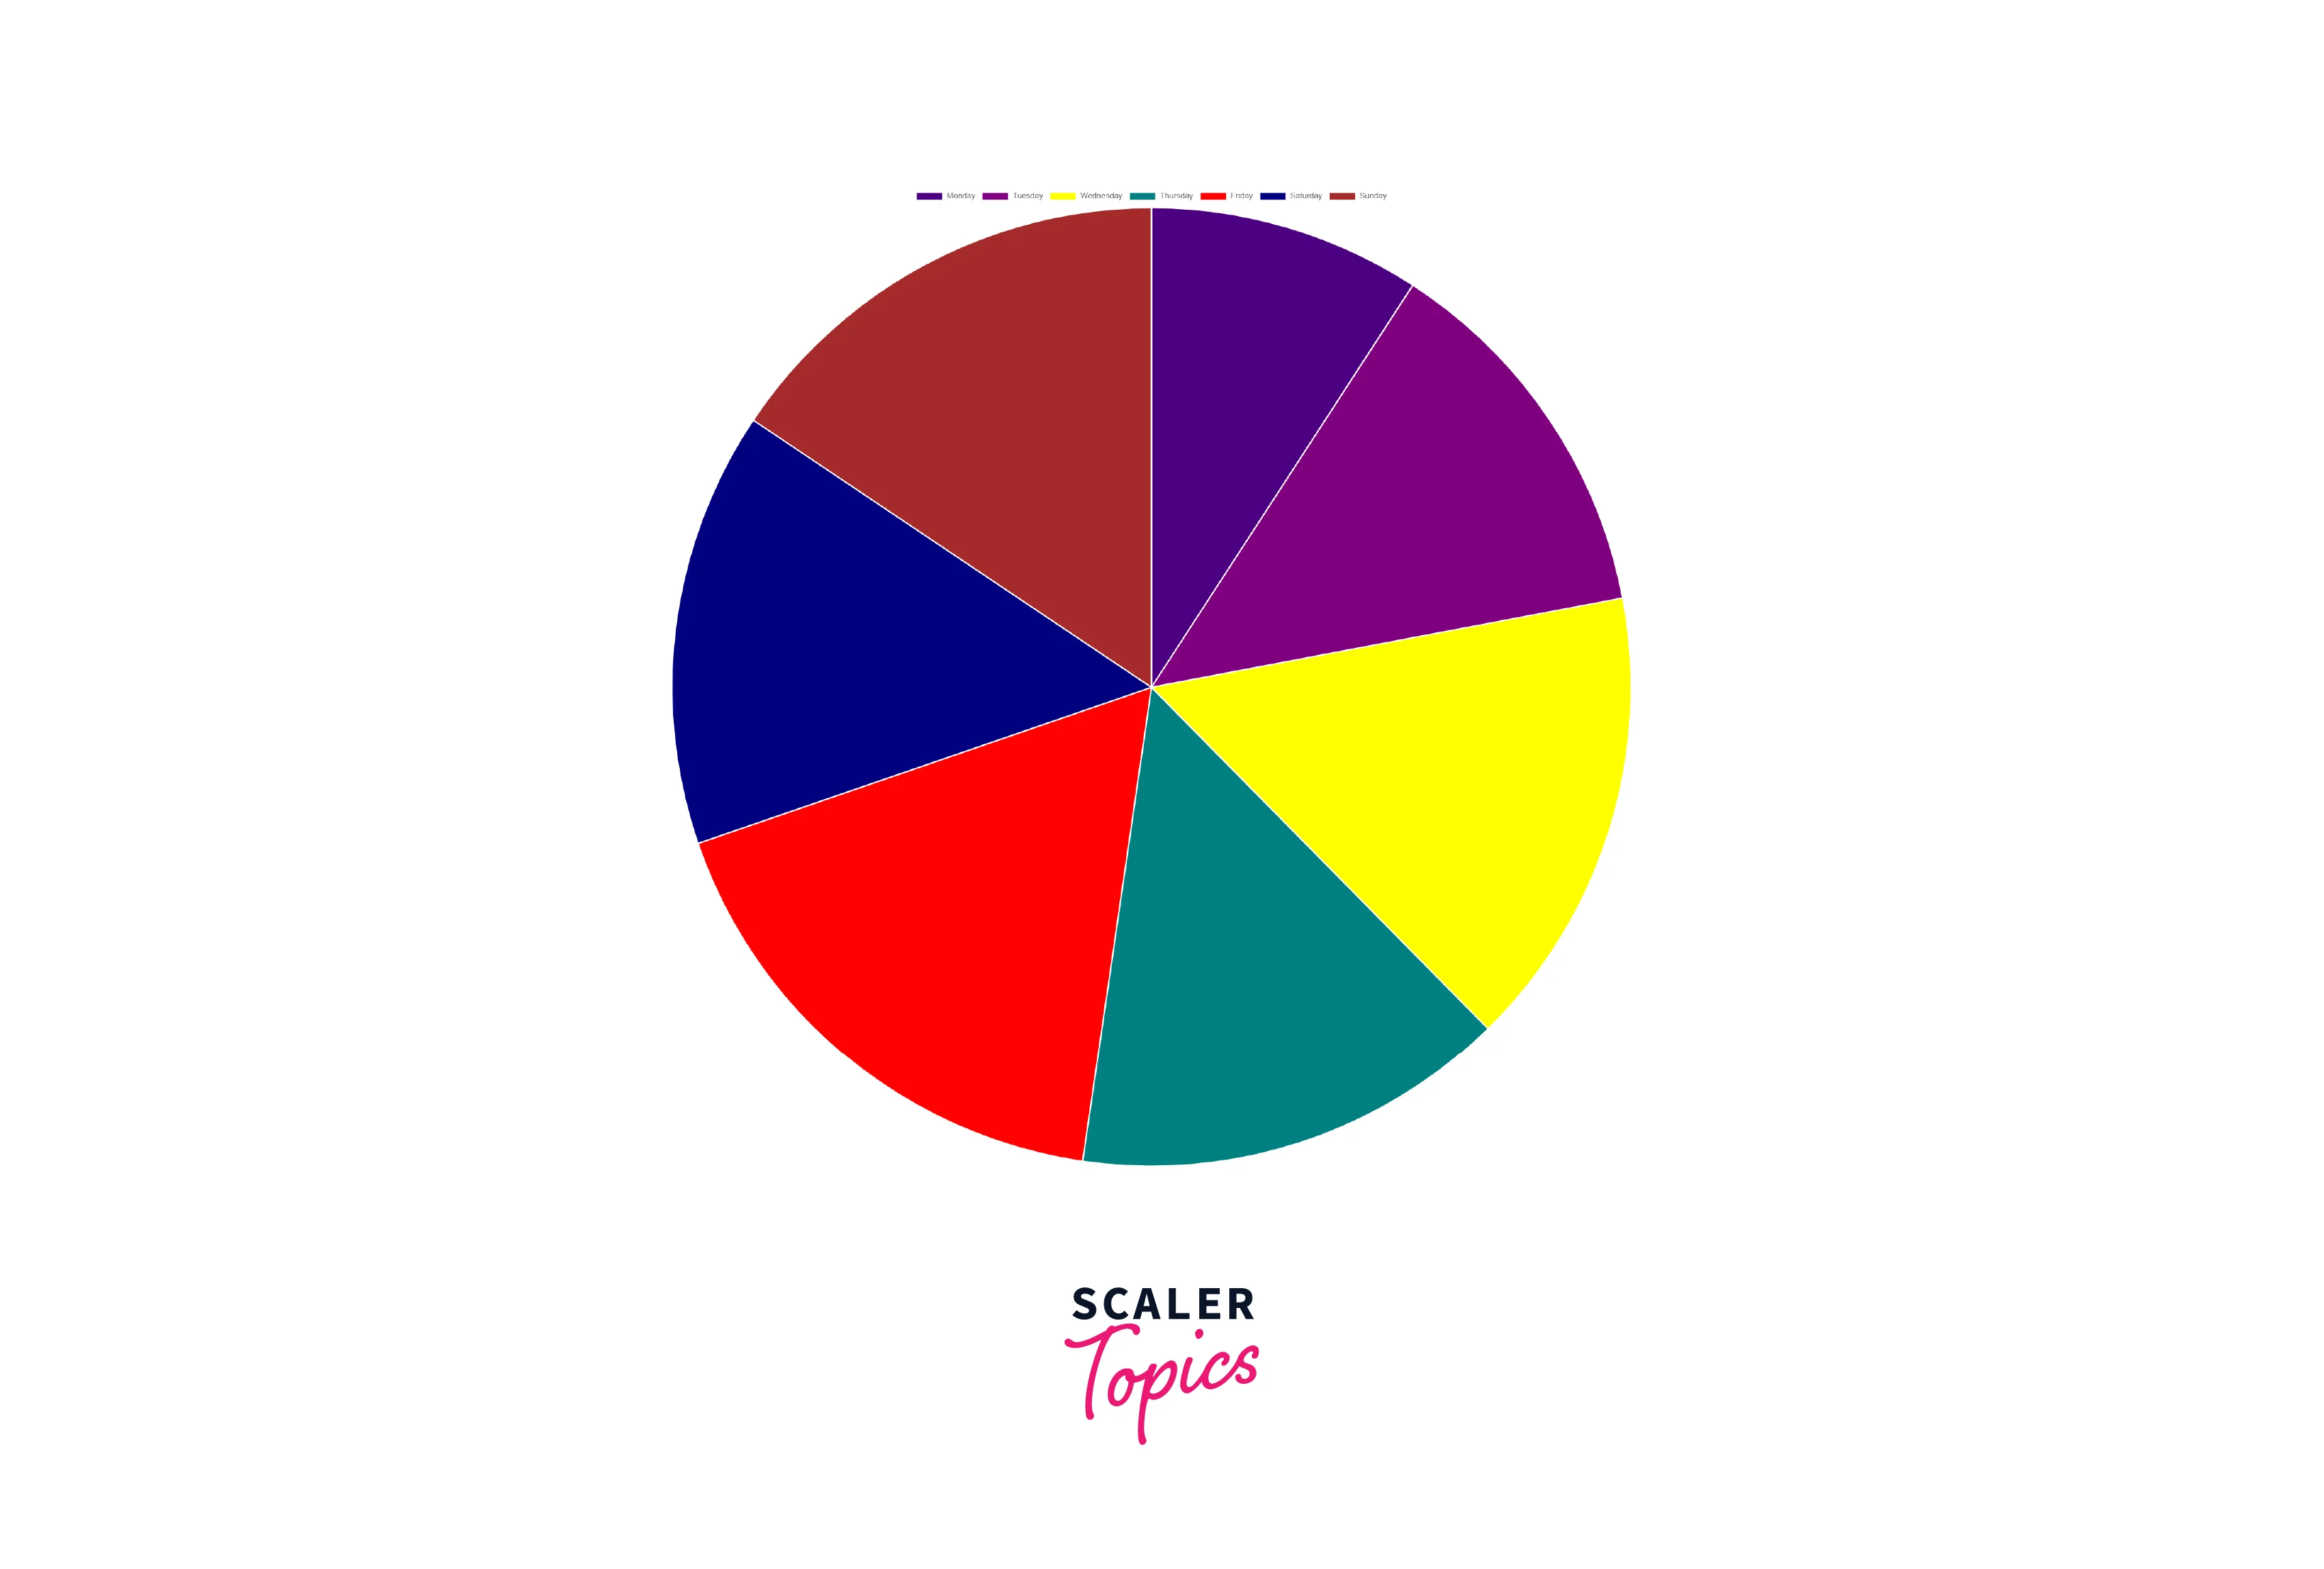
Explanation:
In the above code, a Pie Chart is created. First, we have declared states, which contain the information about the label, color of the bar, background color, and data. The above information is rendered in the Bar component along with additional information like display and position.
Turn Learning into Career Growth
b. Bar Chart
Let us create a bar chart using React ChartJs.
Code:
Output:
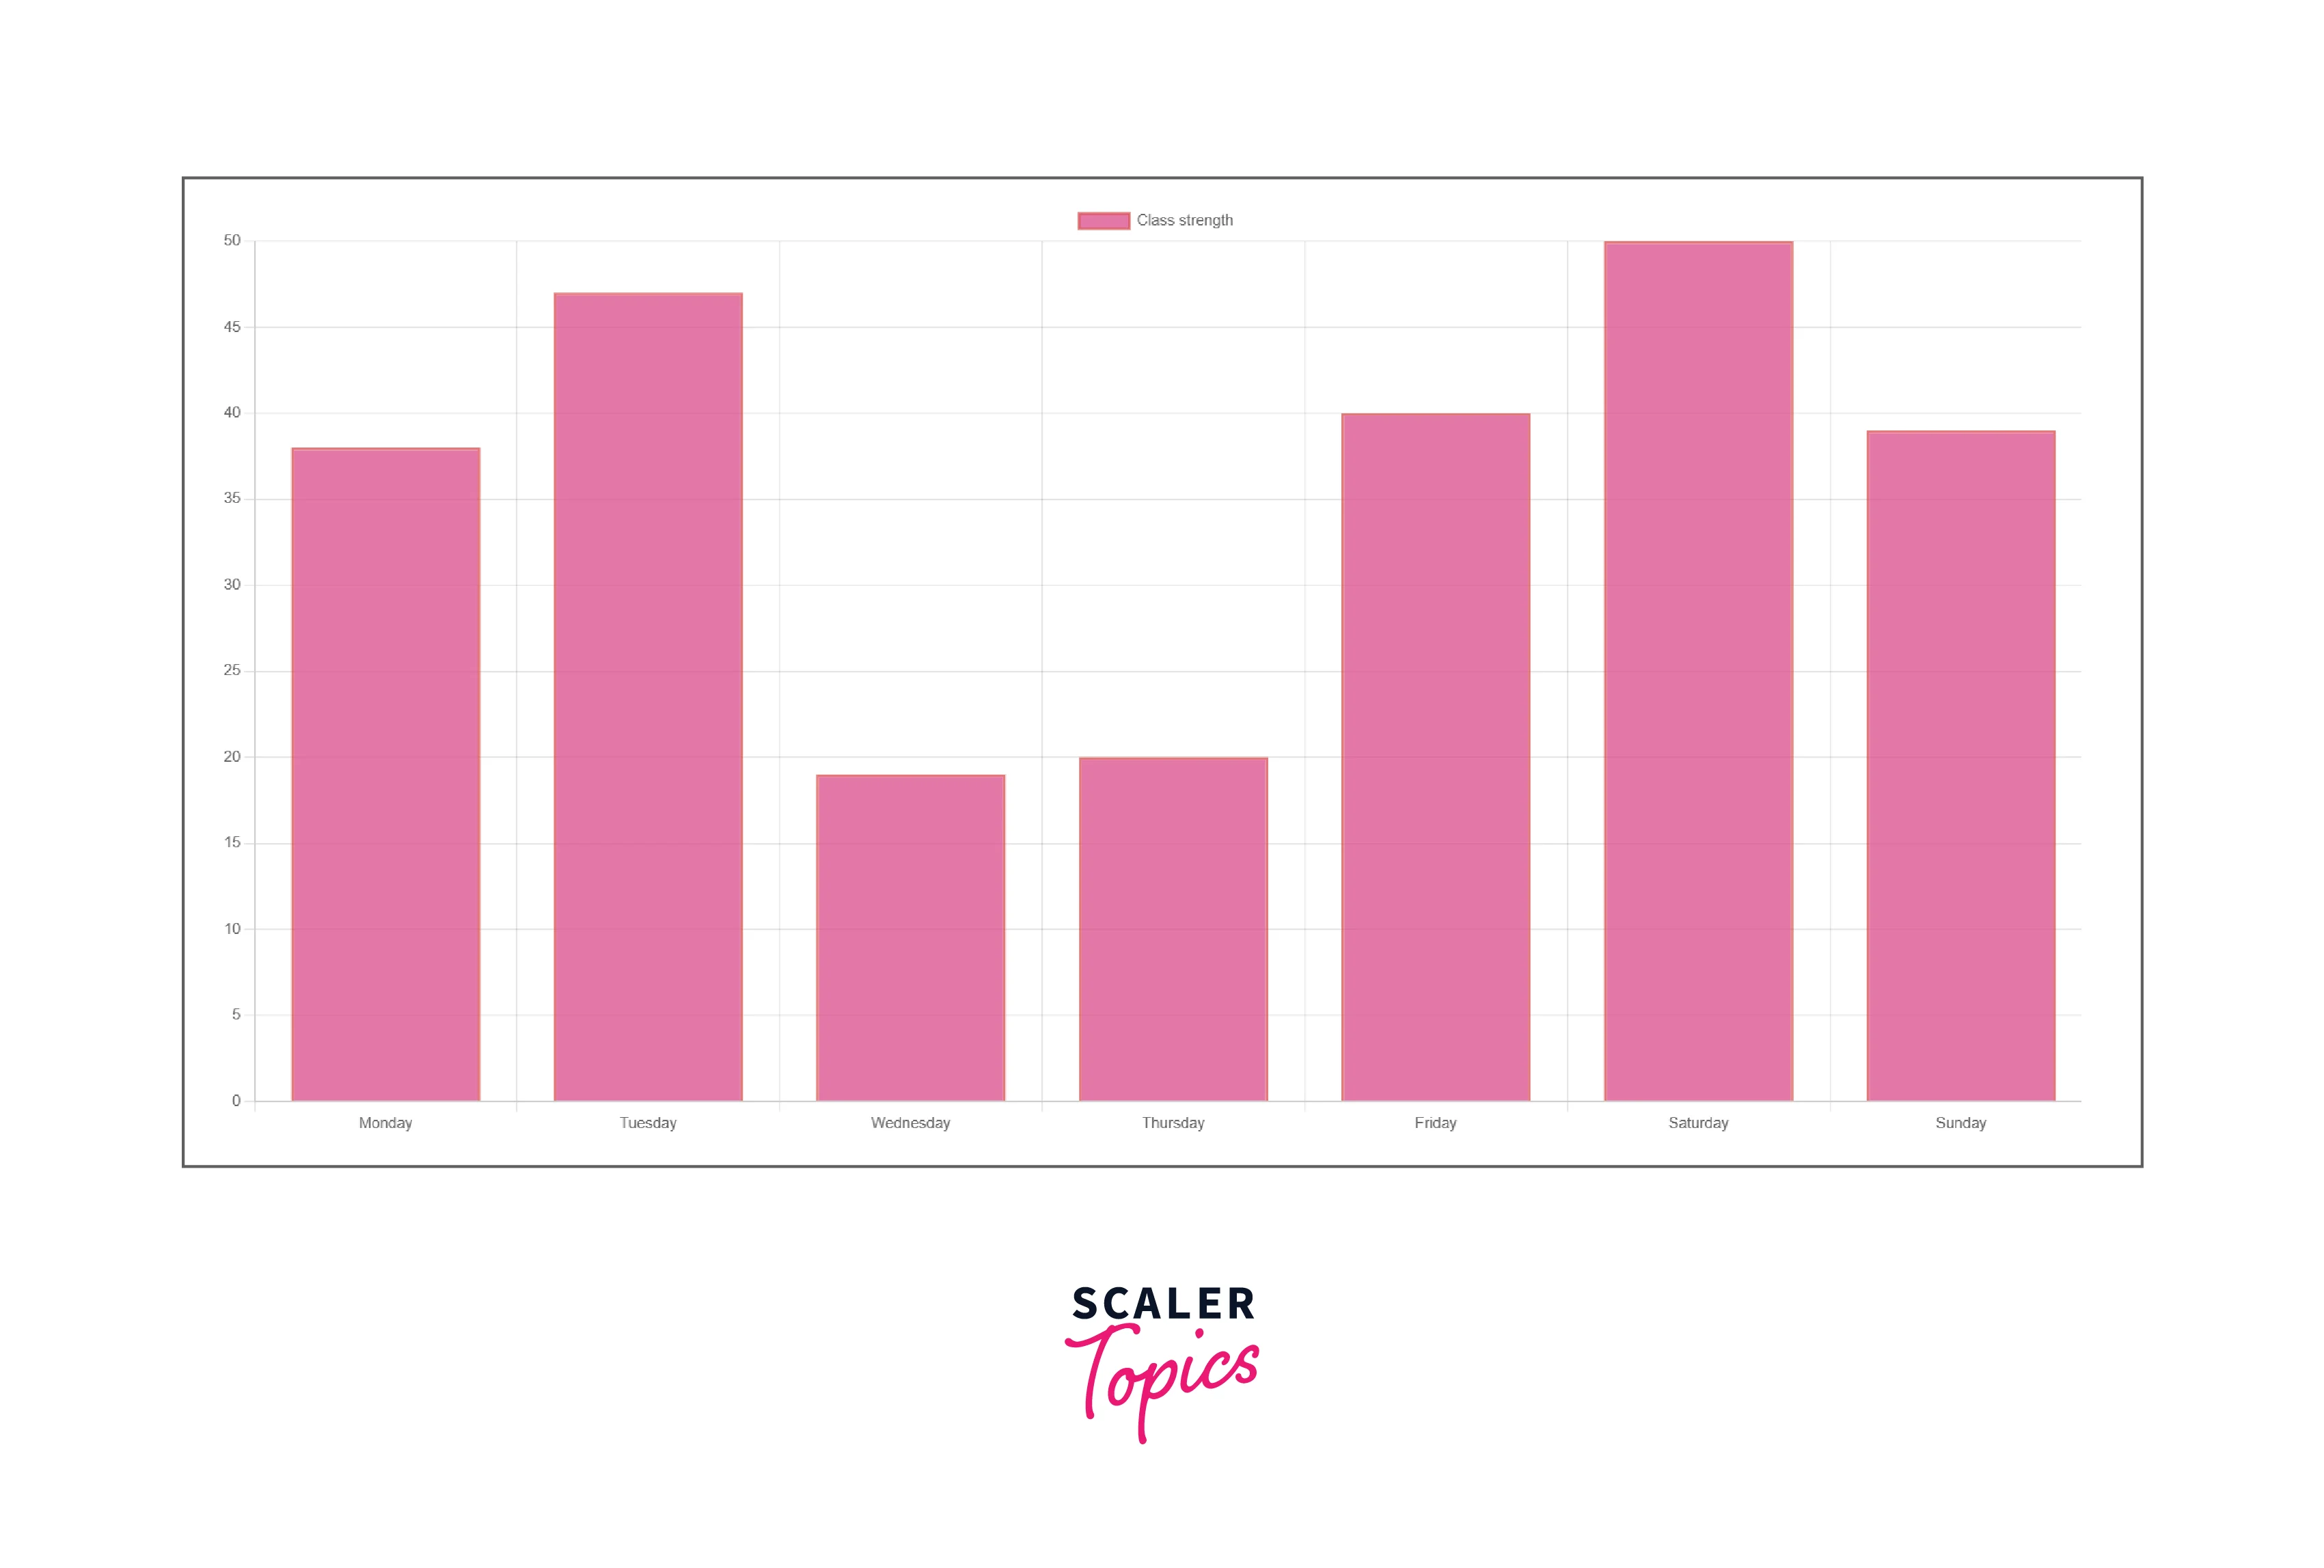
Explanation:
In the above code, a bar graph is created. First, we have declared states, which contain the information about the label, color of the bar, background colour, and data. The above information is rendered in the Bar component along with additional information like display and position.
c. Line Chart
Let us create a line chart using React ChartJs.
Code:
Output:

Explanation:
In the above code, a Line graph is created. First, we have declared states, which contain the information about the label, colour of the bar, background colour, and data. Additional information like the line width, line-colour, and border-width is declared. The above information is rendered in the Bar component along with additional information like display and position.
Advantages of React ChartJs
- Chartjs uses the Canvas element which results in a better performance as compared to SVG.
- It is better to use chartjs while rendering large data as it has a better performance.
- It is easy to download the chart as an image when React chartjs is used.
- Less effort is required to create charts.
Disadvantages of React ChartJs
- Lesser customization options.
- Only pertained to standard charts. If more types of charts are required, D3.js is a better option to choose.
- As the charts are Canvas based, they are non-interactive. It can also not be modified.
Conclusion
- Chart.js is a JavaScript library used to create charts and graphs in React. These charts and graphs can be used to display on websites.
- It is well-suited for large datasets. Also, the rendering of the chart elements is done on an HTML5 canvas.
- We can create various charts like bar graphs, line graphs, and pie charts.
- The libraries like- chart.js and react-chartjs-2 are necessary to be installed in our system.
- Chartjs uses the Canvas element which results in a better performance as compared to SVG.
- Disadvantages of React ChartJs are that it has lesser customization options and is only pertained to standard charts.