Debugging React Applications with React DevTools
Overview
One of the most useful abilities a developer can have is debugging. It enables us to navigate correctly and identify coding issues quickly and effectively. This is made possible on the current web by utilizing several tools and strategies.
React is a most popular front-end framework and it eases the pain of developing complex and interactive user interfaces. It contains a collection of debugging tools called React dev tools, just like other frameworks.
Introduction
One of the things that make React amazing is that the applications made with React are developed and scale quickly, this introduces small problems in the form of bugs in code unknowingly. The React DevTools can help us to tackle these bugs by allowing us to get an inside view of the current state of each React component.
In React terms, we can have many different kinds of bugs:
- User interface bugs
- Problems with the look and feel of the app.
- Logic bugs
- Problem with the behavior of the app.
- Networking bugs
- Problem with the behavior of a third-party API.
- Regressions
- Something that was no problem in the past but it is now a problem
We will be learning about React DevTools and once you get the basic idea of DevTools then you will be easily able to solve these bugs.
Prerequisites
There are some prerequisites before you begin solving bugs in react applications
- Access to a web browser that supports the `React DevTools extension.
- Node.js to develop a React application.
- A working react app. (can be Create React App or another boilerplate)
- Familiarity with React's functional components
What is React DevTools and How does it Work?
React Development tools or React DevTools is a browser extension available for Chrome and Firefox. It is a standalone app that allows us to inspect the hierarchy of React components. It also has several tools that are specific to the reaction which helps in better code inspection. This extension displays all the react components and subcomponents that are being rendered on the page.
Installation
Since React DevTools is a browser extension, the simplest way is to install React DevTools through the Chrome web store or Firefox web store.
Otherwise, you can also install it as a global npm package with the following command
After the installation is completed, open the browser developer tools, there you will see two new tabs namely Components and Profiler. These tabs appear only if the webpage you are visiting is made with React
Components Tab
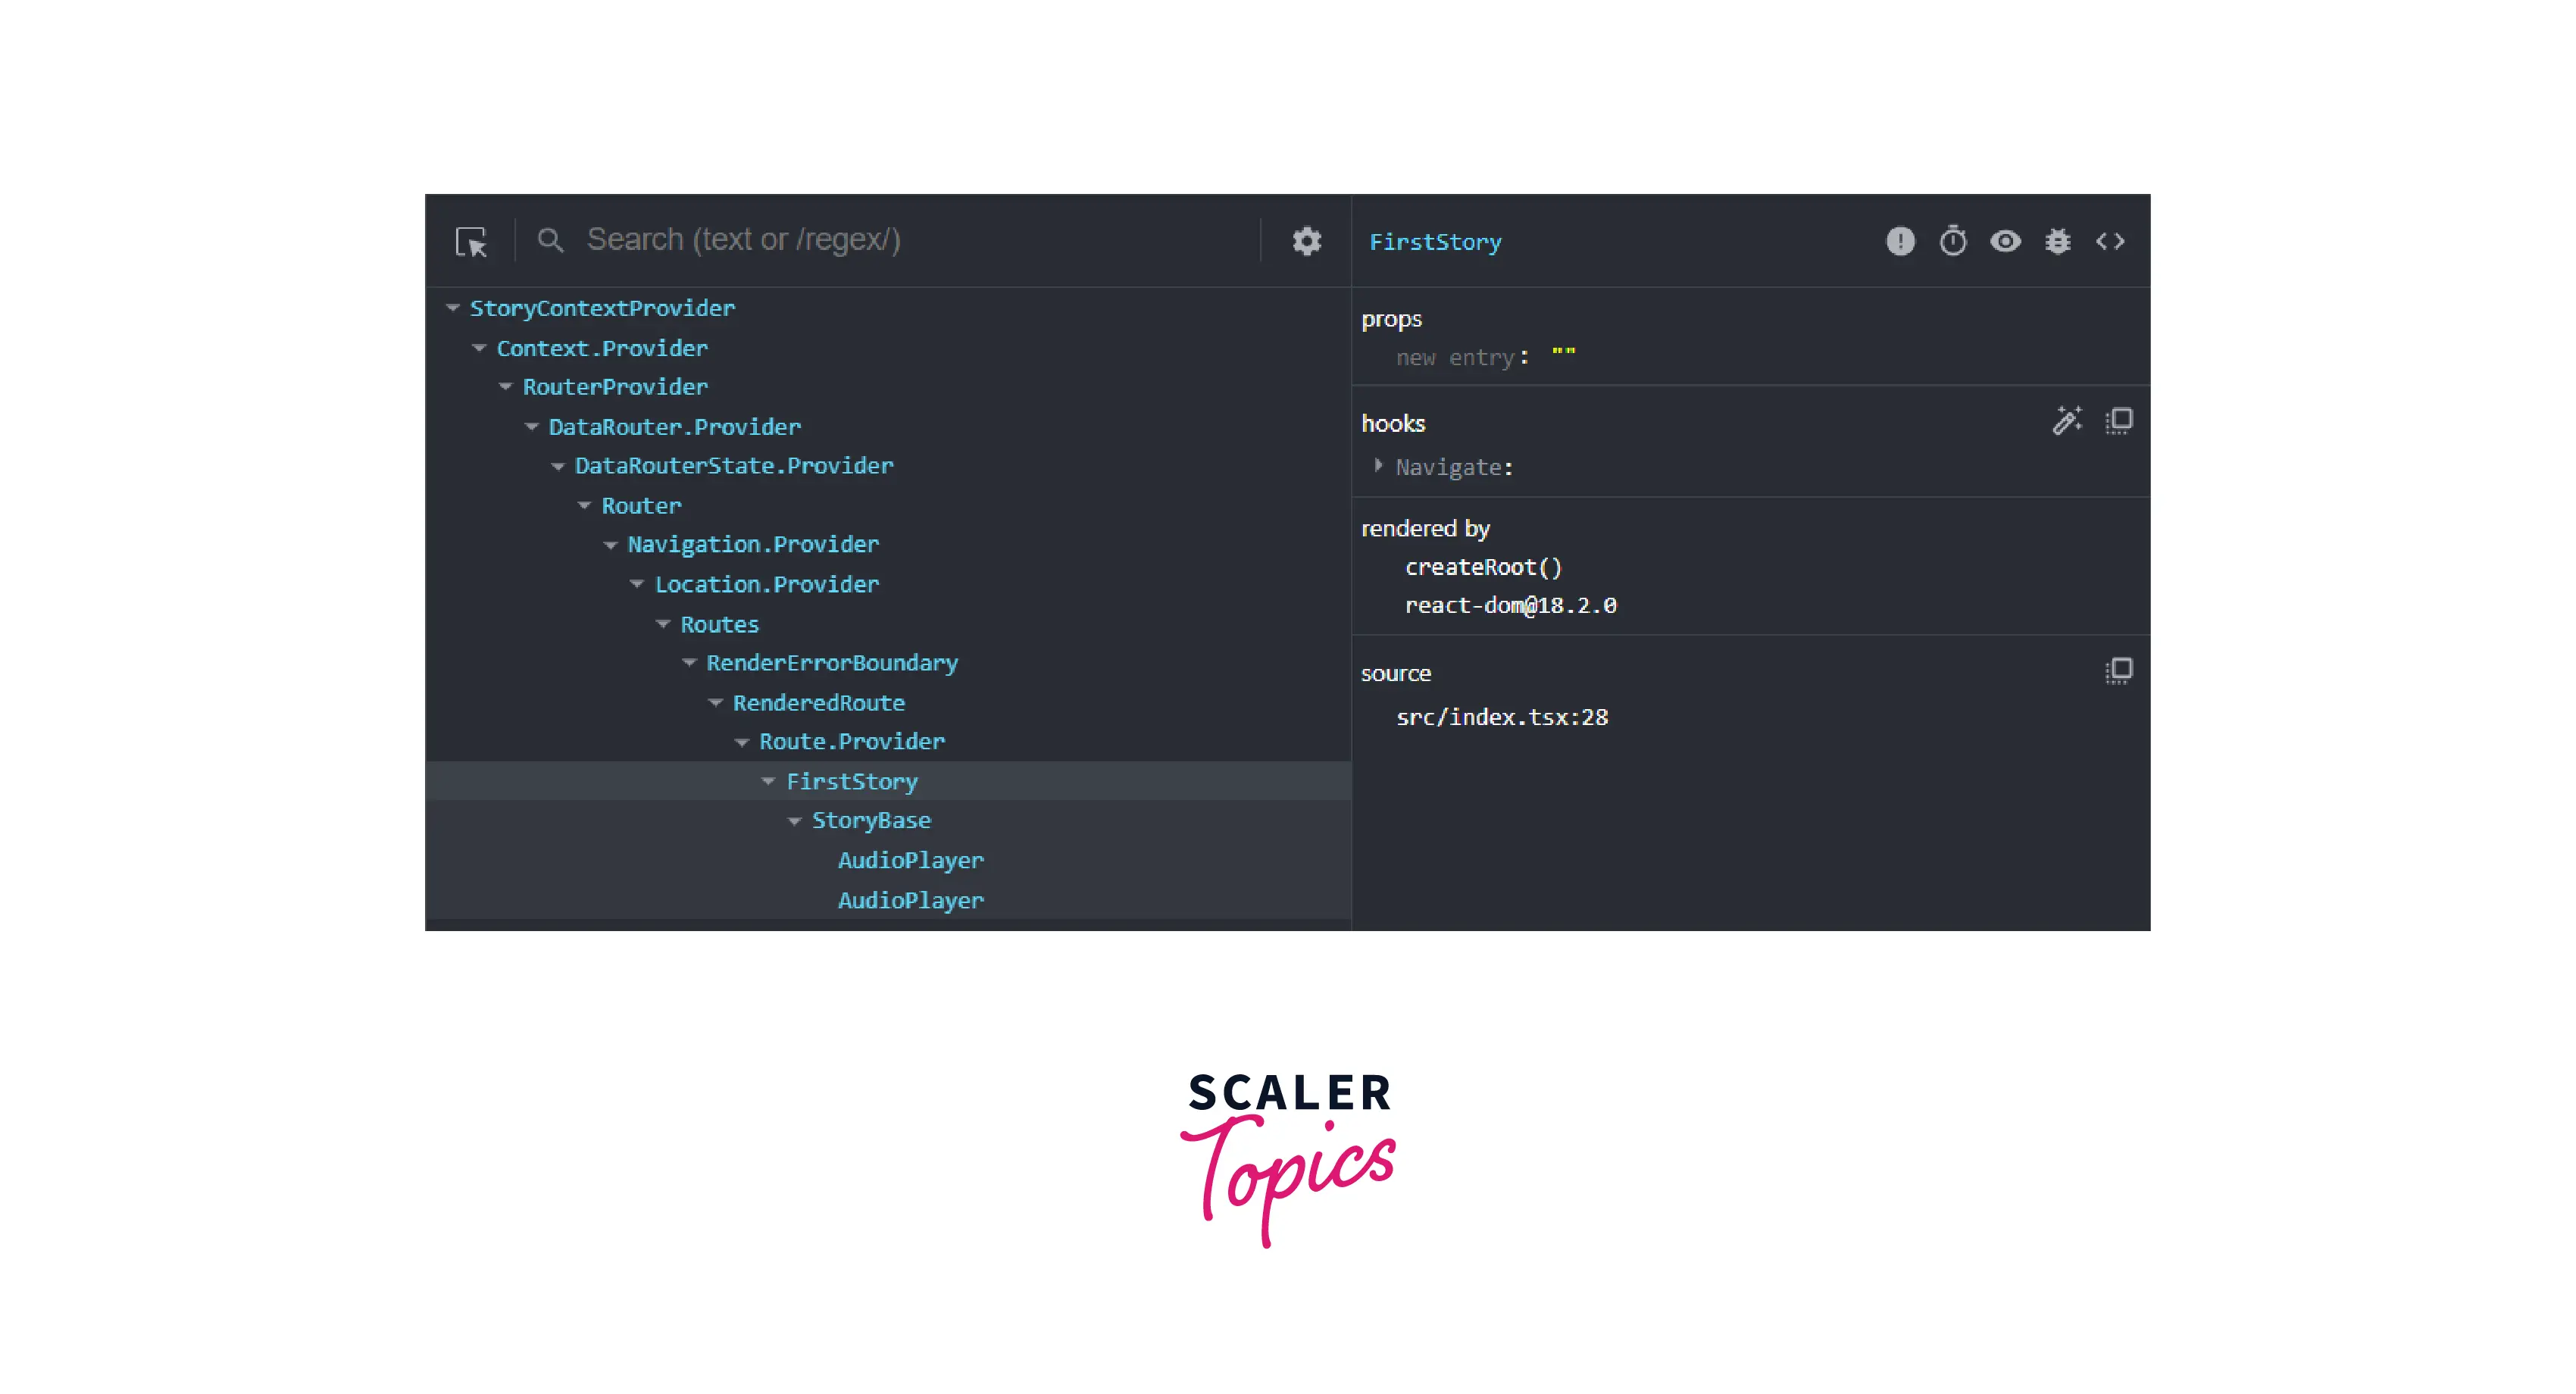
The components tab shows us the component structure of the website we are analyzing. This tab is divided into two panes.
- The left pane This page shows the component structure of the website we are on.
- The right pane The right pane shows the props, hooks, and state of the component that you select along with the list of ancestors that ended up rendering the selected component.
This is a super useful tool because along with showing all the necessary information it also allows us to modify it, this modification is extremely useful for debugging.

DevTools Adjusts Nested Indentation Dynamically
Deeply nested components required both vertical and horizontal scrolling in a previous version of React DevTools, making it difficult to follow large component trees. Nested indentation is now automatically adjusted in DevTools to prevent horizontal scrolling.
Restore the Last Element Selected
When debugging, hitting Reload causes DevTools to return the last selected element to its initial state, this removes the effort of manually selecting the element every time
Functions
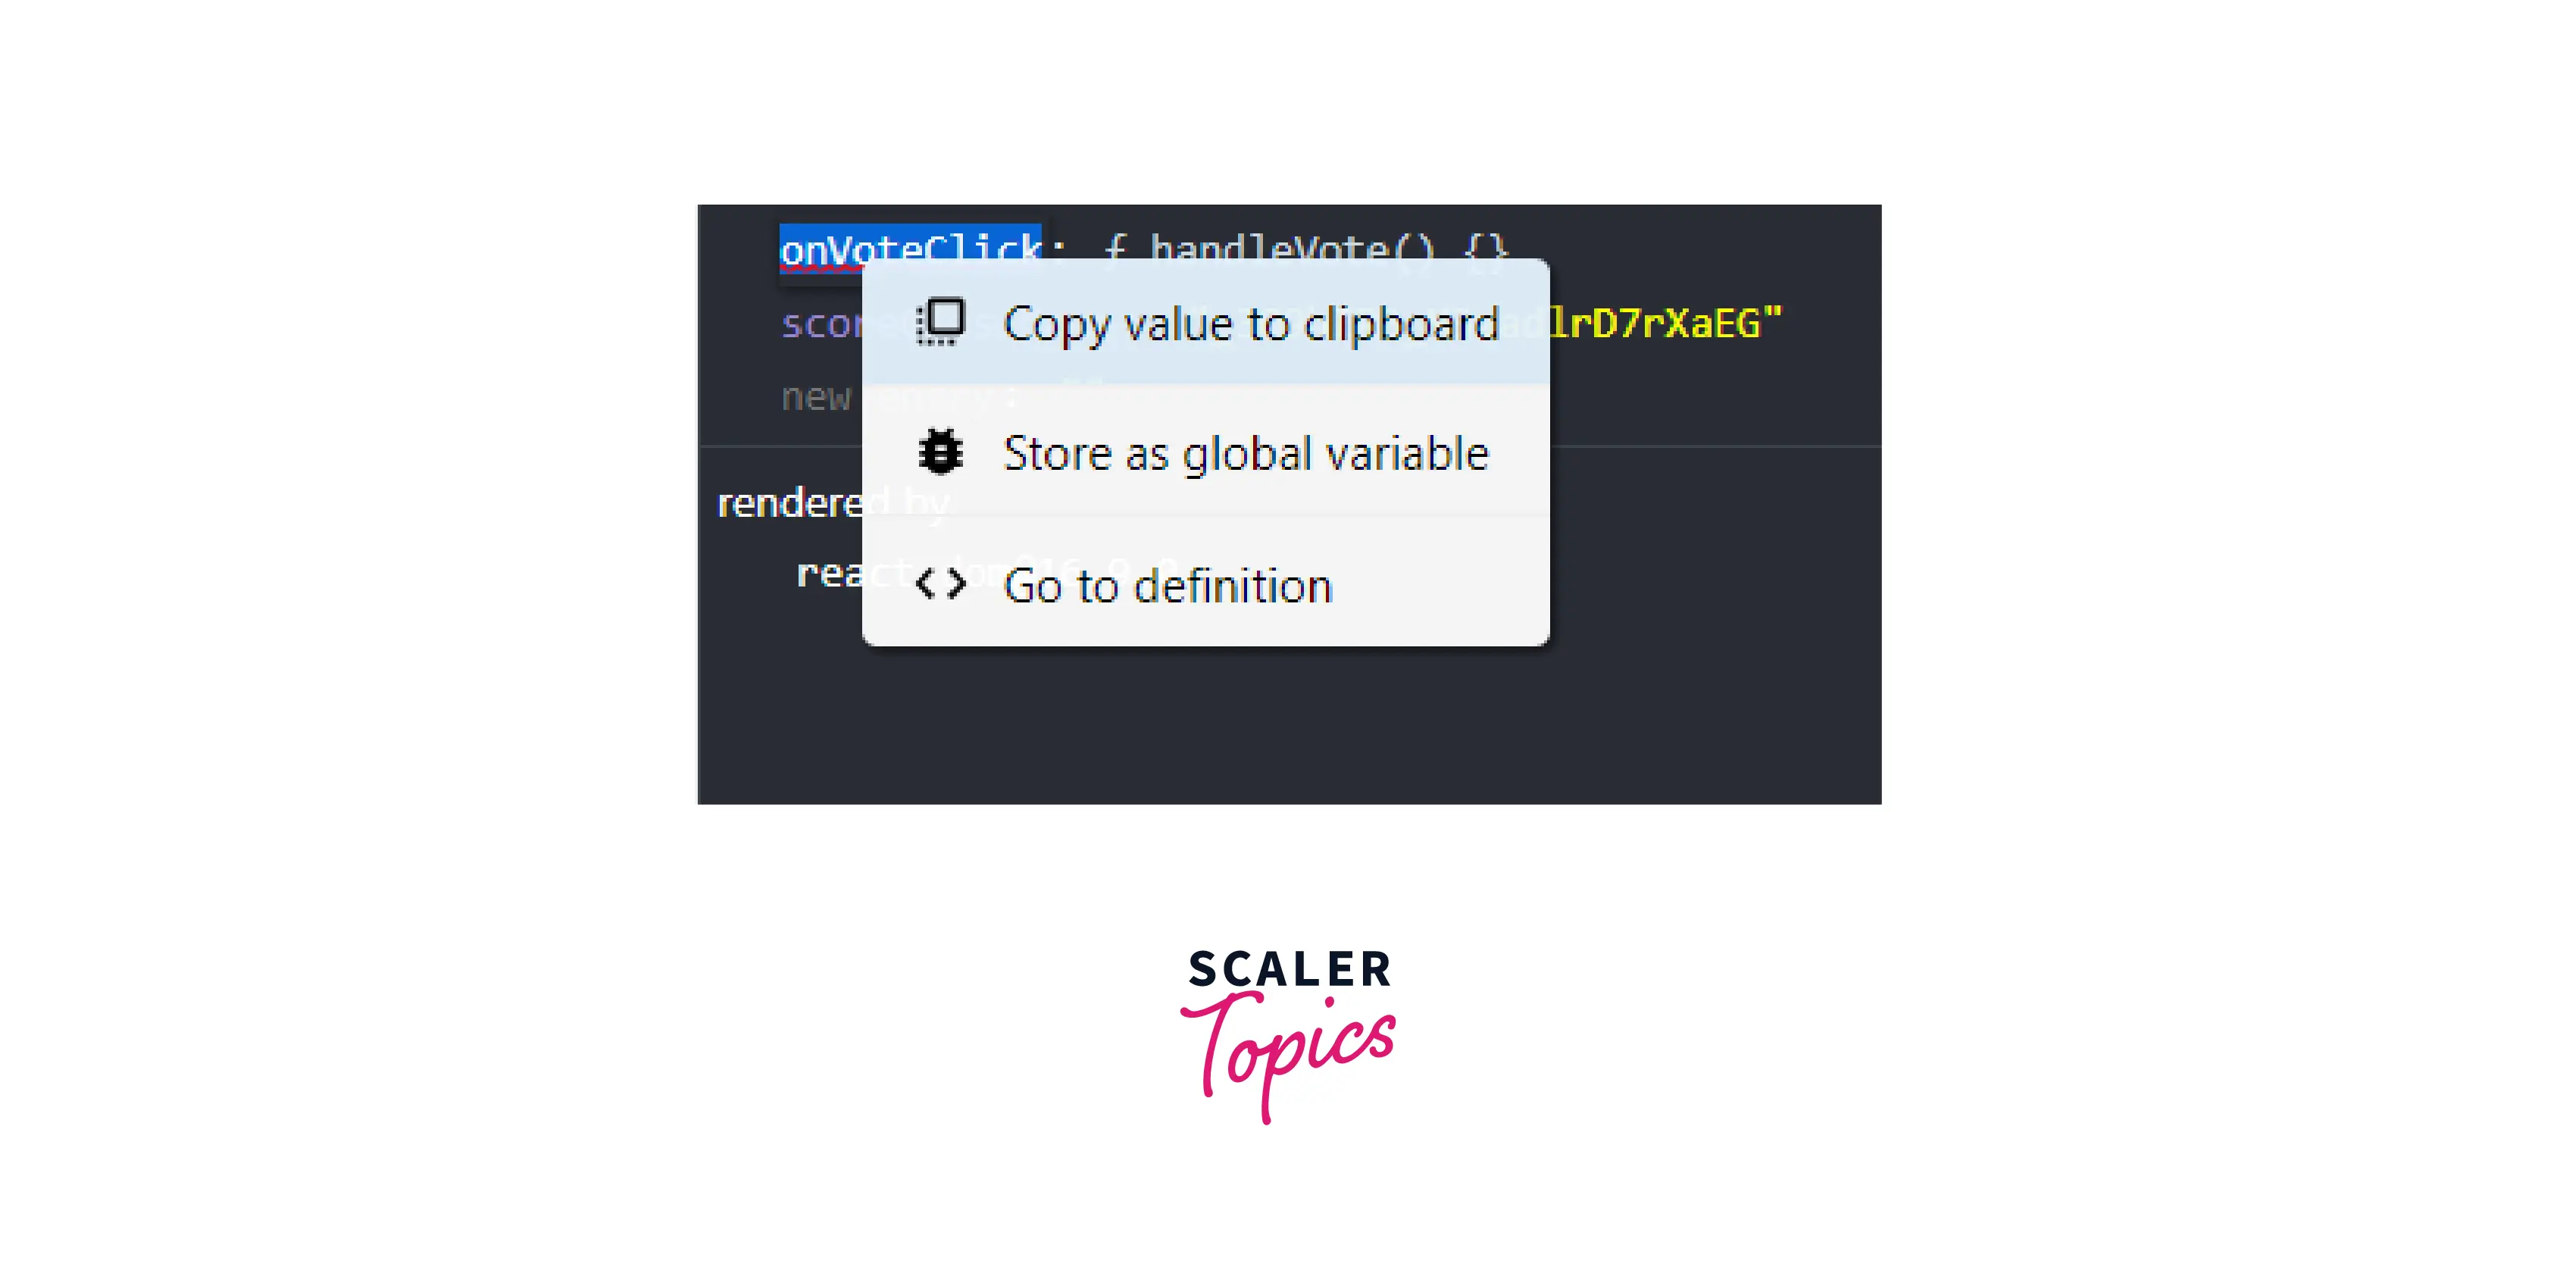
The React DevTools provide an easy option for functions such as callback functions or click handlers. DevTools allow us to make the function global by simply right-clicking on it and selecting Store as a global variable. This way we can call this method whenever we want with different arguments.
Improved Support for Hooks
Projects made with React functional components that use hooks can be debugged faster because React DevTools version 4 has the same level of support as props and state.
Profiler Tab
The Profiler in React DevTools is a powerful tool for measuring the performance of React components. It is used to debug performance-related issues. This profiling feature shows us a summary of how our application rerenders.
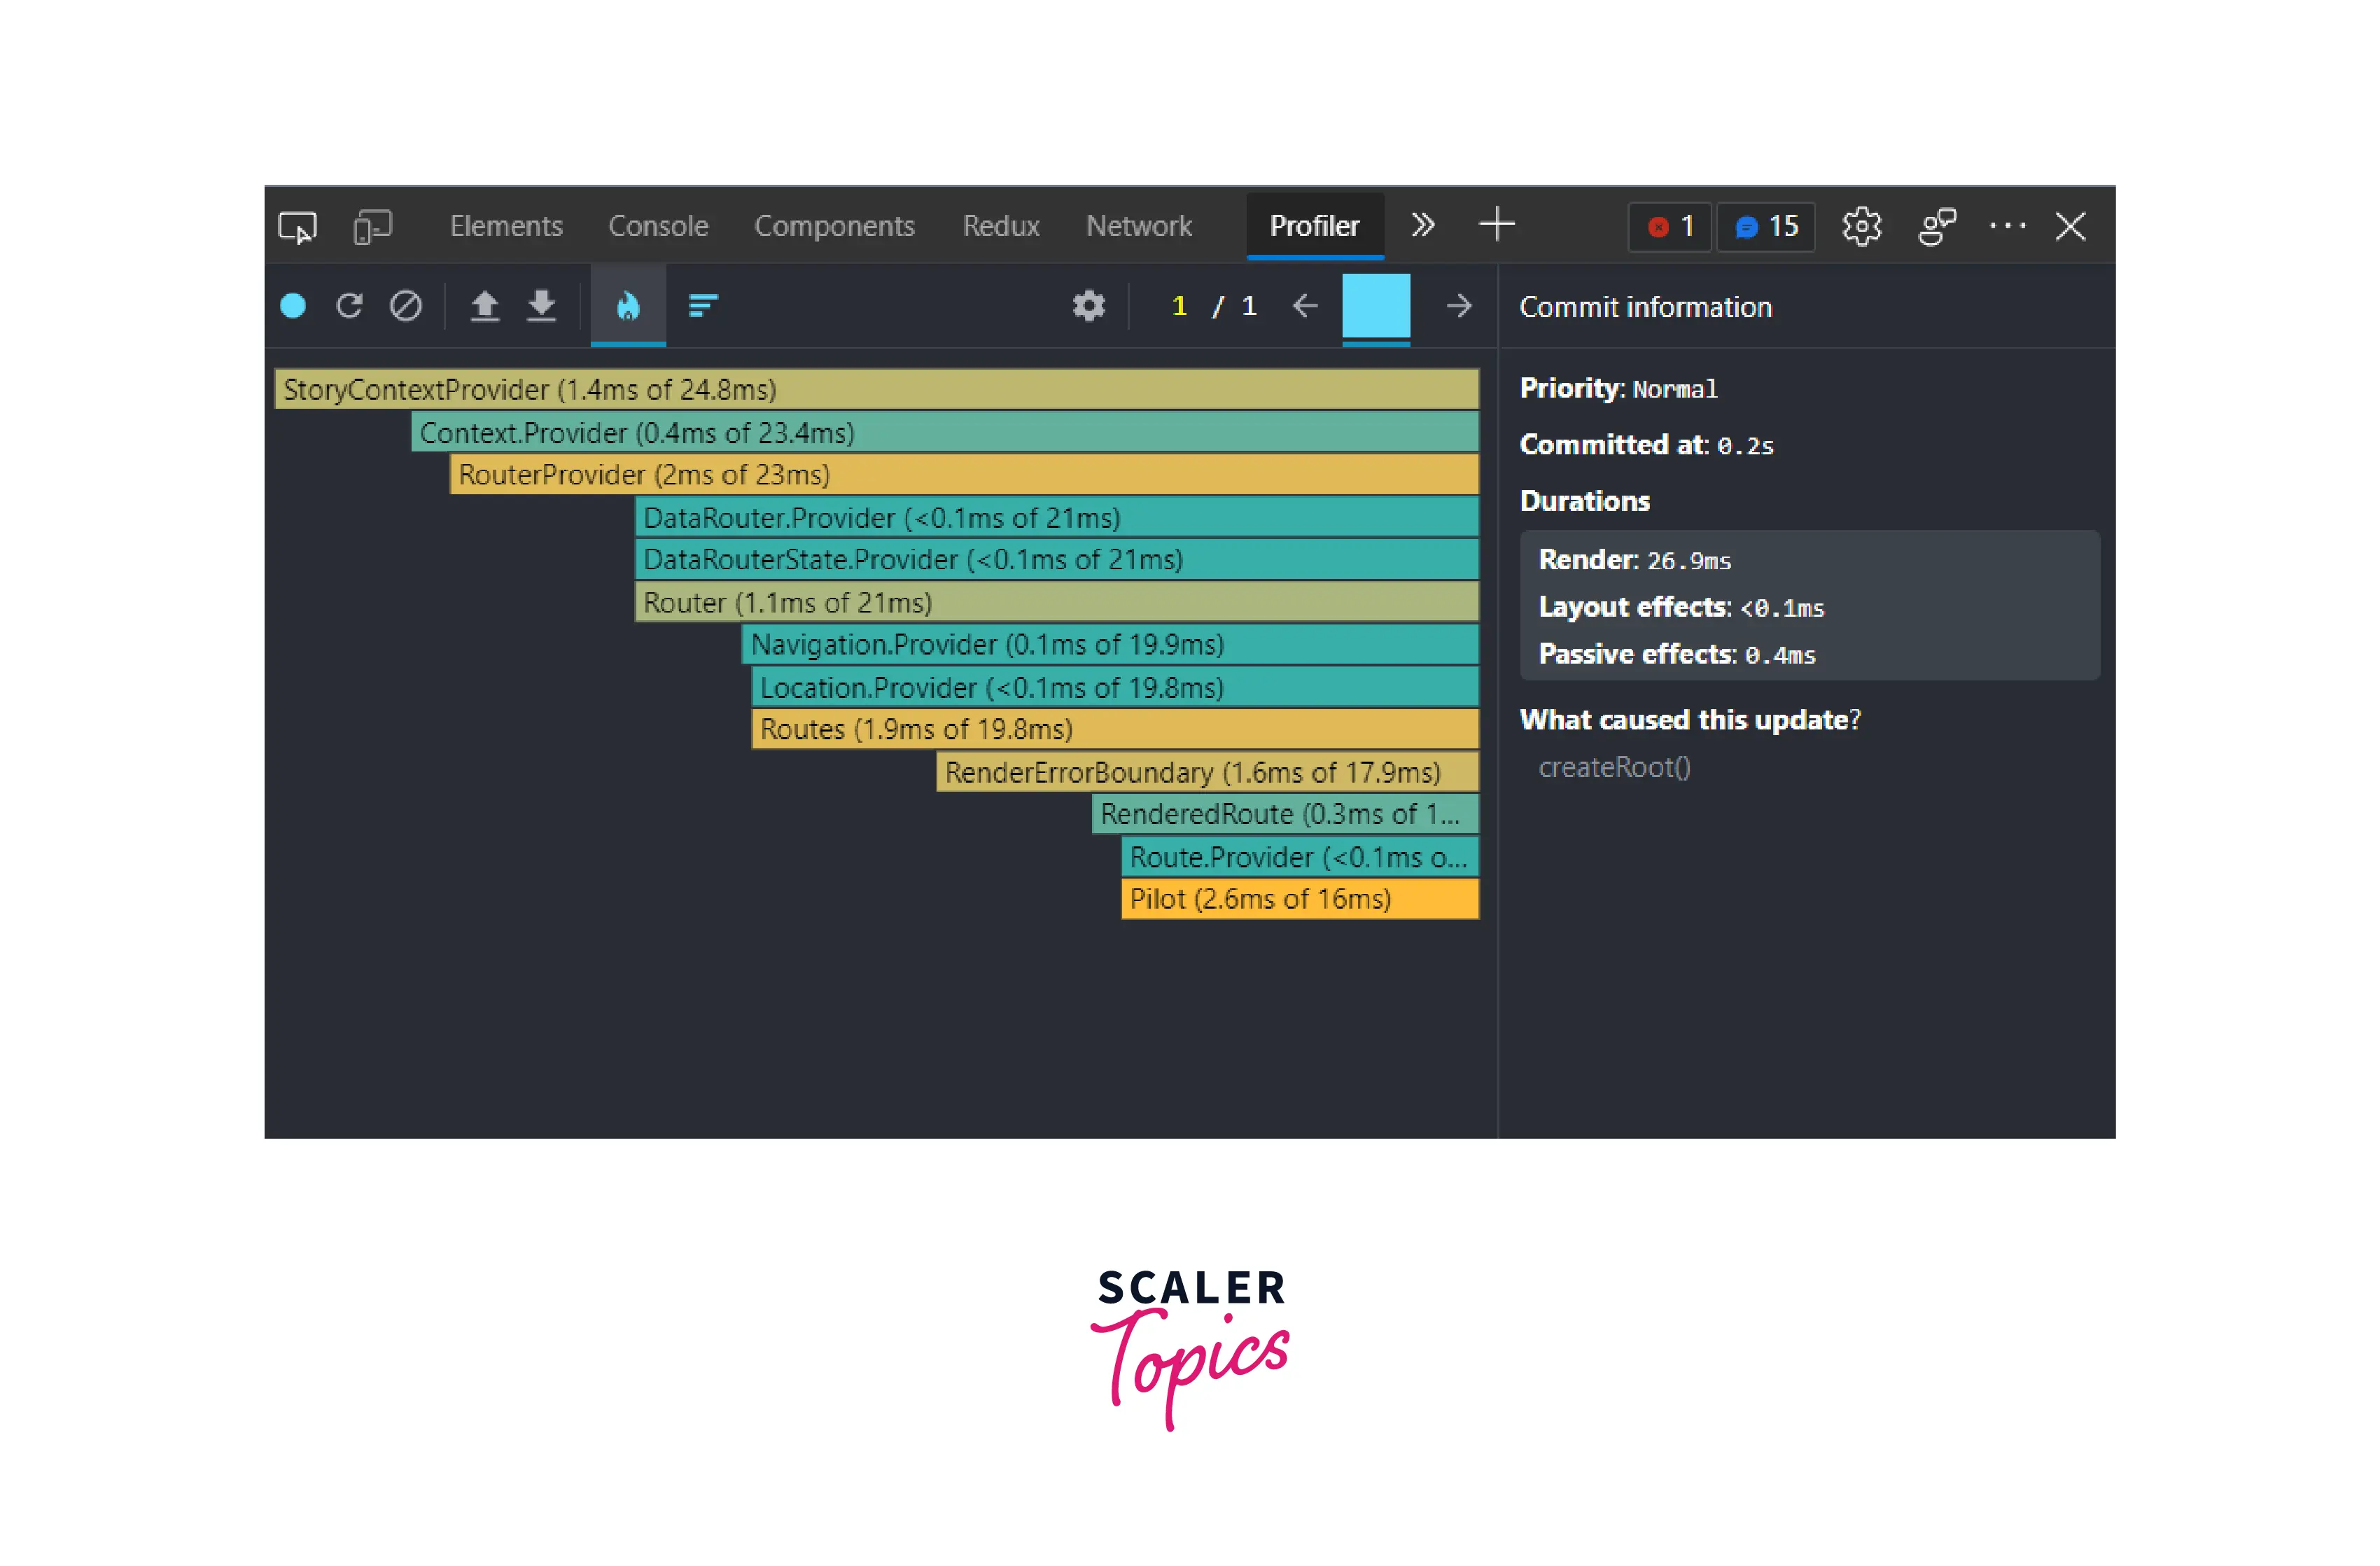
The Legacy version of DevTools supported profiling but only after it detected a profiling-capable version of React. As a result, it was impossible to profile an application's initial mount. Now, a new section called reload and profile is added to incorporate this functionality.
Note: The profiling-specific code is removed from the production build of react. To enable profiling in the production build we have to make changes to the webpack configuration. The proguideguid can be found here
Component rendering and re-rendering, as well as the amount of time required for each render, can be monitored by the profiler. This list can be used to quickly navigate between commits when evaluating the performance of particular components.
Conceptually react works in two phases:
- The render phase decides what changes need to be made
- The commit phase is when changes are applied by React.
Let's look at the step to use the profiler:
- Open a webpage made with the ReactDOM's profiling build first.
- Click the red circle to begin recording a session.
- Perform a few actions within the program.
- Finally, to end the session, tap the circle once again. Therefore, component-specific timings ought to show up.
Step Through Parents (owners’ tree)
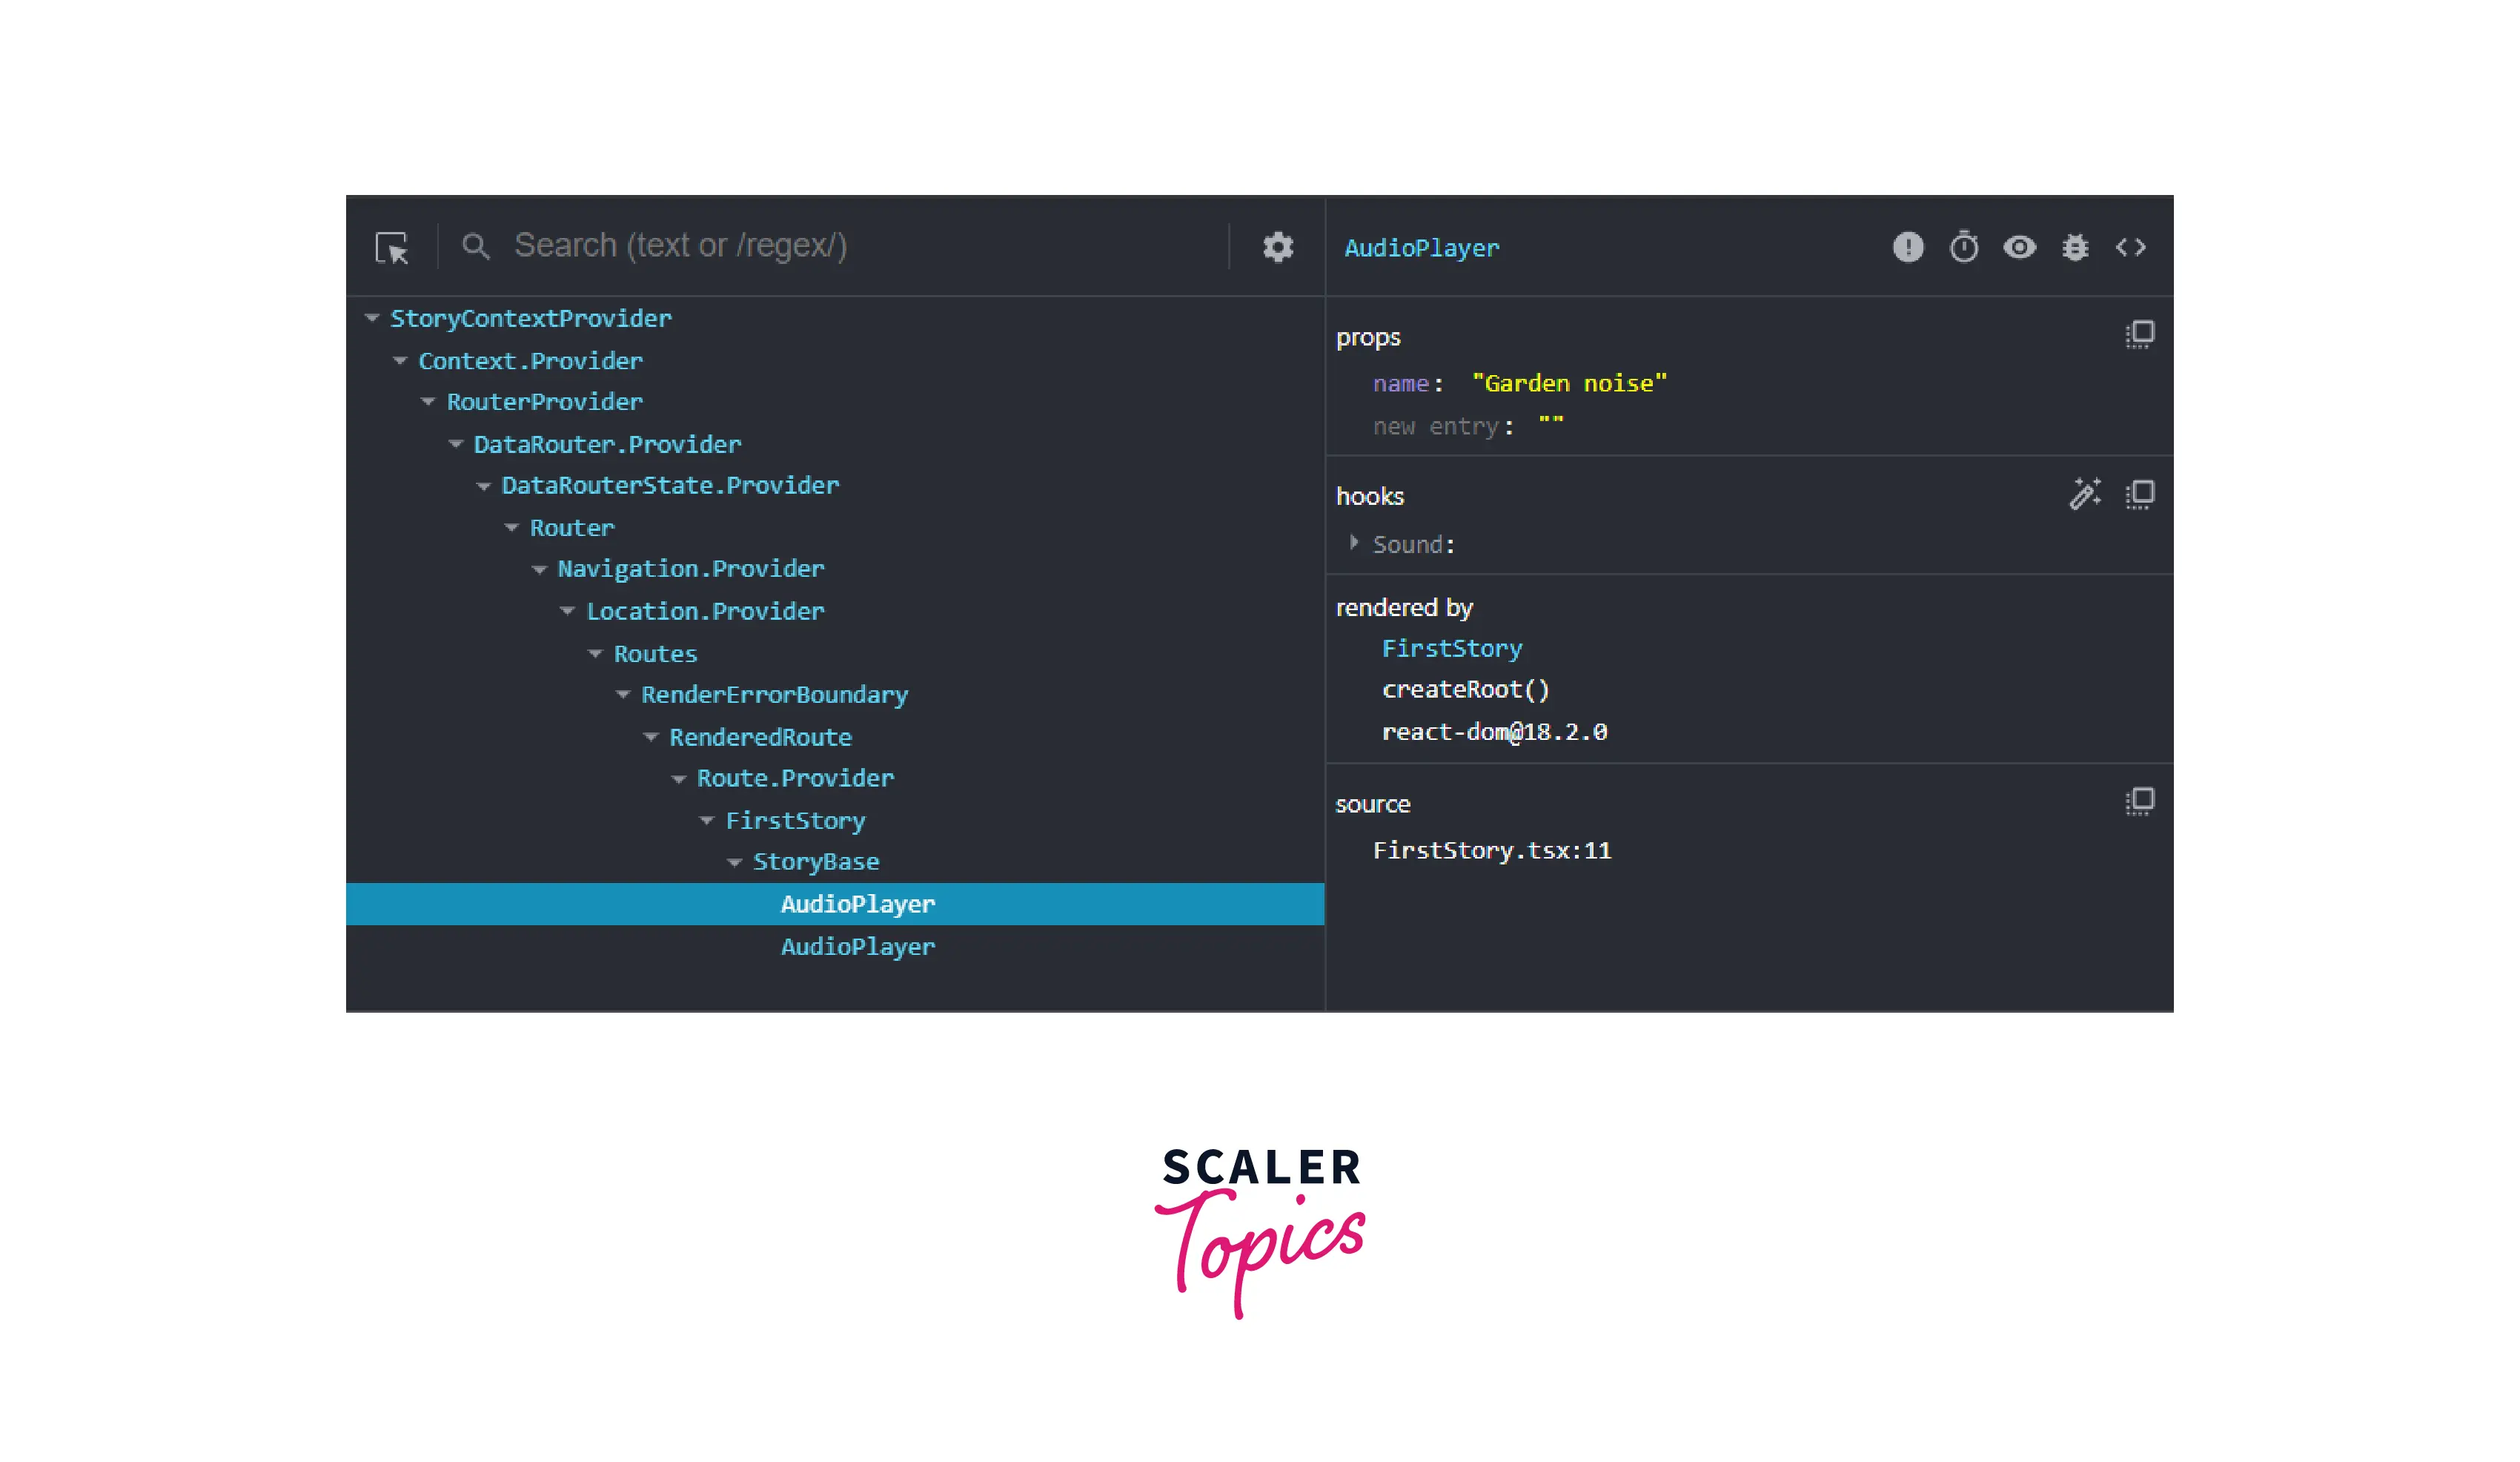
We can see a certain component and its subtree easily because of the owner's tree, which hides the remainder of the component tree.
Along with the owner's tree, the rendered-by option in the right pane displays the list of owners of the current component.
Access Components and States From the Console
The React DevTools provide a good way to solve a lot of bugs but some of the bugs can be easily fixed with our good old console.log(). DevTools provide a way to directly interact with the components through the console. Open the console and type $r and then we can have access to the instance of that React component. Now we can access the React state, trigger functions, etc directly from the console.
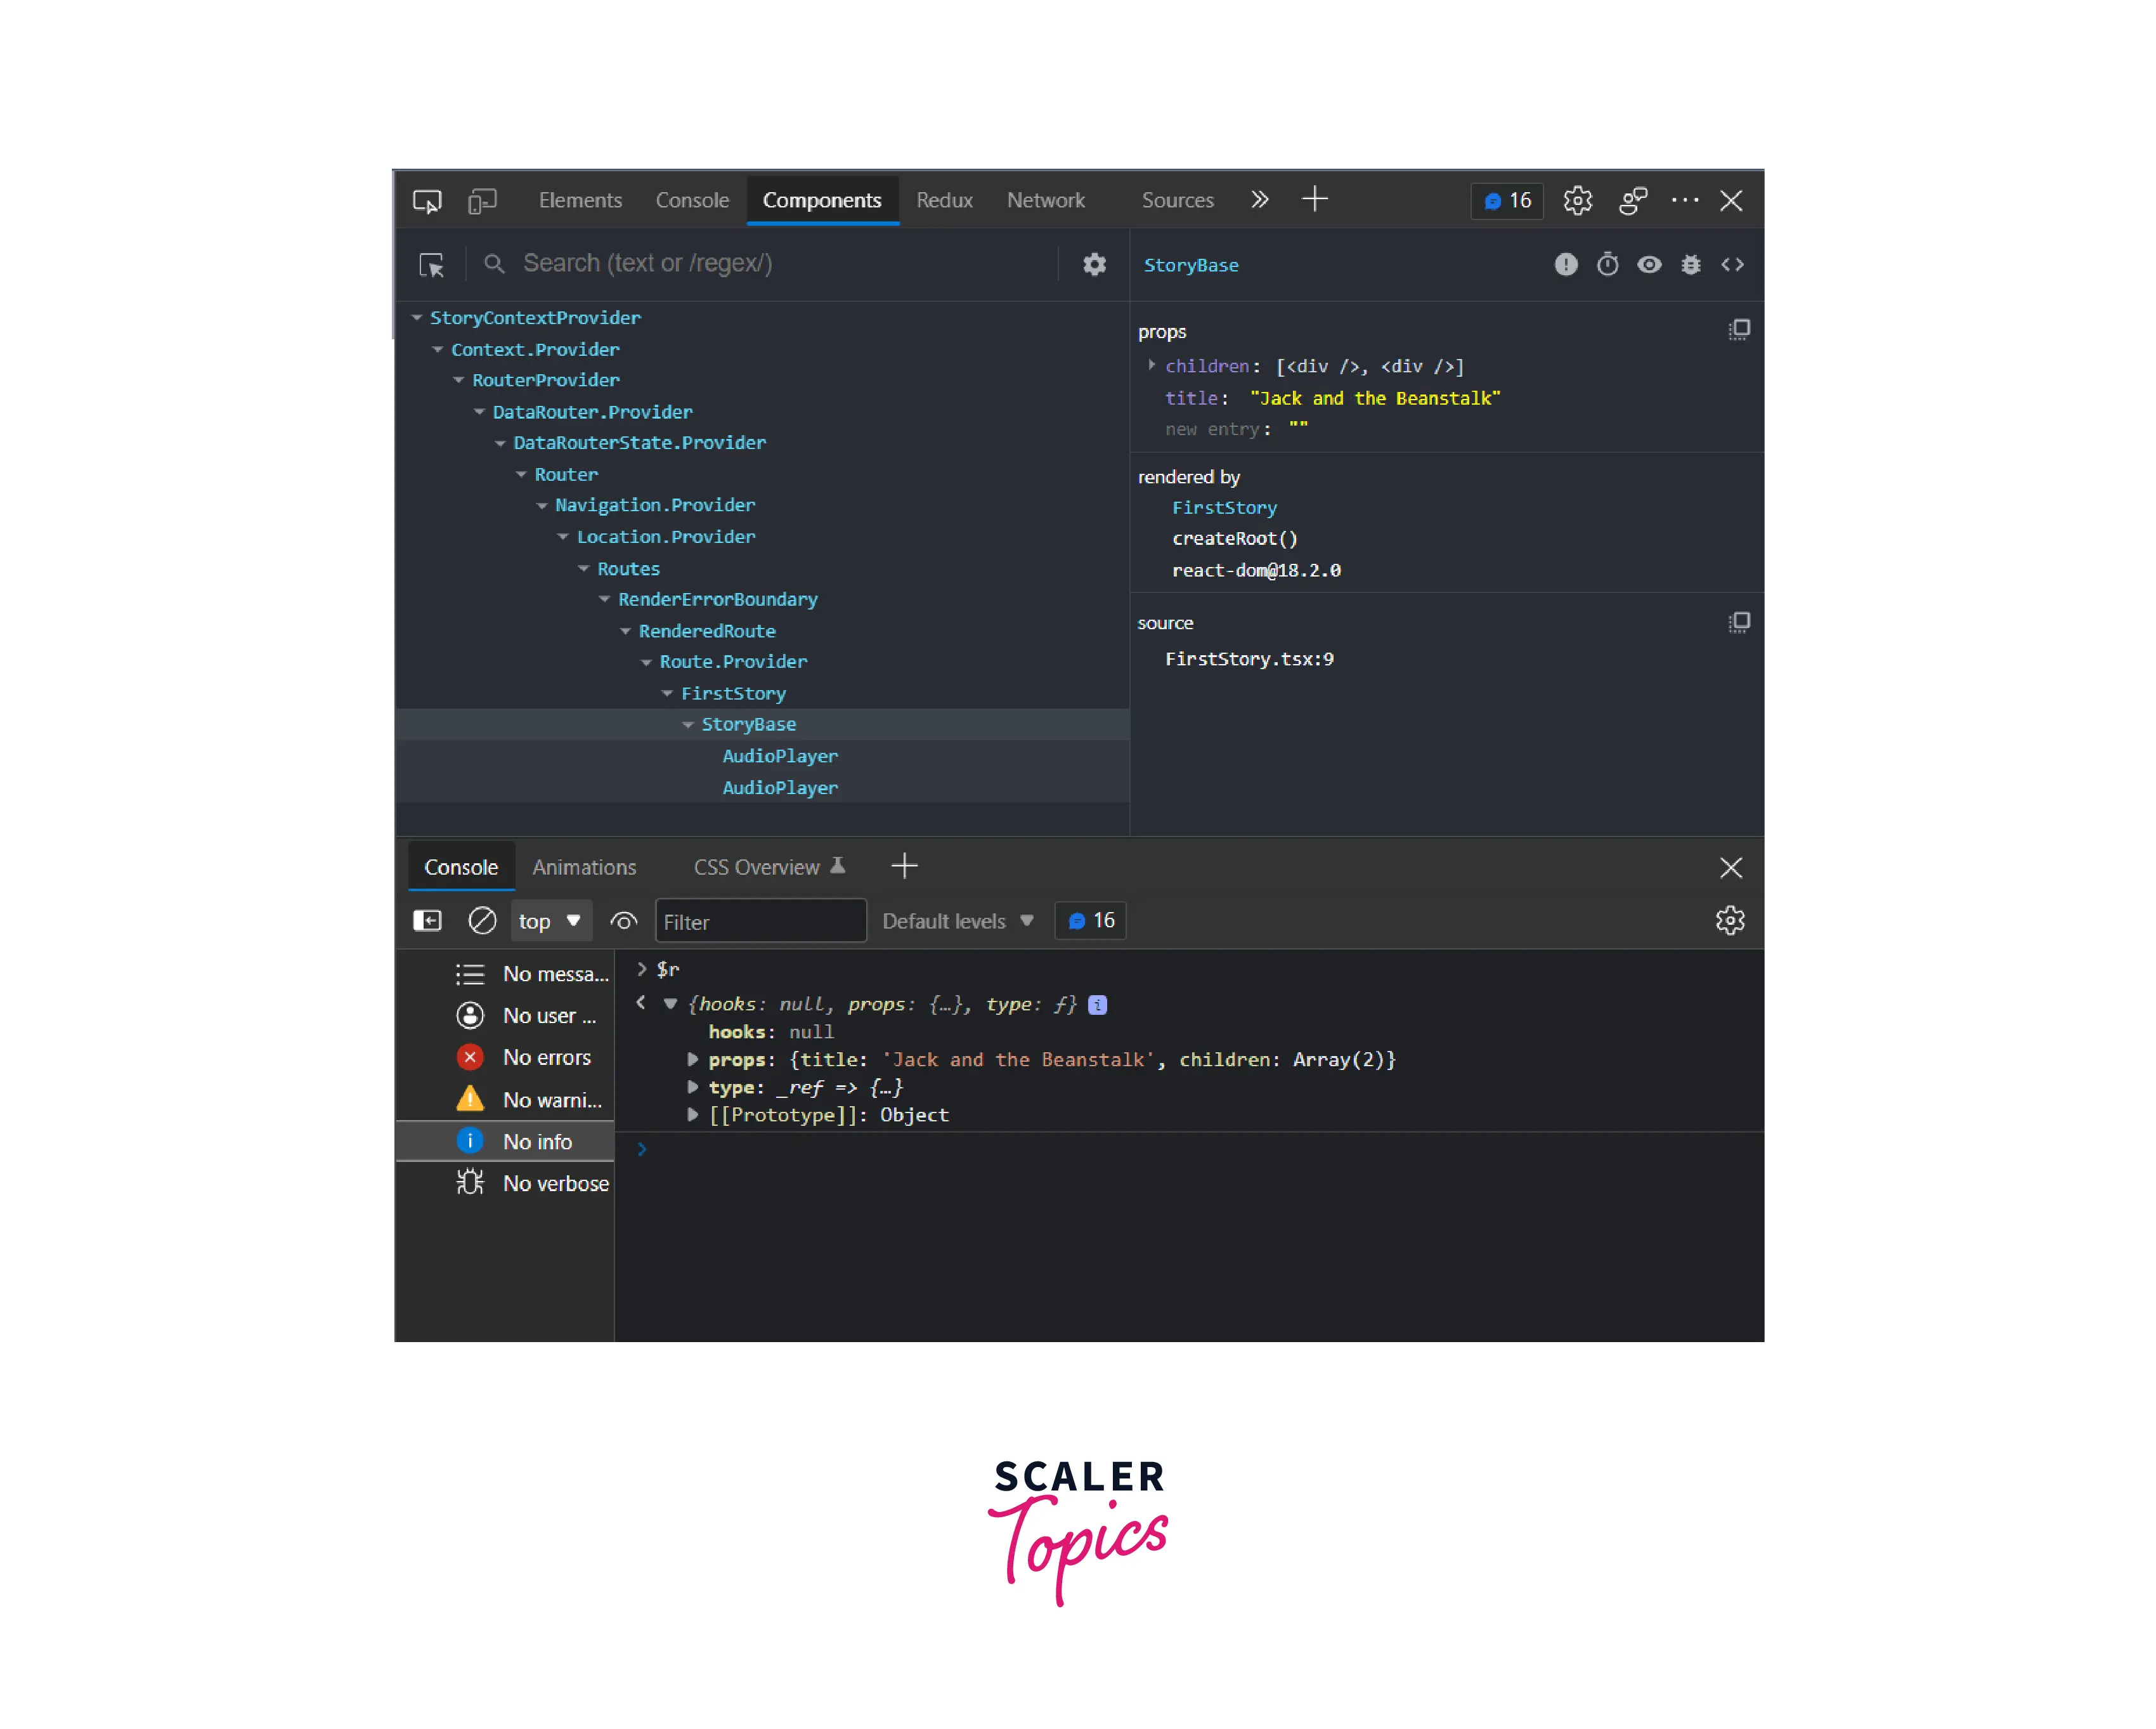
Jump into Source View
Most people aren't aware of how powerful the debugging tools are in modern browsers. You may place breakpoints, step through code execution line by line, check state and props as your app changes, and establish breakpoints. But the thing is, the code compiled by Babel is hard to read. To solve this issue Babel provides a plugin that adds a __source prop to all JSX elements. This is very helpful in the development mode as it allows DevTools to link the current component directly to the source code.
For using this feature we have to install babel-plugin-transform-react-jsx-source with the following command
After installation update the plugins object in the .babelrc configuration file
Now when you right-click on a component in the component tree, you will get a new option Show <component> source. Clicking this will take you directly to the browser source view where you can perform operations on the code.
Note: If you are using Create React App (CRA) then this works out of the box.
Interaction Tracking
In some complex settings, it becomes difficult to figure out why a commit or render is taking more than the expected time. To help with this issue React DevTools have Interaction Tracking which is a programmatic API that allows us to place labels on different events in our app.
Note: This API is removed with React 17
Conclusion
This article must have helped you learn about React DevTools and how you can use them. Let's recap quickly
- Debugging is a process of finding and solving errors in code.
- React provides React Developer Tools which aid in the debugging process.
- React Developer Tools is a browser extension and can be installed from the respective browser store.
- React DevTools has two sections
- Components Tab
- Profiler
- Components Tab shows the structure of the website along with state, props, hooks, etc, and provides several functions.
- It has functionalities like an owner's tree, source view, access components through the console, and interaction tracking.
- The Profiler tab is used for measuring the performance of React Components.
