Data Flow diagrams and Data Dictionaries
Overview
A Data Flow Diagram (DFD) shows the flow of data through the components of any system. Using symbols like rectangles, circles, and arrows, as well as brief text labels, it displays data inputs, outputs, storage locations, and the routes between each destination. Data flow diagrams can range from straightforward, even hand-drawn, process summaries to intricate, multi-level DFDs that go in-depth. They can be utilized to model a new software system or to imitate an existing one. Like other diagrams, they can visually "convey" concepts that are challenging to explain verbally. They can be understood by both technical and laymen easily.
What is a Data Flow Diagram (DFD)
A Data Flow Diagram (DFD) is a classic visual representation of a system's information flows. It can be manual, automatic, or a hybrid of the two. It demonstrates how data enters and exits the system, what alters the data, and where data is stored. A DFD's goal is to represent the breadth and bounds of a system as a whole. It can be used as a method of communication between a system analyst and developers. The data flow diagram (DFD) is also known as a data flow graph or bubble chart.
Components of Data Flow Diagrams
The Data Flow Diagram has four components:
Process
In a system, input-to-output transformation occurs as a result of process function. A process sign might be rectangular with rounded corners, oval, rectangle, or circle. The process is expressed in one word or phrase.
Transform Your Career
Choose from our industry-leading programs designed for career success
Modern Software and AI Engineering Program
Master full-stack development with AI integration

Modern Data Science and ML with specialisation in AI
Advanced data science techniques with AI specialization
Advanced AIML with Specialisation in Agentic AI
Deep dive into AIML with focus on Agentic systems
DevOps, Cloud & AI Platform Engineering
Build and manage AI-powered cloud infrastructure
AI Engineering Advanced Certification by IIT-Roorkee
Premier AI engineering certification from IIT-Roorkee
Data Flow
Data flow describes the transport of information between different elements of a system. The arrow symbol represents data flow. The flow should be given a related name to determine the information being moved. Data flow also symbolizes the movement of material as well as information. Material shifts are represented in systems that are more than just instructive. A given flow should only transfer one sort of data. The flow can also be bi-directional.
Warehouse
The information is saved in the warehouse for future use. The store's symbol is represented by two horizontal lines. The warehouse is not limited to a data file; it may be anything from a folder containing documents to an optical disc or a filing cabinet. The data warehouse can be examined regardless of how it is implemented. When data flows from the warehouse, it is referred to as data reading; when data flows to the warehouse, it is referred to as data input or data updation.
Terminator
The Terminator is an external entity that communicates with the system from outside the system. It can be businesses such as banks, groups of individuals such as consumers, or distinct departments of the same firm that are not part of the model system and are external entities.
Rules for Creating Data Flow Diagrams
- The entity's name should be simple and understandable without any additional explanation, like comments.
- The processes should be numbered or organized into a list so they may be easily referred to.
- The DFD should be consistent across all DFD levels.
- A single DFD can have a maximum of nine processes and a minimum of three.
Scaler Placement Report and Statistics
Scaler learners achieved 2.5x salary growth with average post-Scaler CTC reaching ₹23L.
Levels of Data Flow Diagrams
In software engineering, DFDs (data flow diagrams) can be used to illustrate systems at various degrees of abstraction. Higher-level DFDs are subdivided into lower-level DFDs containing additional information and functional features. DFD levels are numbered 0, 1, 2, and higher.
Turn Learning into Career Growth
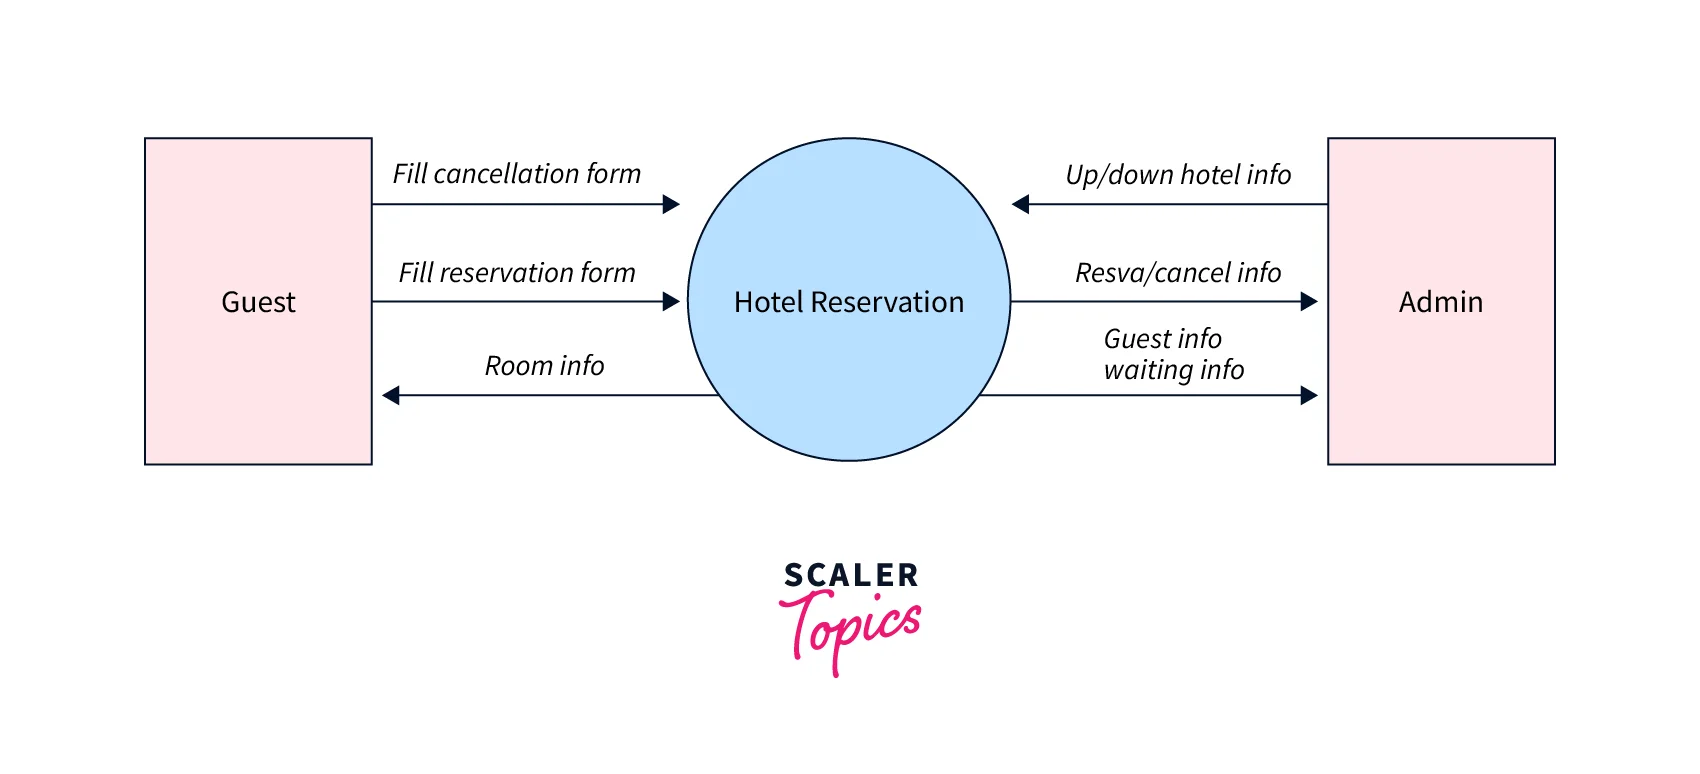
0-Level DFD
It's also referred to as a context diagram. It is intended to be an abstract view, depicting the system as a single process with external elements. It represents the complete system as a single bubble with incoming and outgoing arrows indicating input and output data. Here's an example of a 0-level DFD.
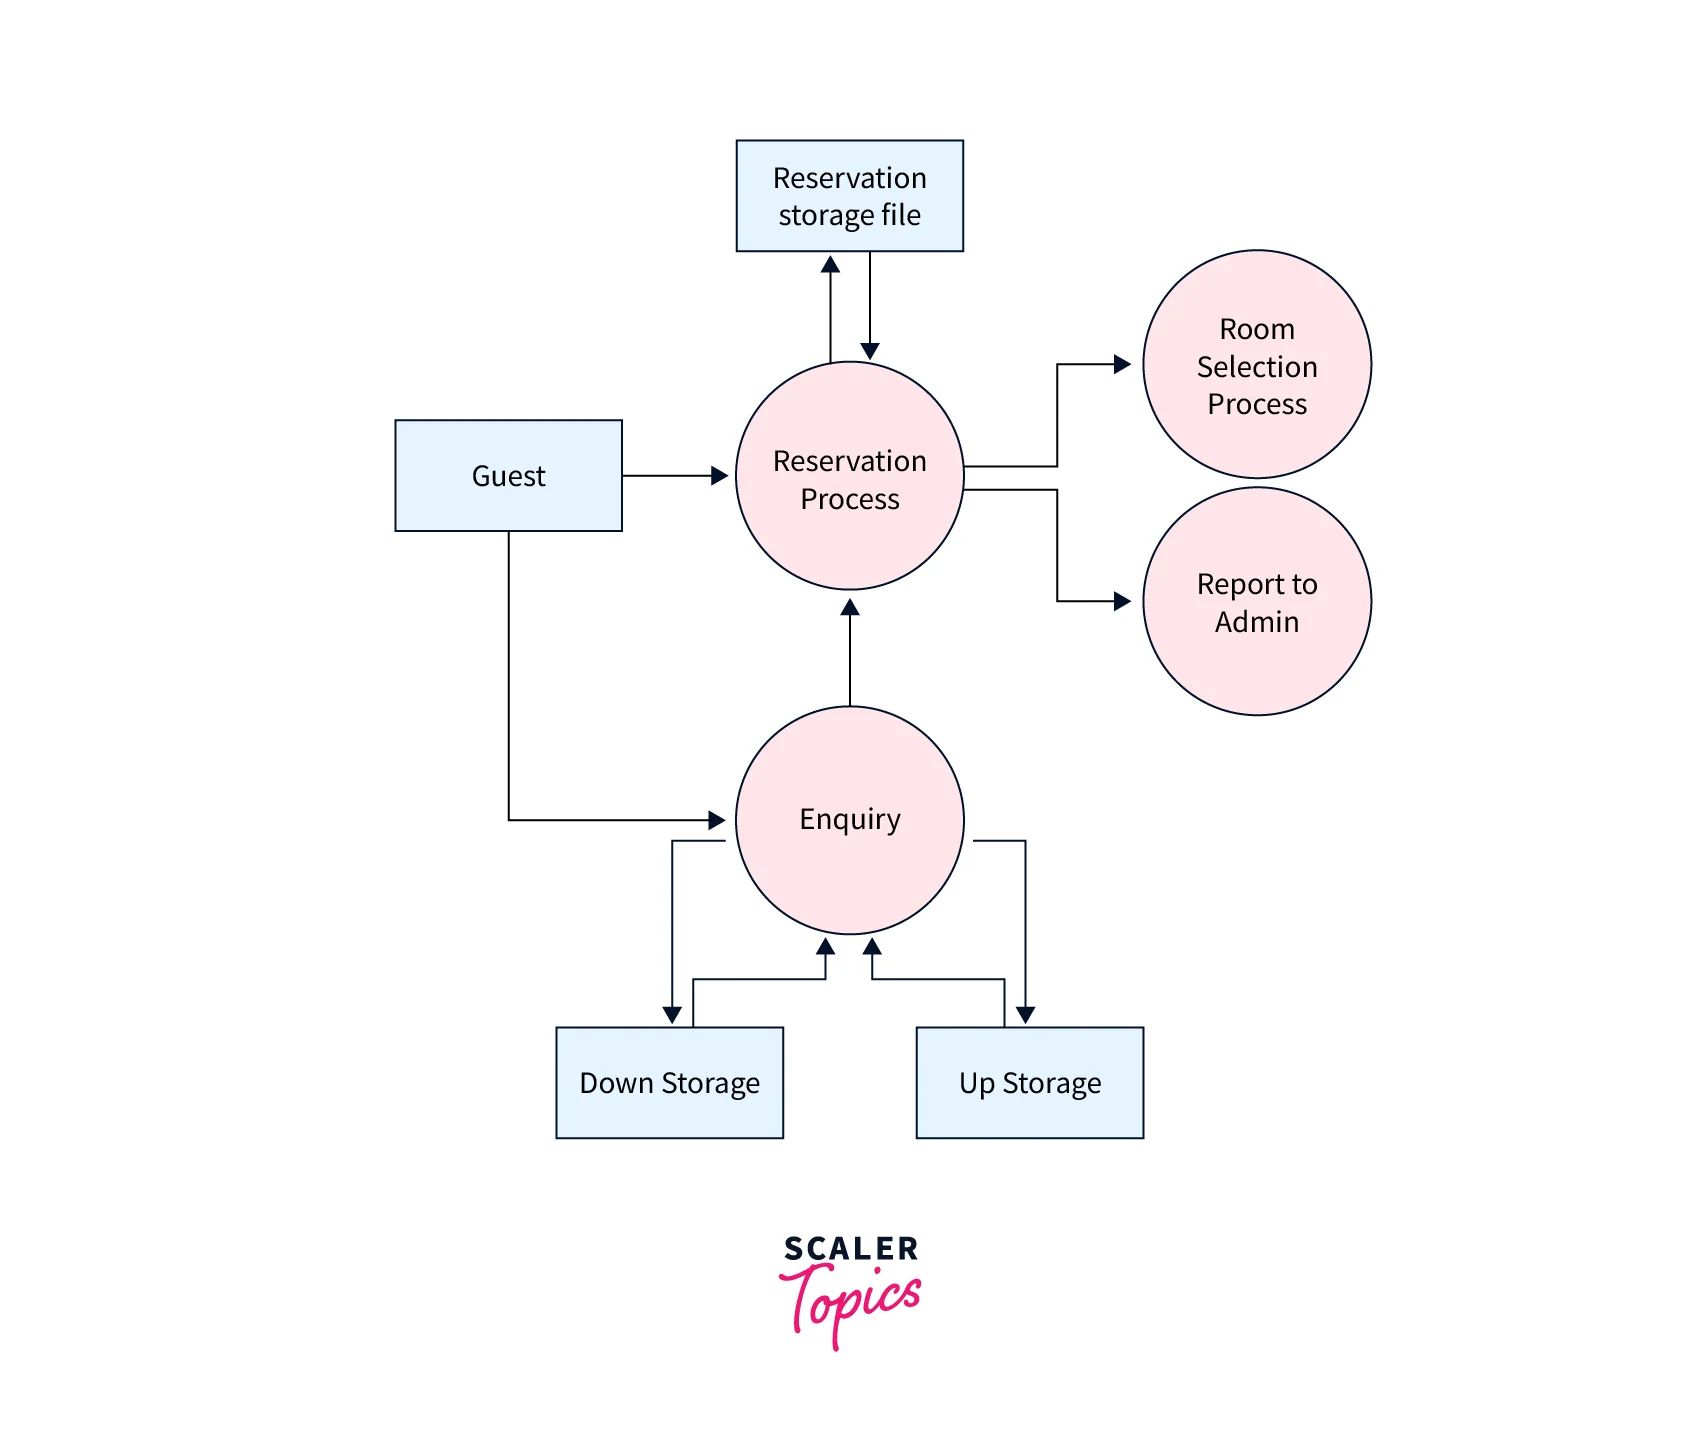
1-Level DFD
In 1-level DFD, the context diagram is broken down into many bubbles and processes. At this level, we highlight the system's essential functions and divide the high-level process of 0-level DFD into subprocesses. Here's an example of a 1-level DFD.
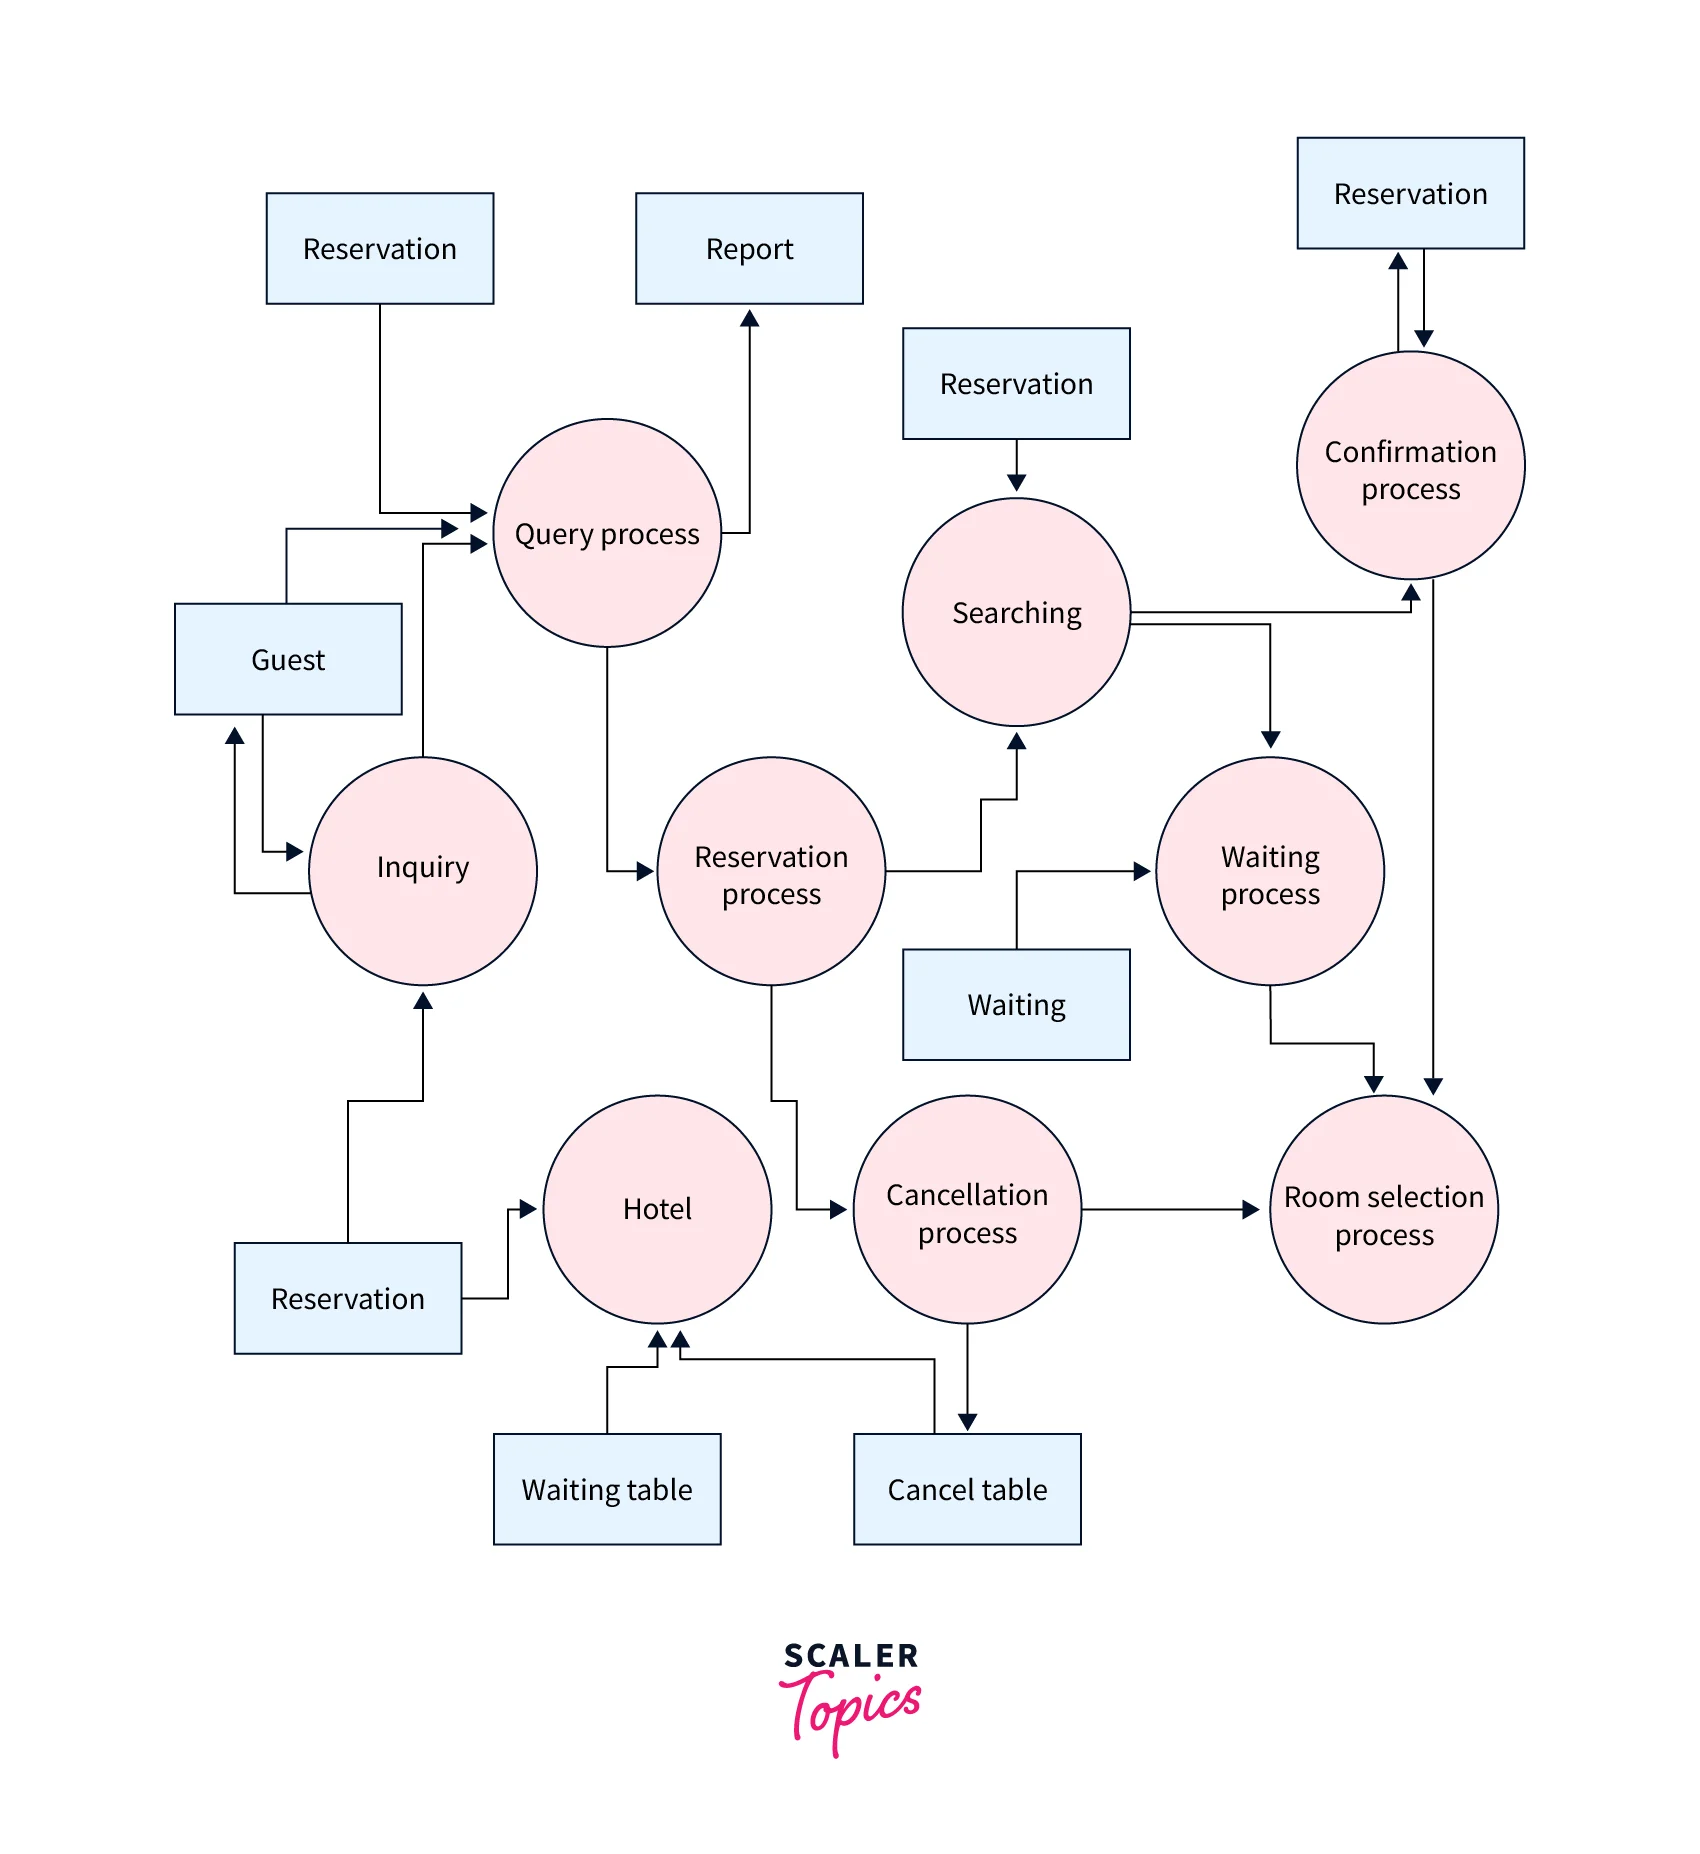
2-Level DFD
2-level DFD delves deeper into aspects of 1-level DFD. It can be used to design or record specific/necessary details about how the system works. Here's an example of a 2-level DFD.
Scaler Placement Report and Statistics
Scaler learners achieved 2.5x salary growth with average post-Scaler CTC reaching ₹23L.
Advantages of Data Flow Diagrams
- It assists us in comprehending the operation and limitations of a system.
- It is a graphical representation that aids in the visualization of information.
- Data Flow Diagrams are thorough diagrams of system components that are adequately explained.
- It is part of the system documentation file.
- Because they are simple to grasp, Data Flow Diagrams can be understood by both technical and non-technical people.
Disadvantages of Data Flow Diagrams
- DFD can occasionally confuse programmers about the system.
- Data Flow Diagrams take a long time to construct, so analysts are frequently refused to work on them.
Conclusion
- Data flow diagrams, often known as DFDs, are used to graphically illustrate data flow in a corporate information system.
- DFD outlines the procedures that occur in a system to move data from the input to file storage and to generate reports.
- A data flow diagram can dive into progressively more detail by using levels and layers, zeroing in on a particular piece.
- Developers and designers can utilize the DFD to write pseudocode if it is sufficiently detailed.