UML Diagrams
Overview
The Unified Modeling Language (UML) is a modeling language that can be used for a variety of purposes. The primary goal of UML is to establish a standard way to visualize how a system has been constructed. The Object Management Group (OMG) developed UML and a draft of the UML 1.0 definition was proposed to OMG in January 1997. It was developed first to record the behavior of complicated software and non-software systems, and it is now an OMG standard. It is very similar to blueprints used in other engineering professions.
What are UML Diagrams?
The Unified Modeling Language (UML) is a mechanism for visually representing the architecture, design, and implementation of complex software systems. Keeping track of links and hierarchies inside a software system is challenging while writing code because an application can have thousands of lines of code. The software system is divided into components and subcomponents using UML diagrams.
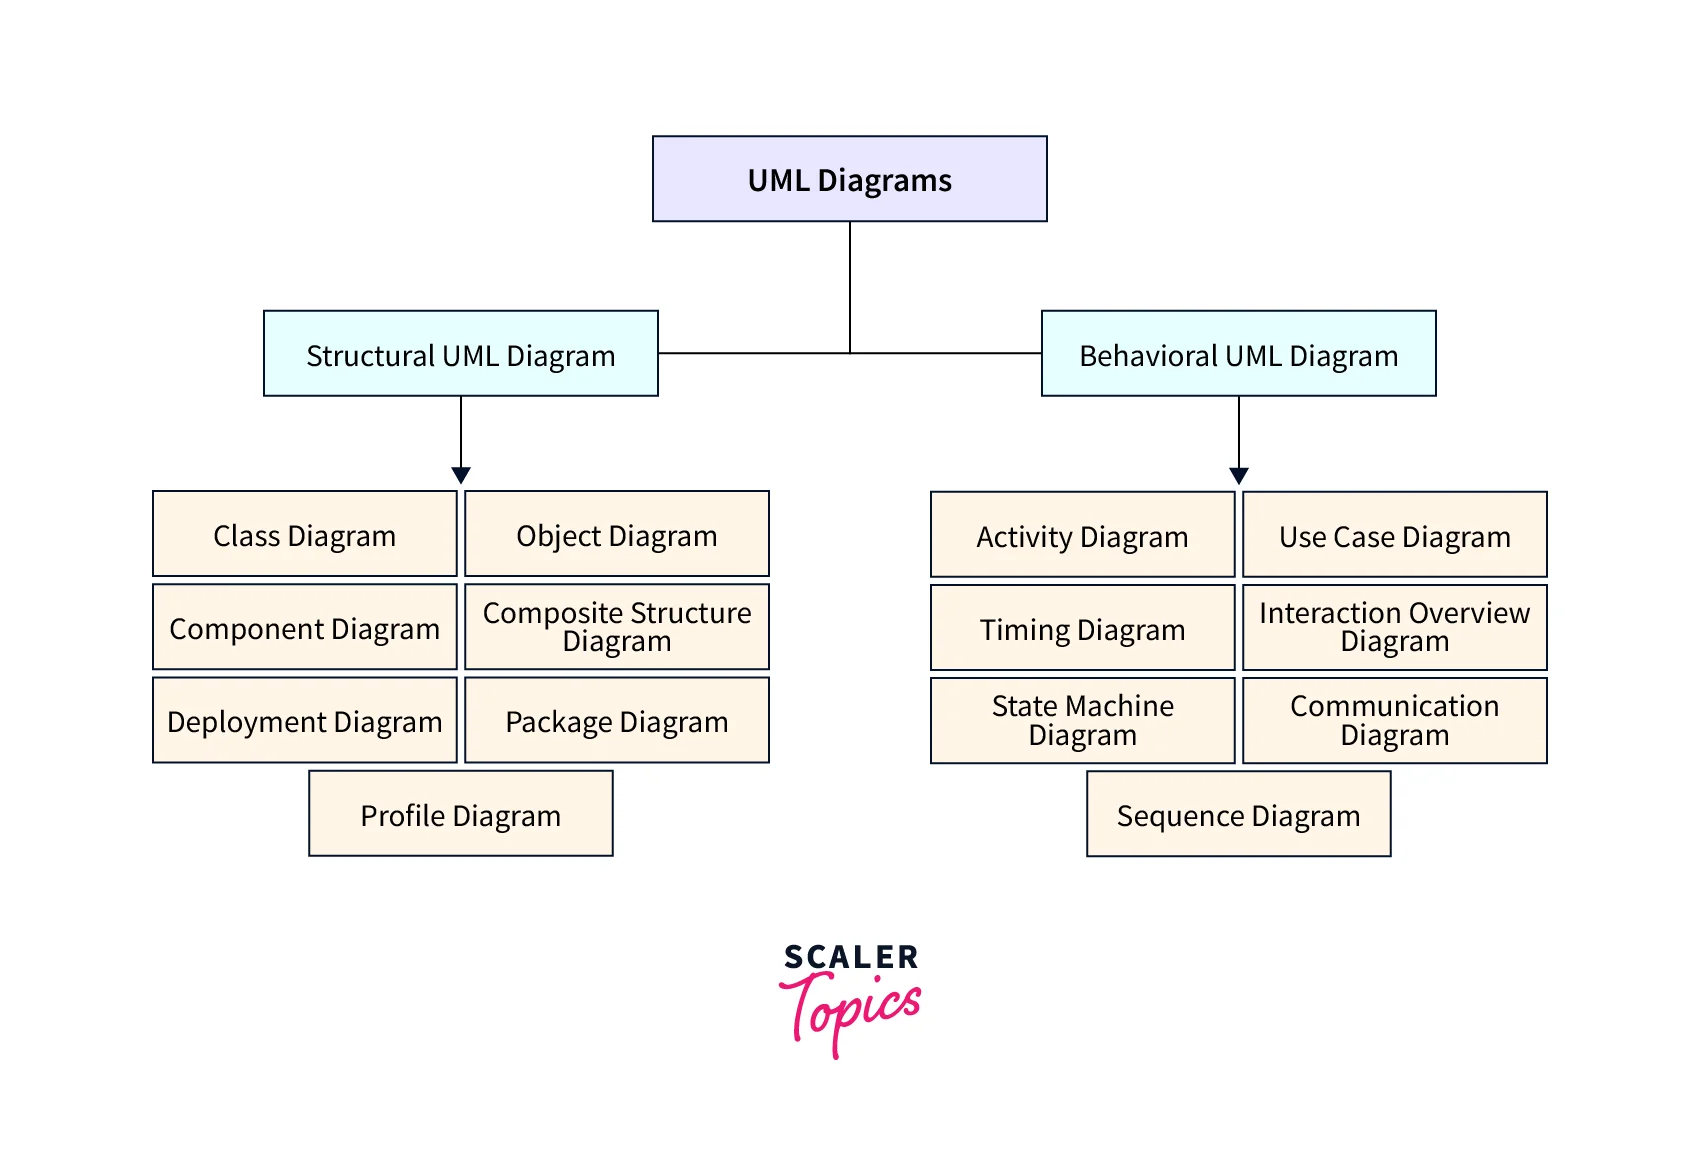
Types of UML Diagrams
UML provides numerous sorts of diagrams to depict the functioning of a system or program in pictorial format. These diagrams are classified into two groups: structural diagrams and behavioral diagrams. The structural diagram represents the static part of the system. The behavioral diagram depicts the system's both static and dynamic aspects.
Scaler Placement Report and Statistics
Scaler learners achieved 2.5x salary growth with average post-Scaler CTC reaching ₹23L.
Behavioural UML Diagrams
Any system can have static and dynamic elements. As a result, a model is regarded complete when both aspects are fully covered. Behavioral diagrams essentially capture a system's dynamic character. A system's changing/moving parts are called the dynamic aspect.
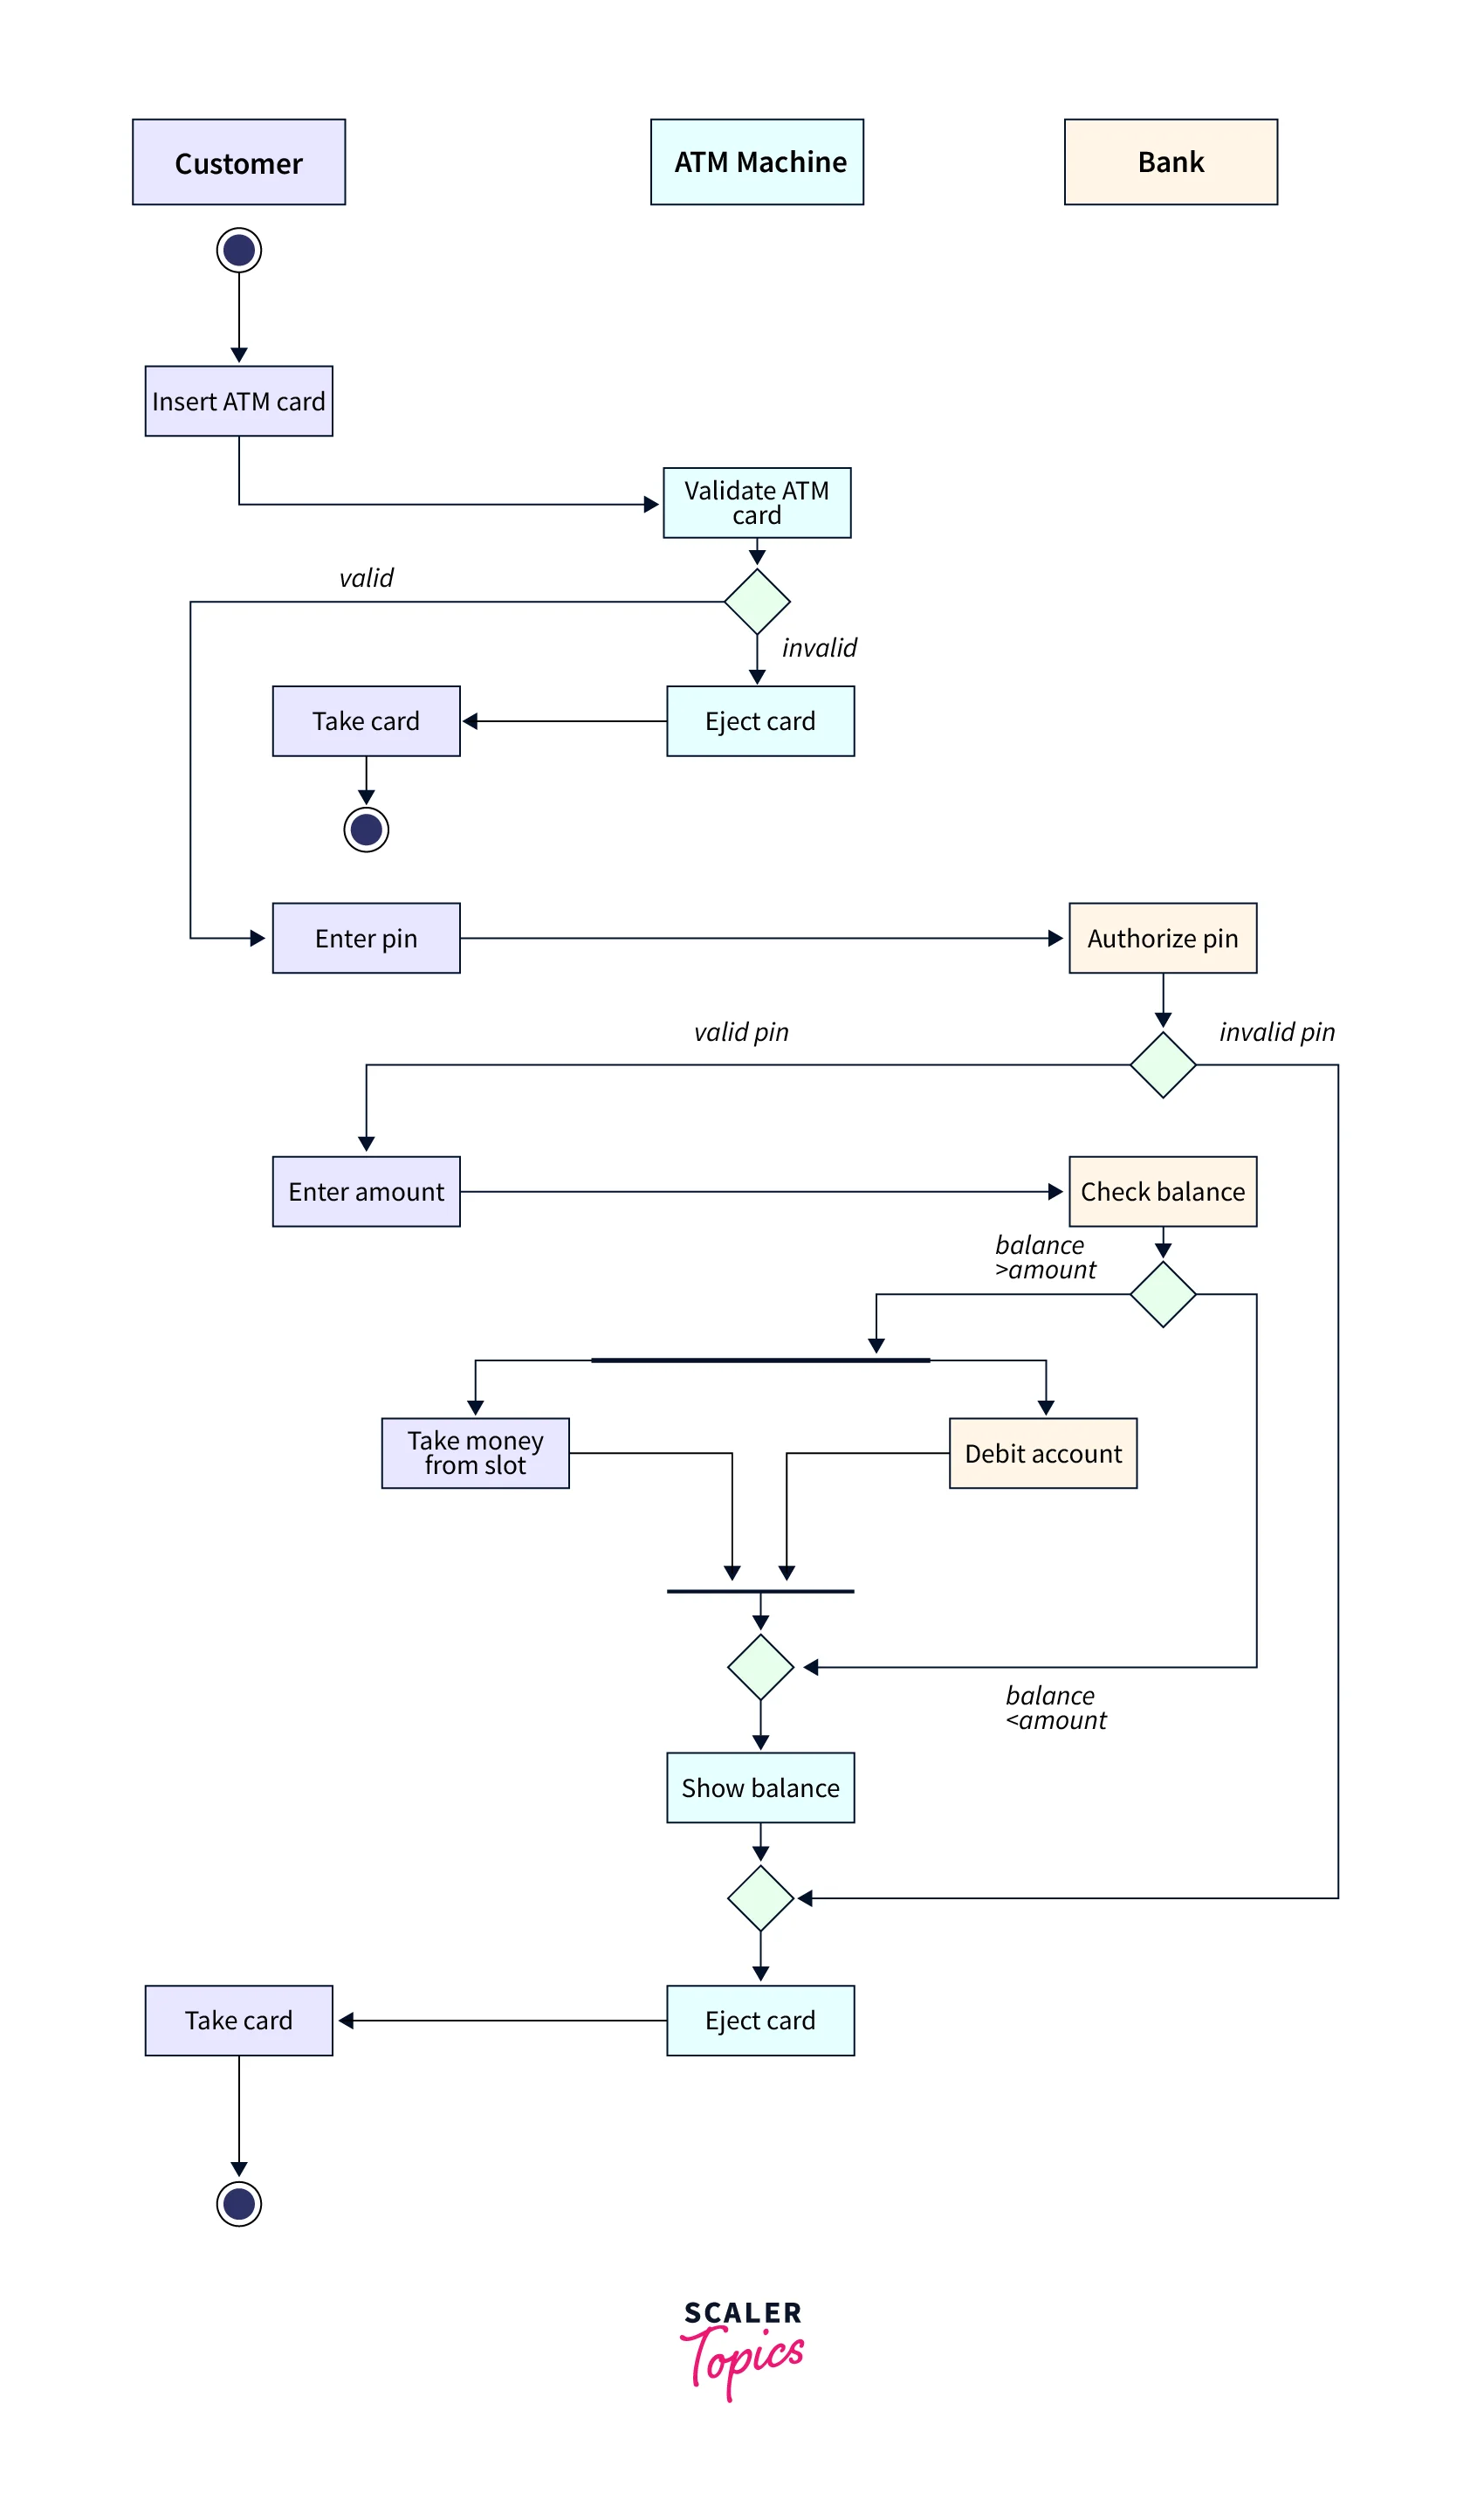
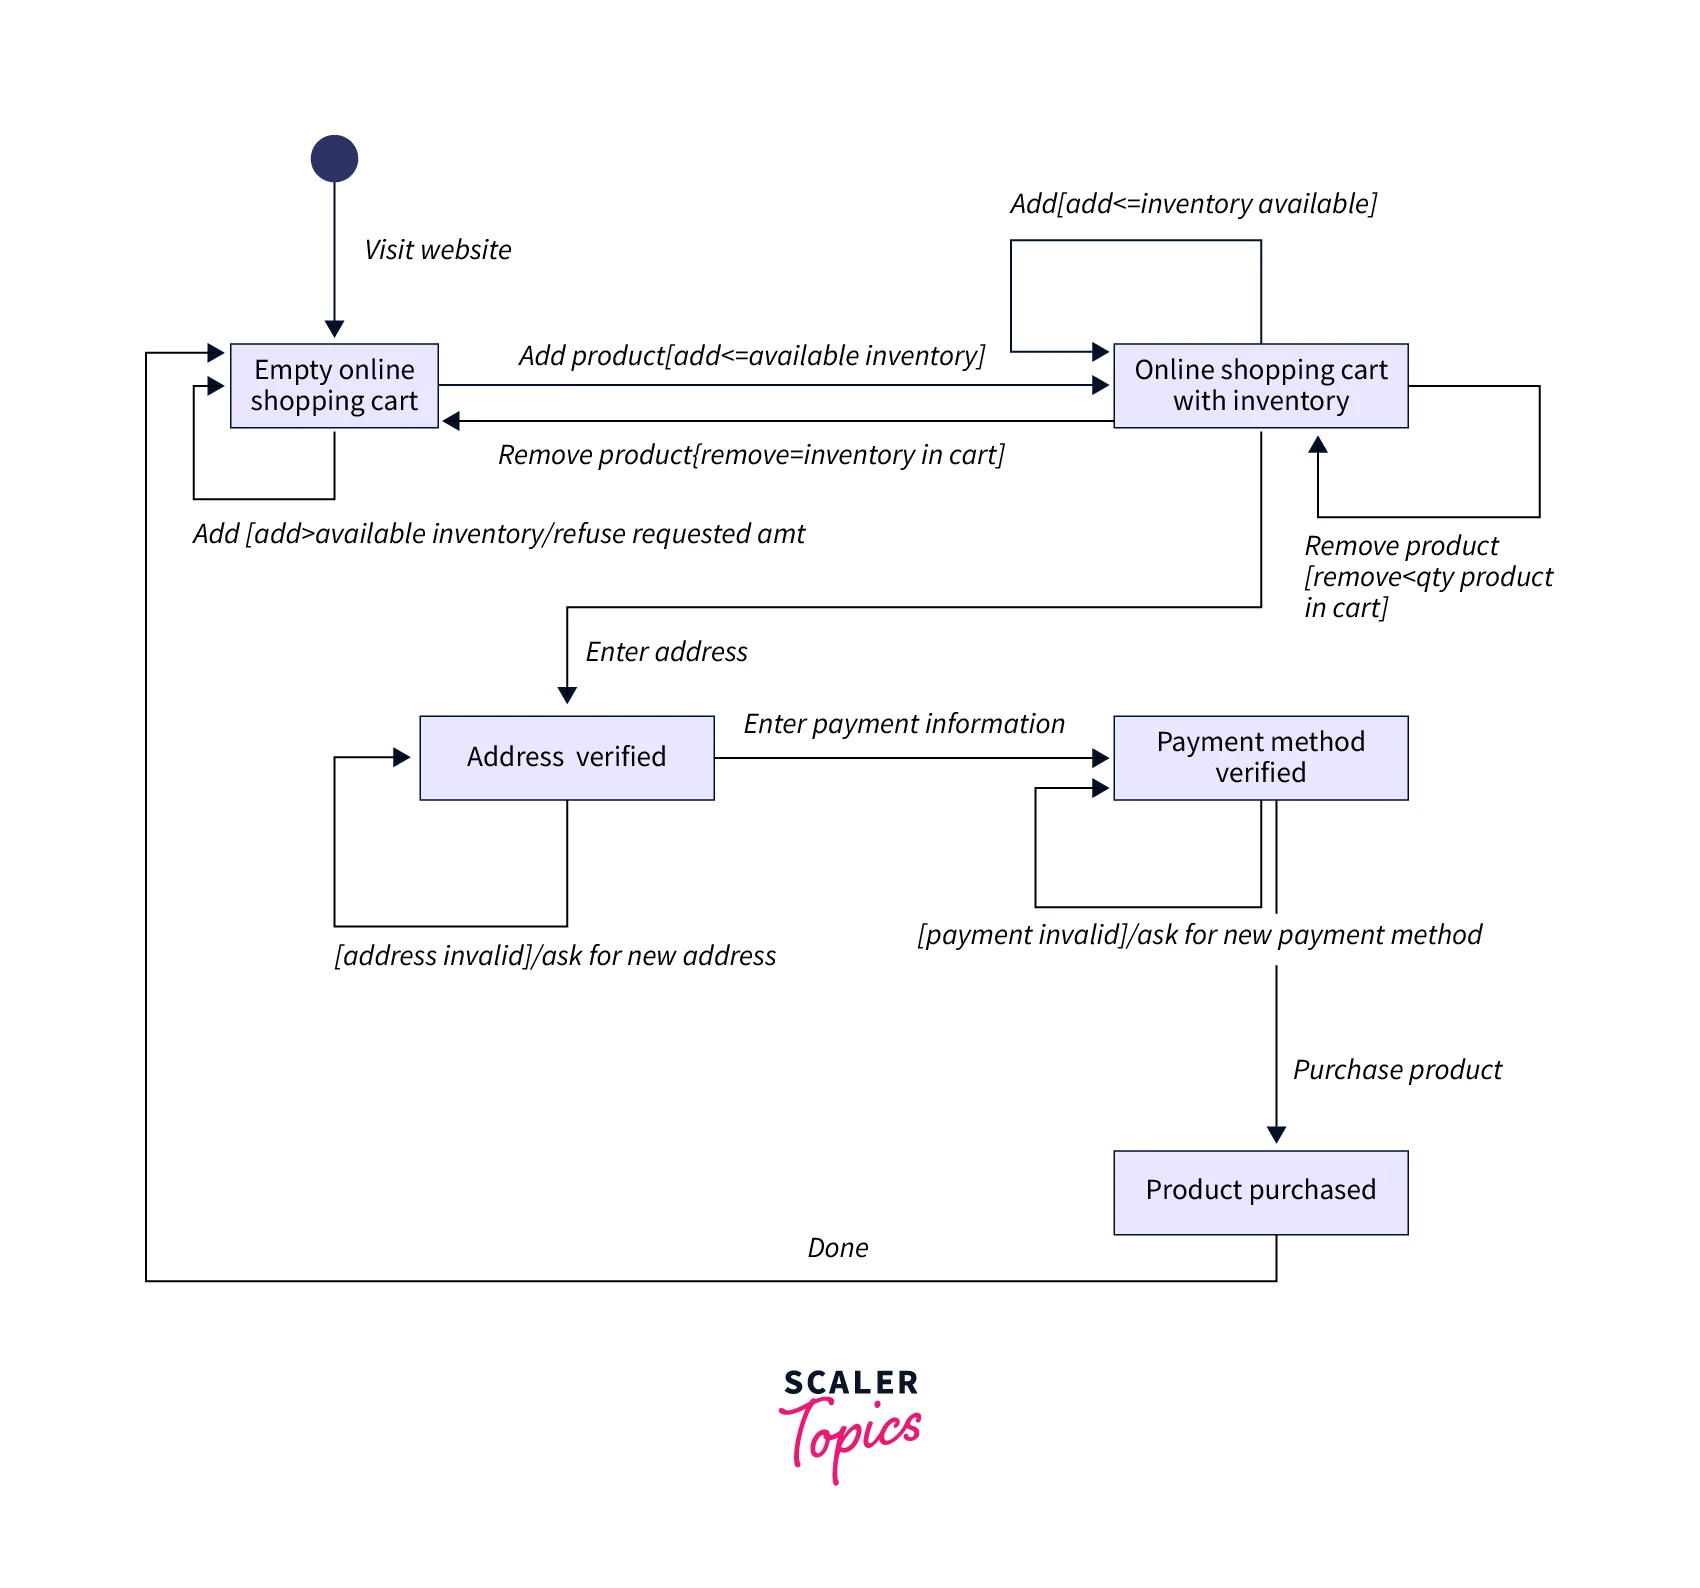
Activity Diagram
The flow of control in a system is depicted using an activity diagram. It is made up of activities and links. The flow of information might be sequential, concurrent, or branching. Activities are nothing more than system functions. A large number of activity diagrams are created to depict the whole flow of a system. The flow of controls in a system is visualized using activity diagrams. This is done to understand how the system will work when it is executed. Below is a sample activity diagram for an ATM system.
Transform Your Career
Choose from our industry-leading programs designed for career success
Modern Software and AI Engineering Program
Master full-stack development with AI integration

Modern Data Science and ML with specialisation in AI
Advanced data science techniques with AI specialization
Advanced AIML with Specialisation in Agentic AI
Deep dive into AIML with focus on Agentic systems
DevOps, Cloud & AI Platform Engineering
Build and manage AI-powered cloud infrastructure
AI Engineering Advanced Certification by IIT-Roorkee
Premier AI engineering certification from IIT-Roorkee
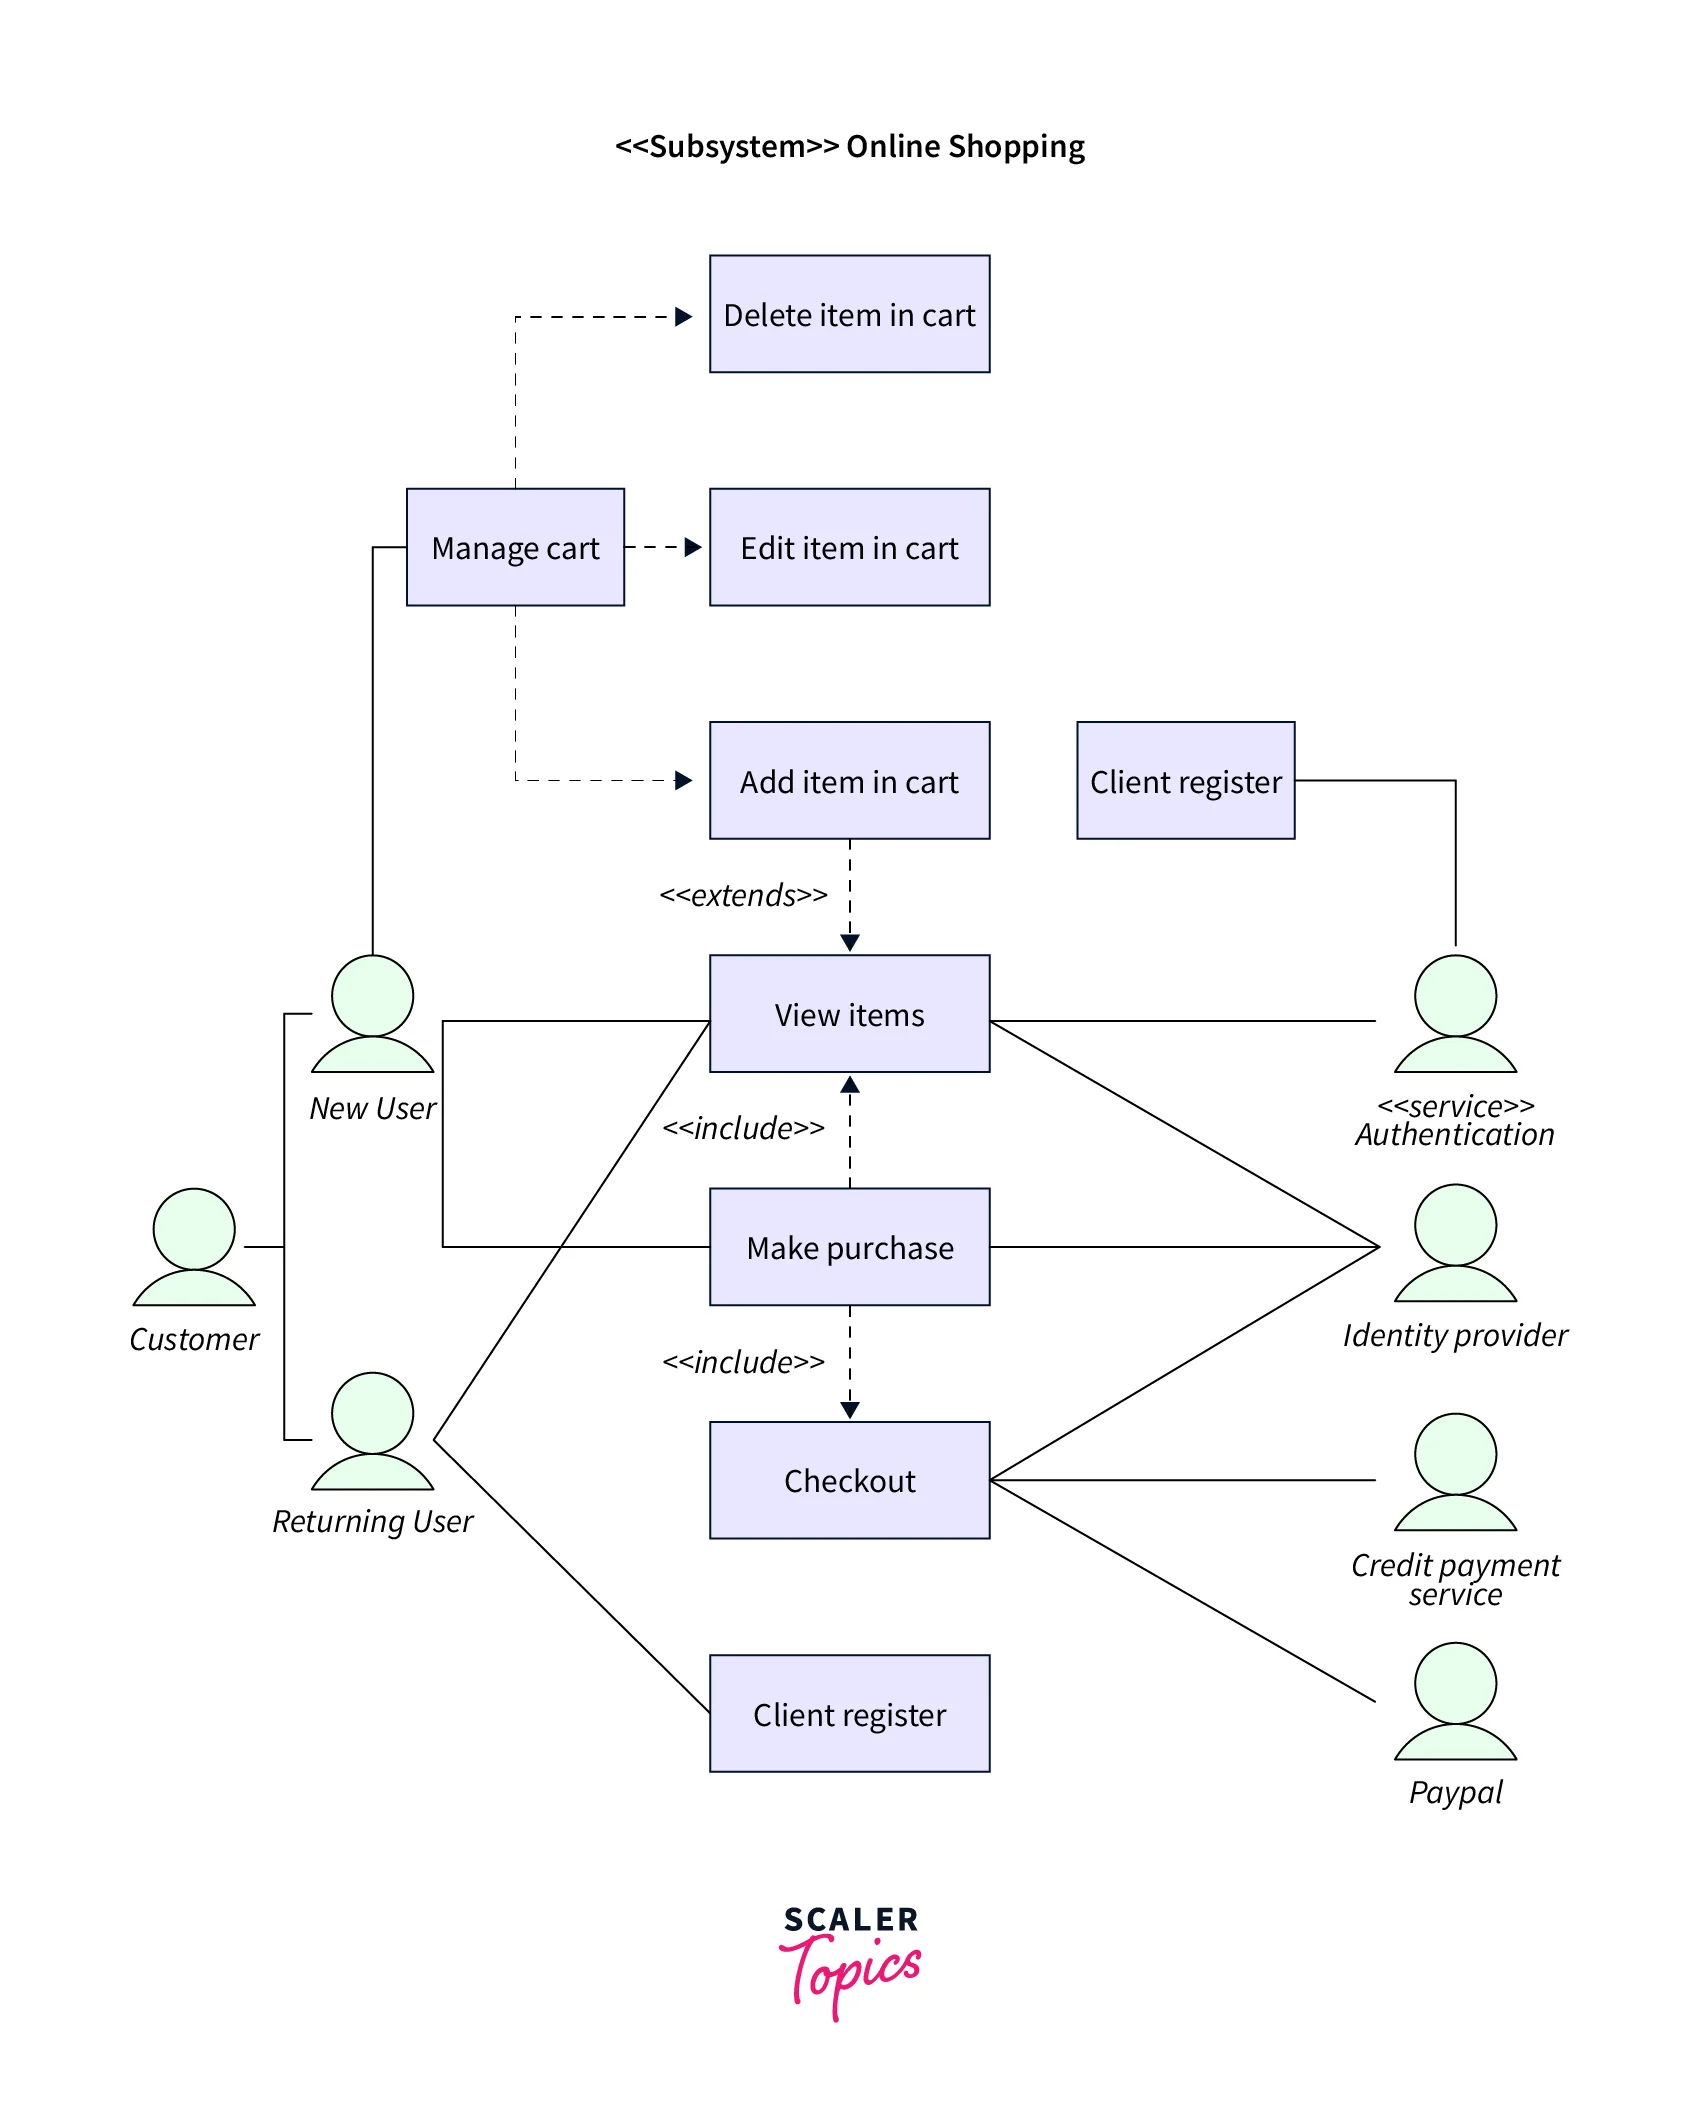
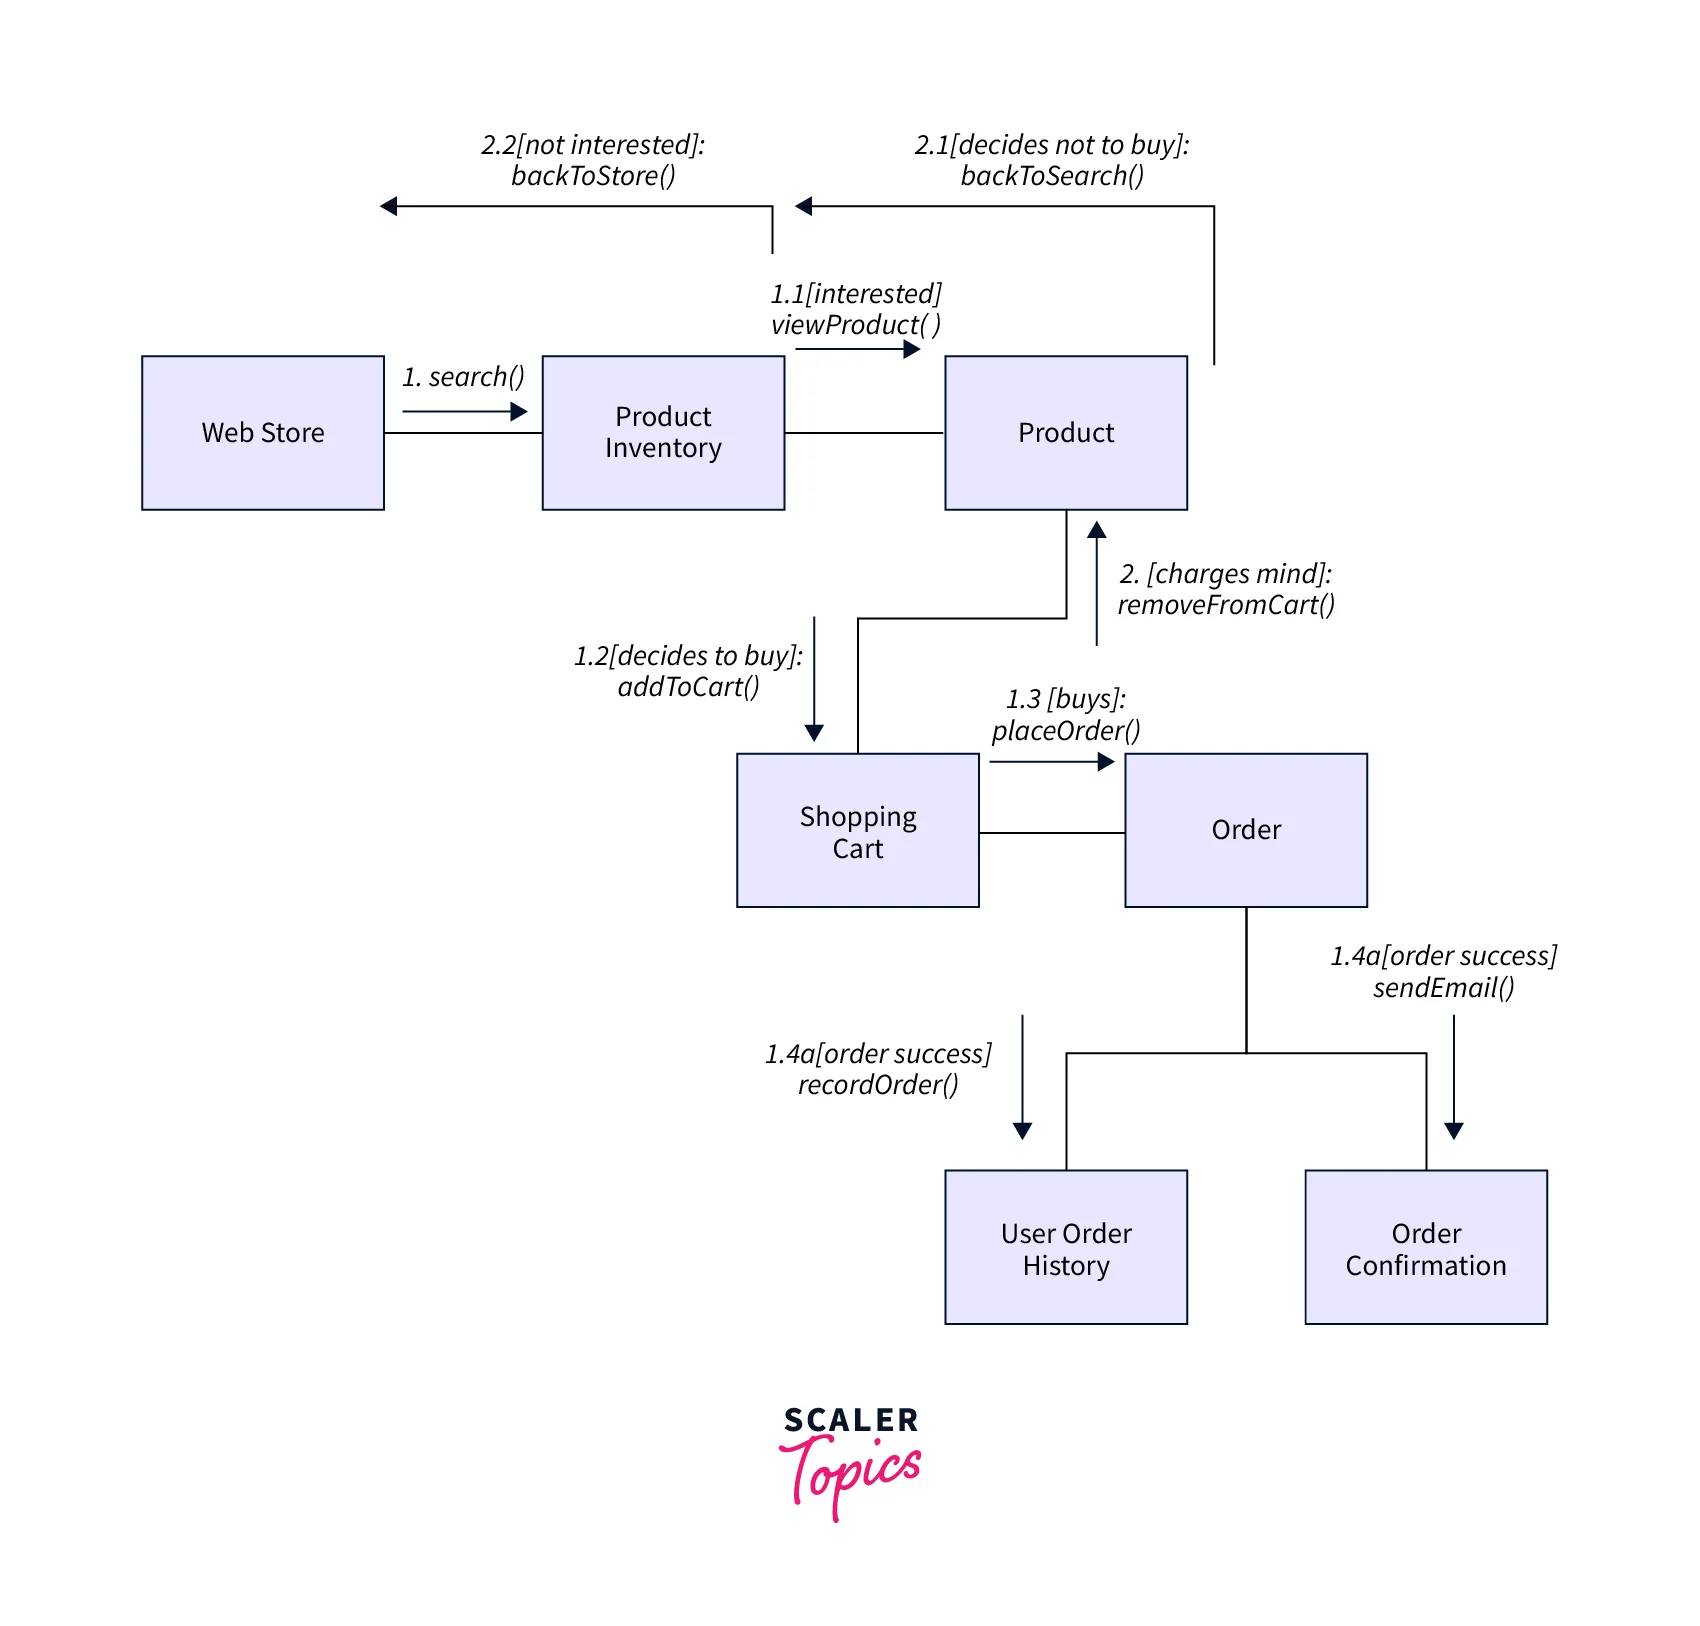
Use Case Diagram
A use case diagram is a collection of use cases, actors, and their interrelationships. They represent a system's use case view. A use case represents a certain system functionality. As a result, a use case diagram is utilized to describe the interactions between features and their internal/external controllers. These controllers are referred to as actors. Below is a sample use case diagram for an online shopping system.
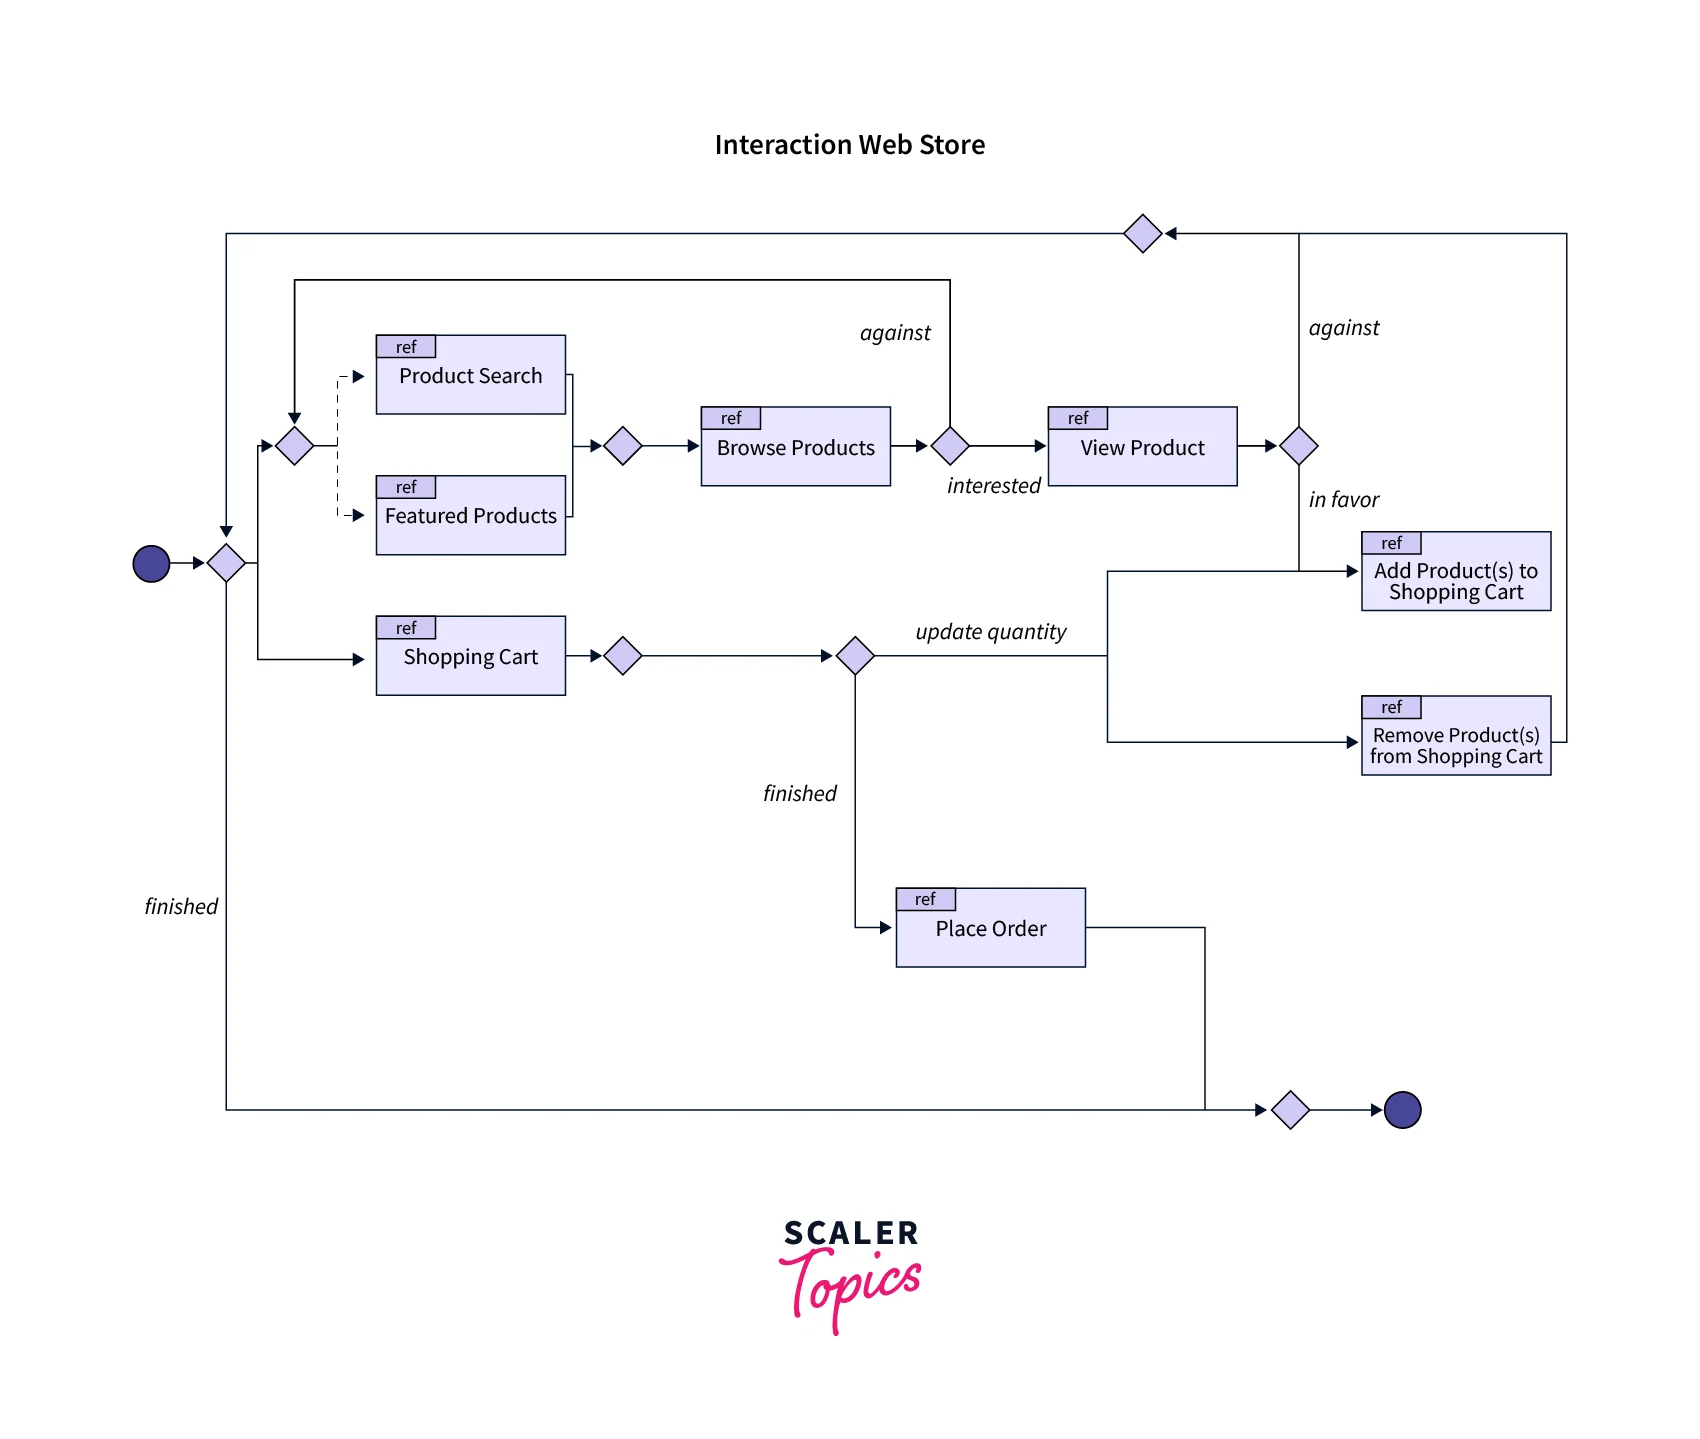
Interaction Overview Diagram
It is the one that can depict control flow as well as nodes with interaction diagrams. It is similar to the activity diagram in that both display the sequence of actions. Below is a sample interaction diagram.
Timing Diagram
When the focus of attention is on time, these diagrams are essentially required to represent relationships between objects. However, even if we aren't interested in knowing how things interact or even change each other, we do want to portray how these items, like actors, would act along a linear time axis.
State Machine / State Chart Diagram
Any real-time system is supposed to respond to internal/external events. These events are accountable for the system's state change. A state chart diagram is used to show a system's event-driven state change. It essentially defines the change in the state of a class, interface, etc. In addition, a state chart diagram is used to depict a system's reaction to internal/external variables. Below is a sample state machine diagram.
Communication Diagram
Communication diagrams, like sequence diagrams, are types of interaction diagrams that show how things interact. It is an object diagram extension that depicts objects with messages that go from one to another. Below is a sample communication diagram.
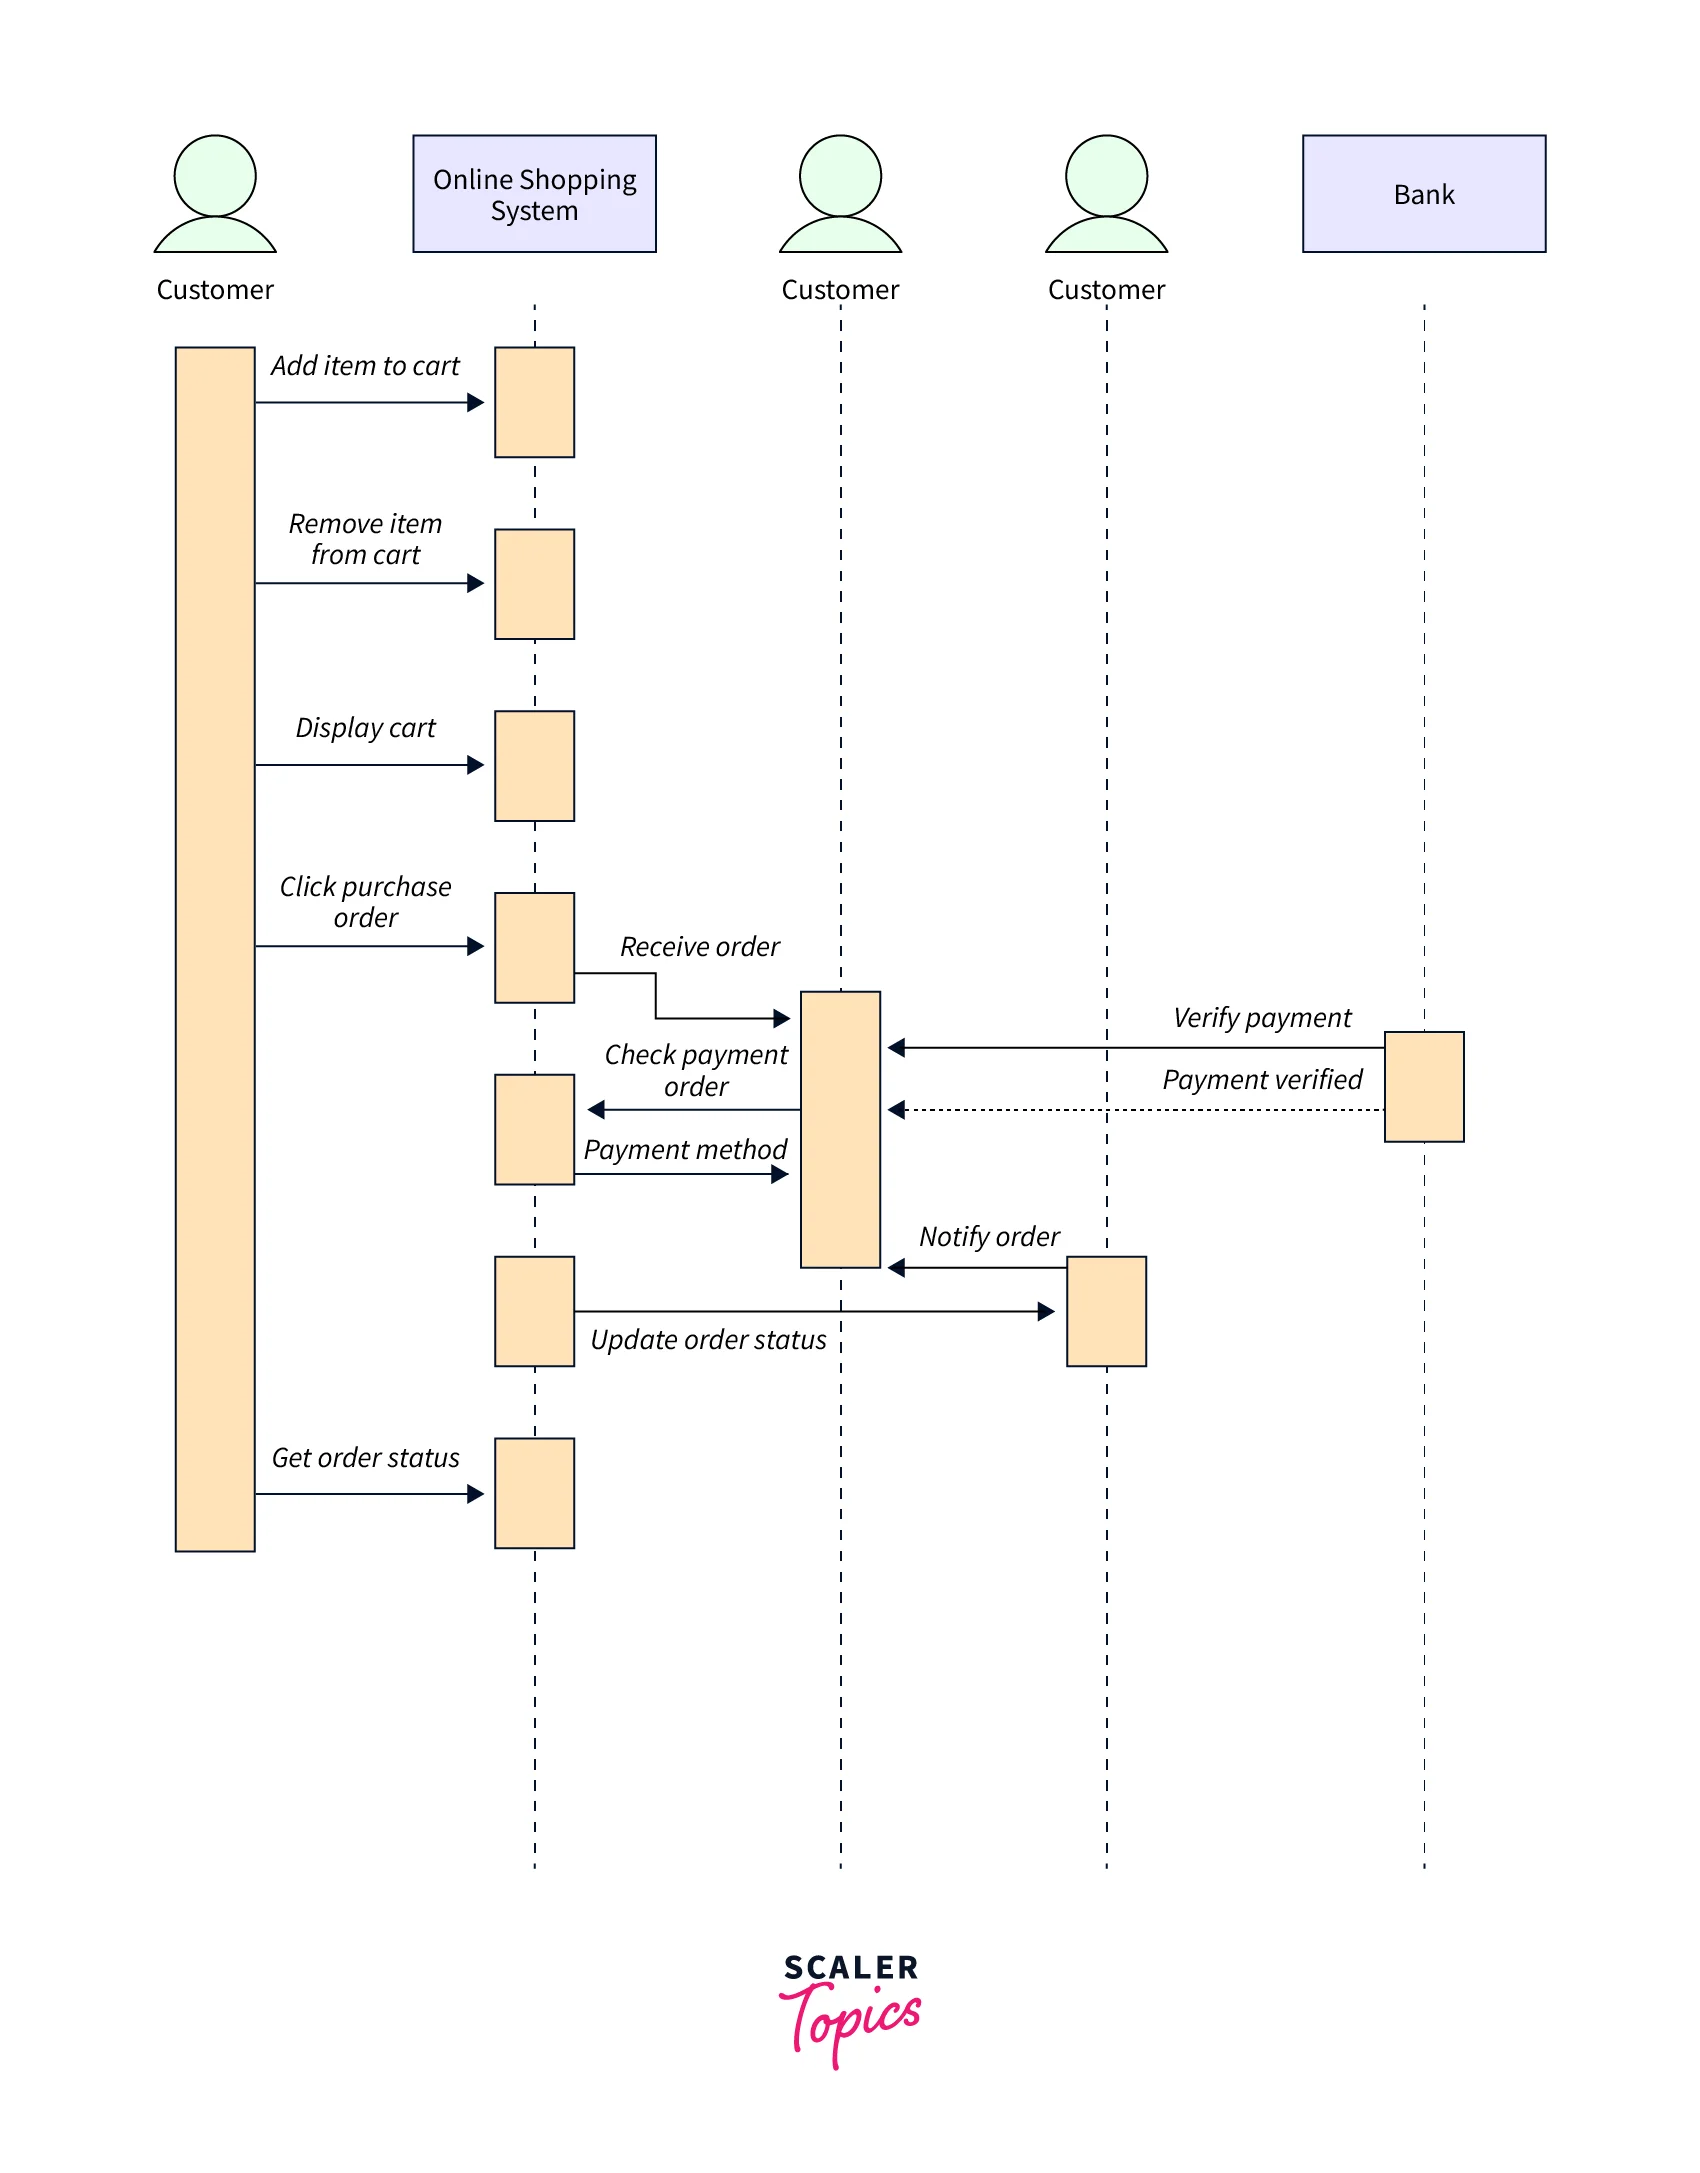
Sequence Diagram
A sequence diagram is a type of interaction diagram. The name implies that the diagram deals with some sequences, which are messages moving from one item to another. Interaction between system components is critical in terms of implementation and execution. A sequence diagram is used to depict the series of calls made by a system to perform a given function. Below is a sample sequence diagram for online shopping.
Turn Learning into Career Growth
Structural UML Diagrams
As the name implies, structural UML diagrams depict how the system is structured, including the classes, objects, packages, components, and so on, as well as the relationships between those parts.
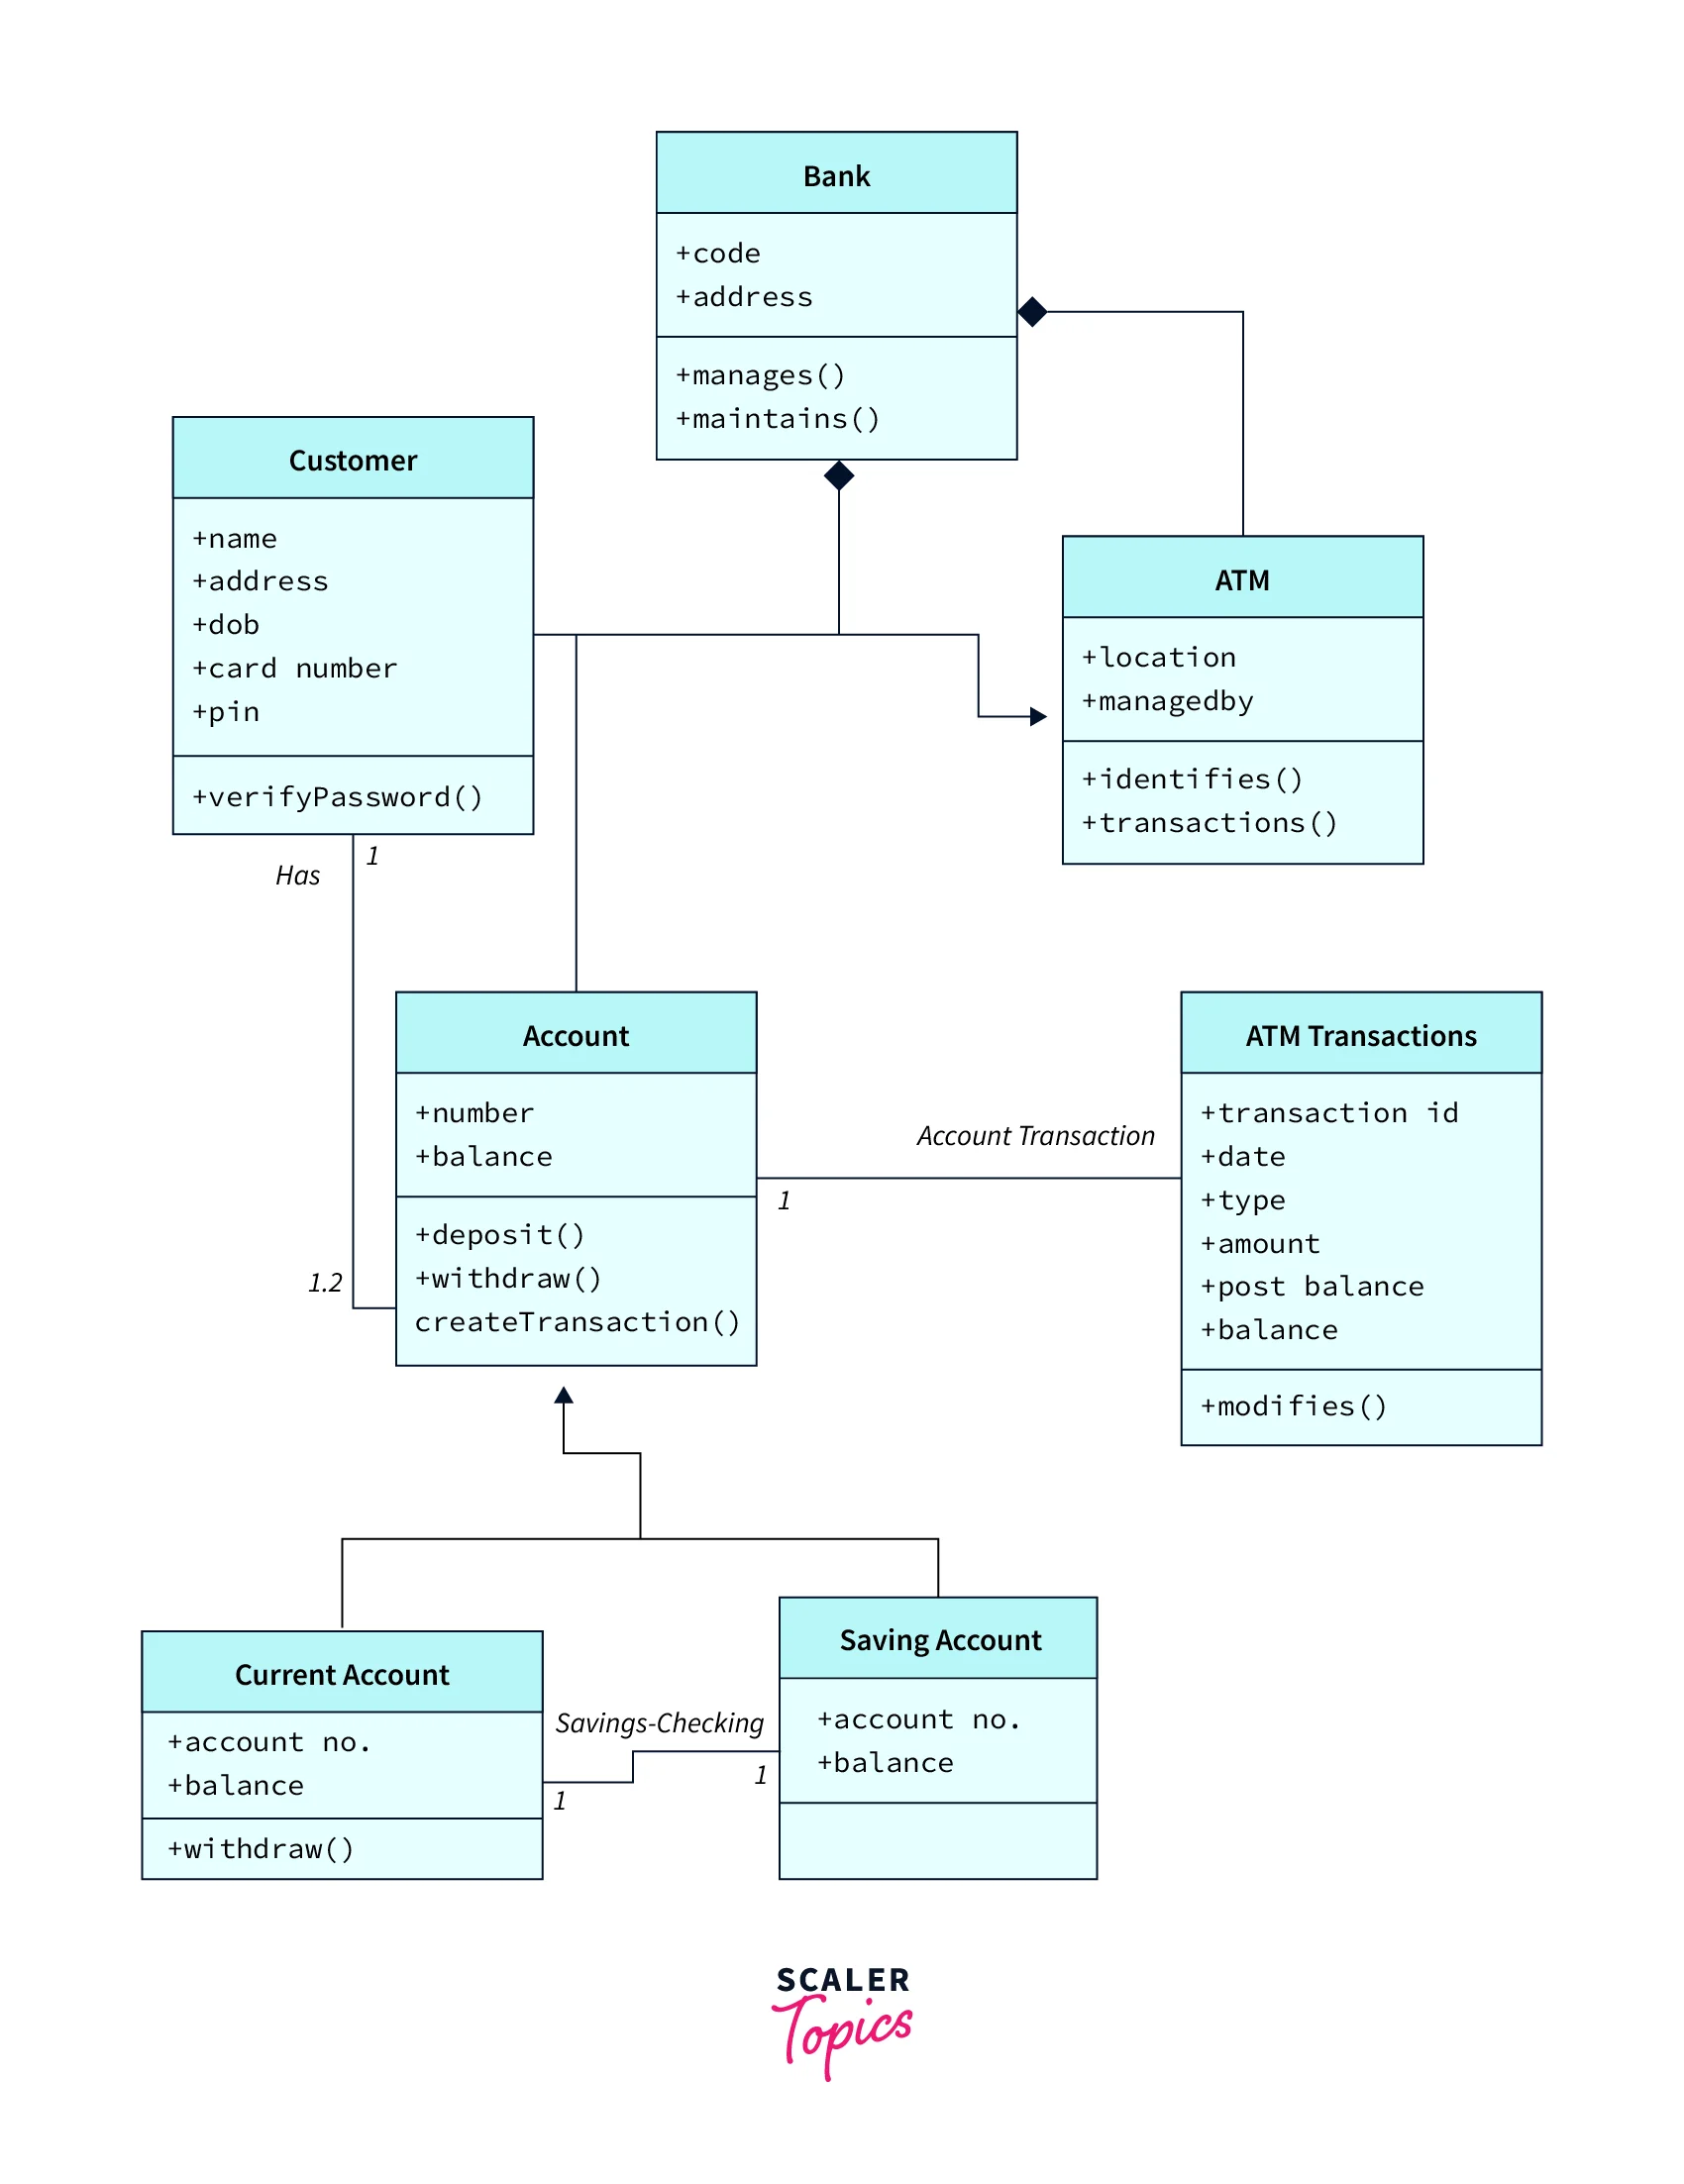
Class Diagram
Class diagrams are one of the most common types of diagrams. It is the foundation of all object-oriented software systems. It illustrates the system's static structure. It aids in recognizing the relationship between various objects and classes. Classes, interfaces, relationships, and collaboration are all represented in a class diagram. Class diagrams essentially depict the static object-oriented representation of a system. Following is a class diagram for an ATM system, for example.
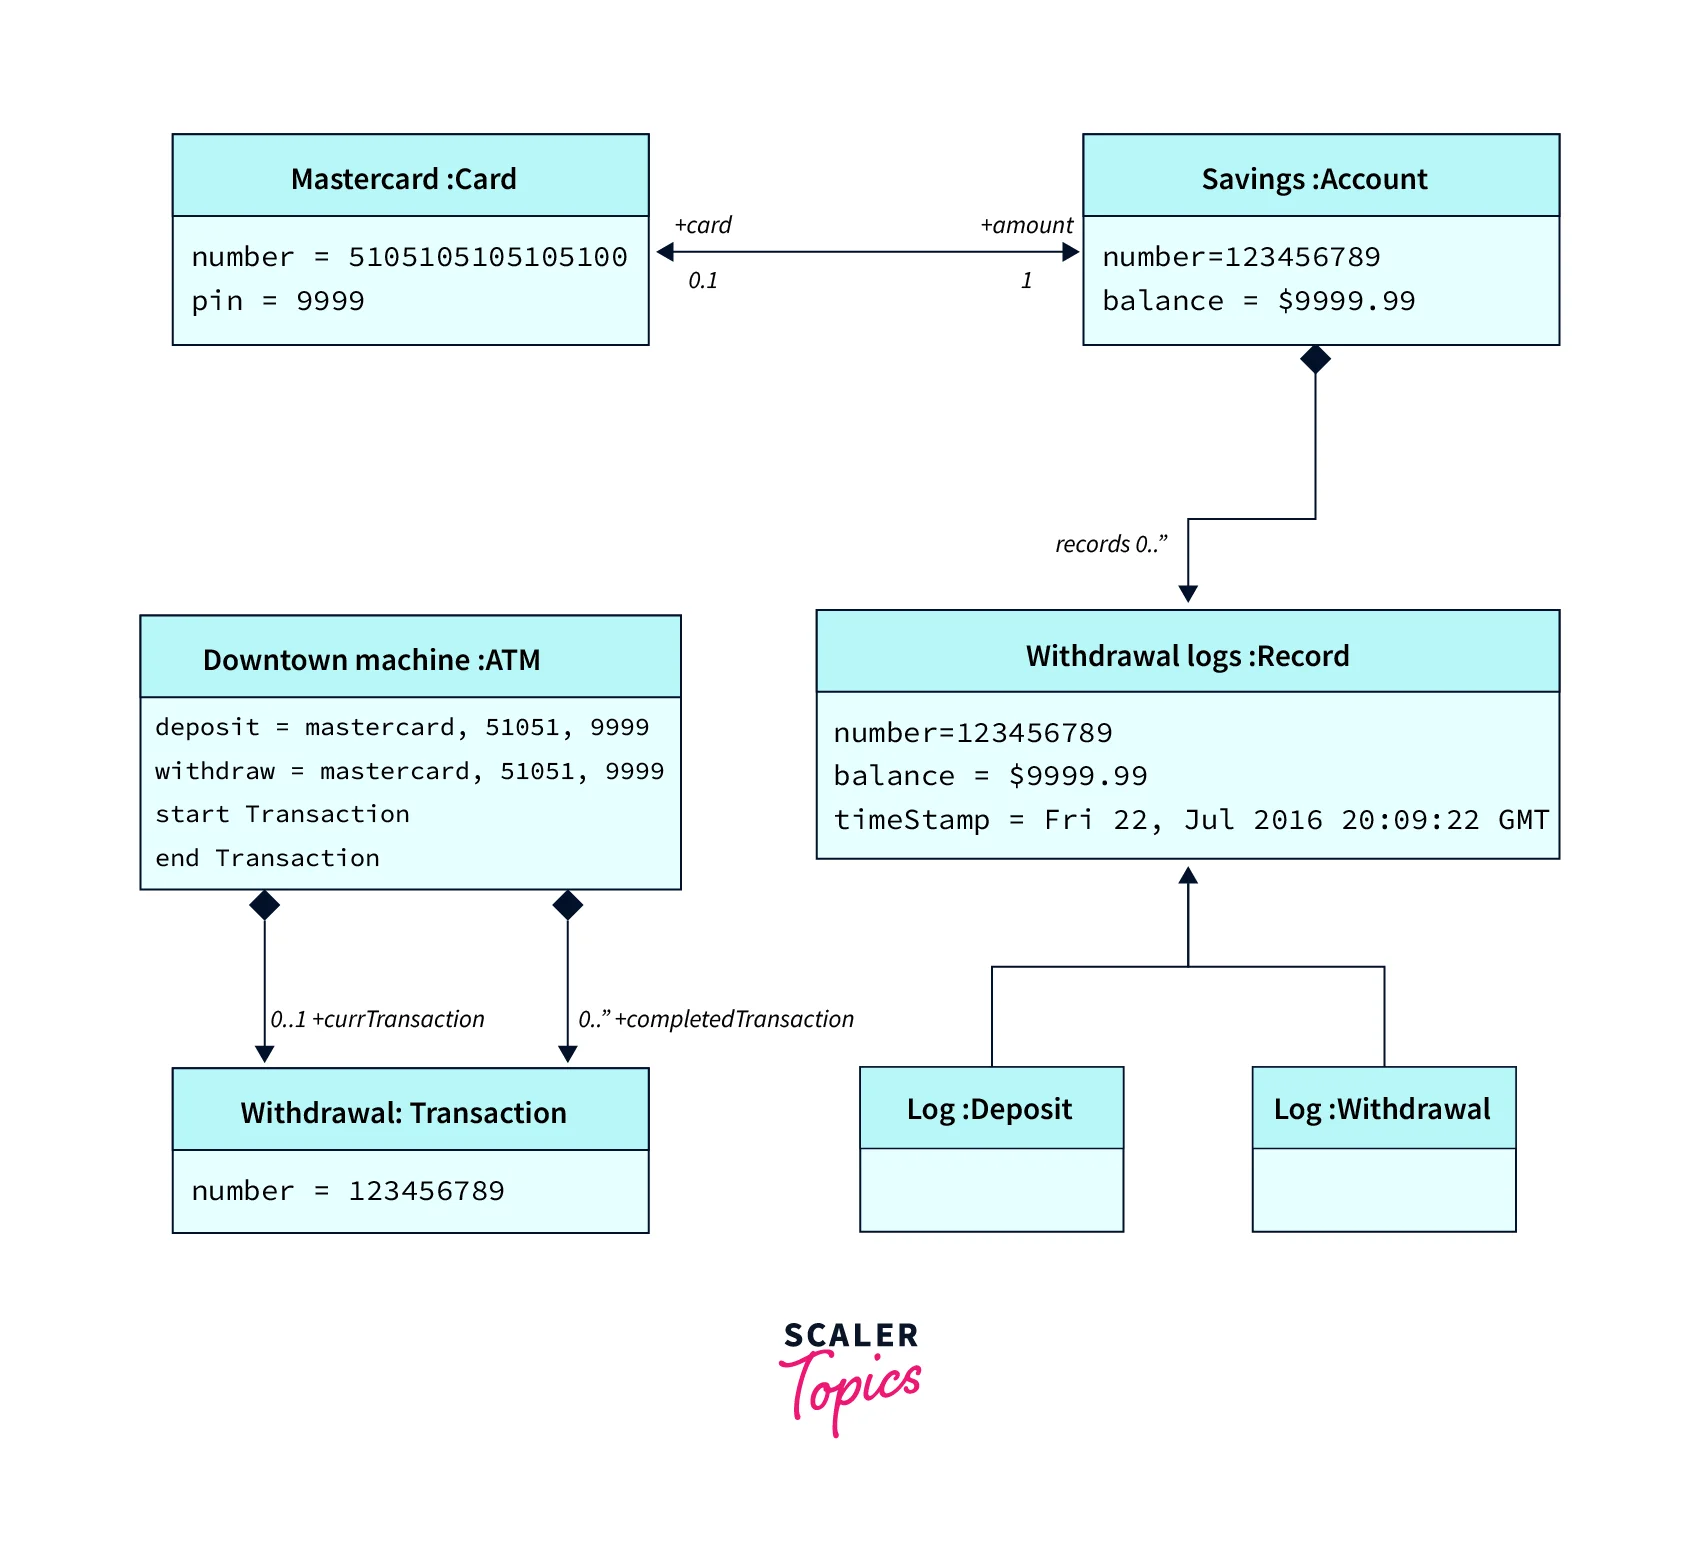
Object Diagram
Class diagrams can be used to describe object diagrams. As a result, these diagrams are more akin to real-world circumstances in which we design a system. Object diagrams are a collection of items with the same relationship as class diagrams. They also represent the system's static view. Object diagrams are used in the same way as class diagrams, except they are used to create a practical prototype of a system. Below is a sample object diagram for an ATM system.
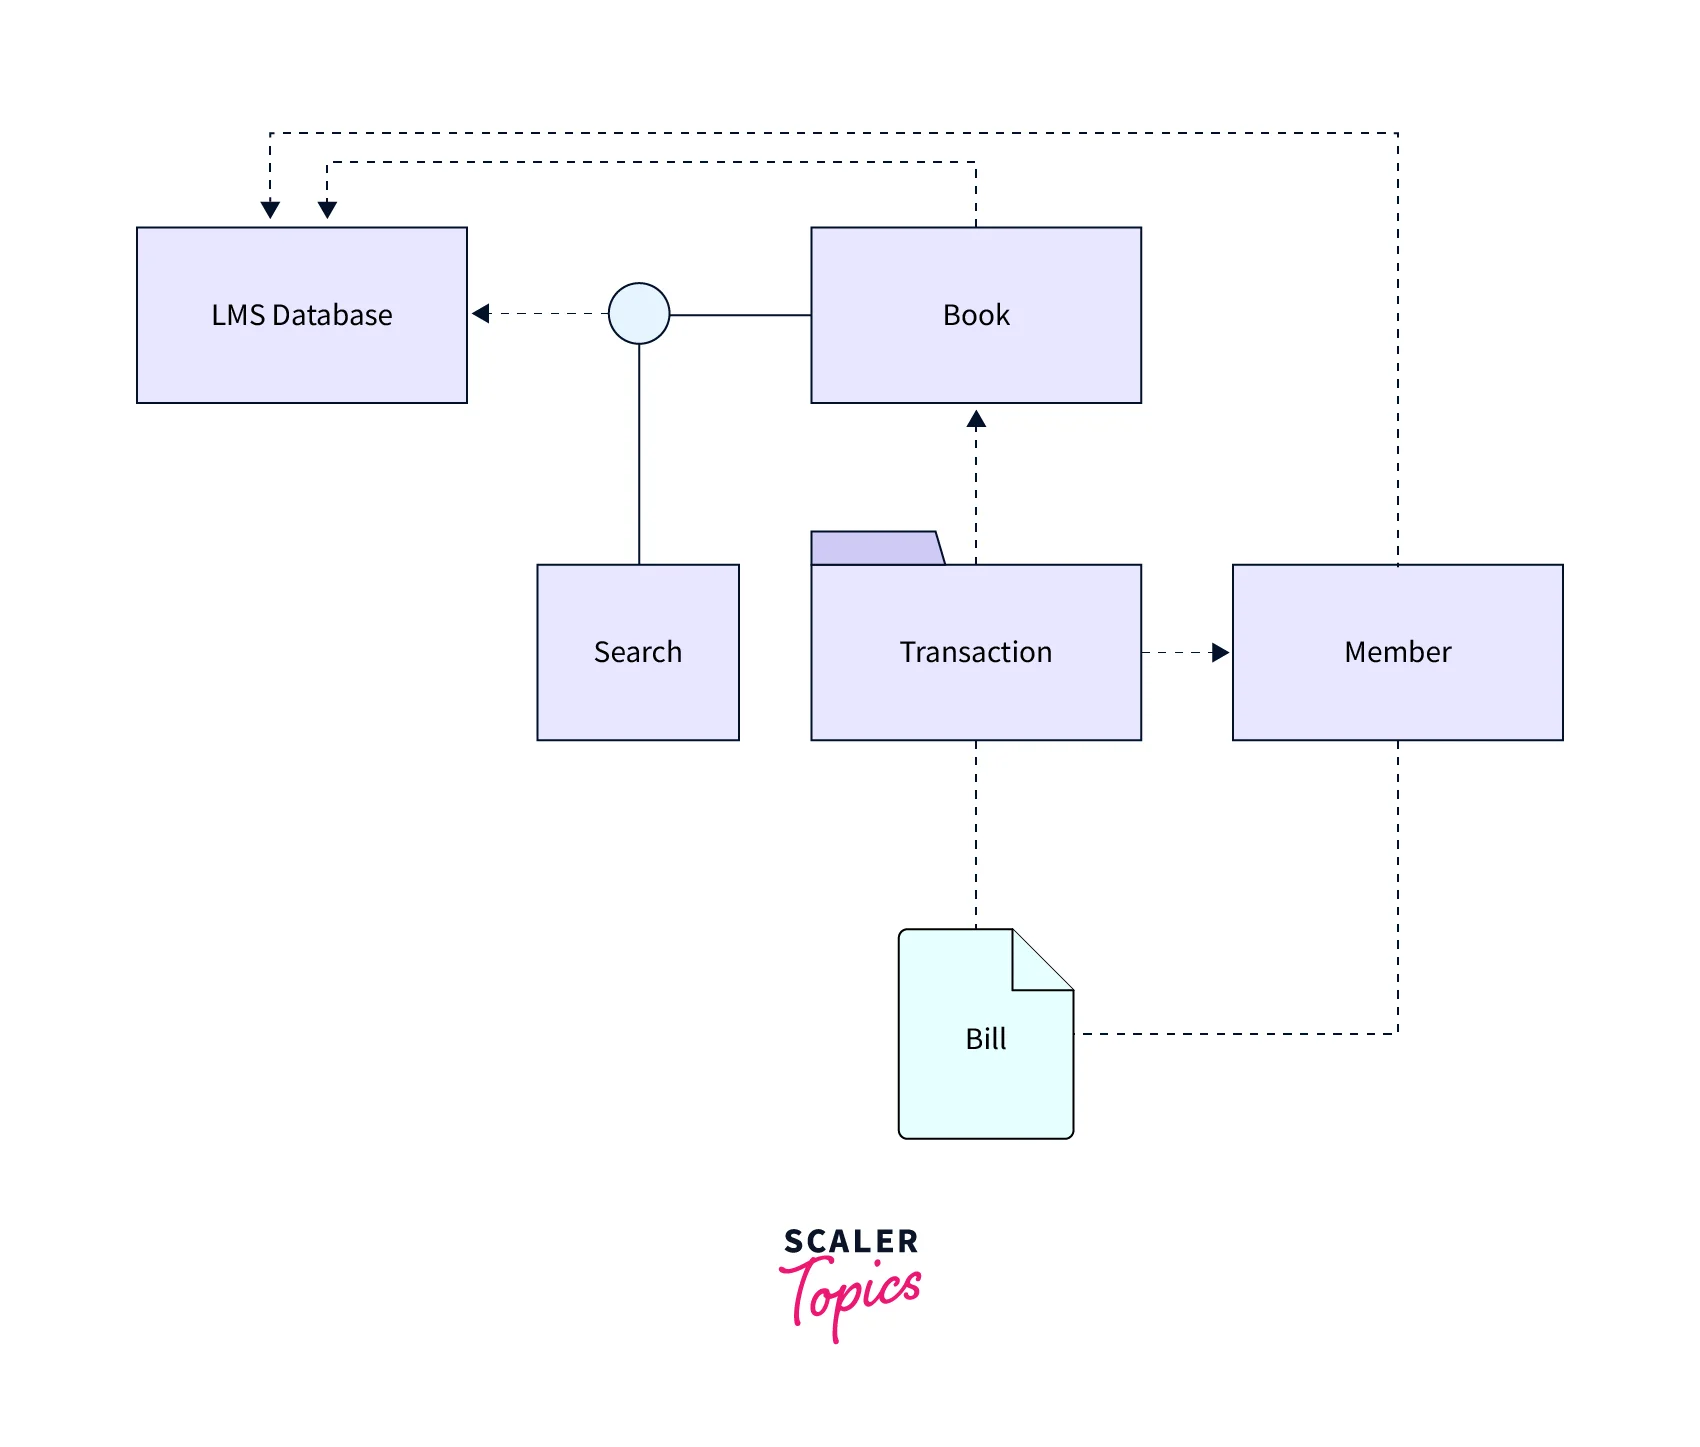
Component Diagram
Component diagrams depict a group of components and their connections. Classes, interfaces, and collaborations are examples of these components. Component diagrams depict a system's implementation view. During the design phase, software artifacts (classes, interfaces, and so on) of a system are organized into groups based on their relationship. These groups are now referred to as components. Finally, component diagrams can be utilized to visualize implementation. Following is a component diagram for a library management system, for example.
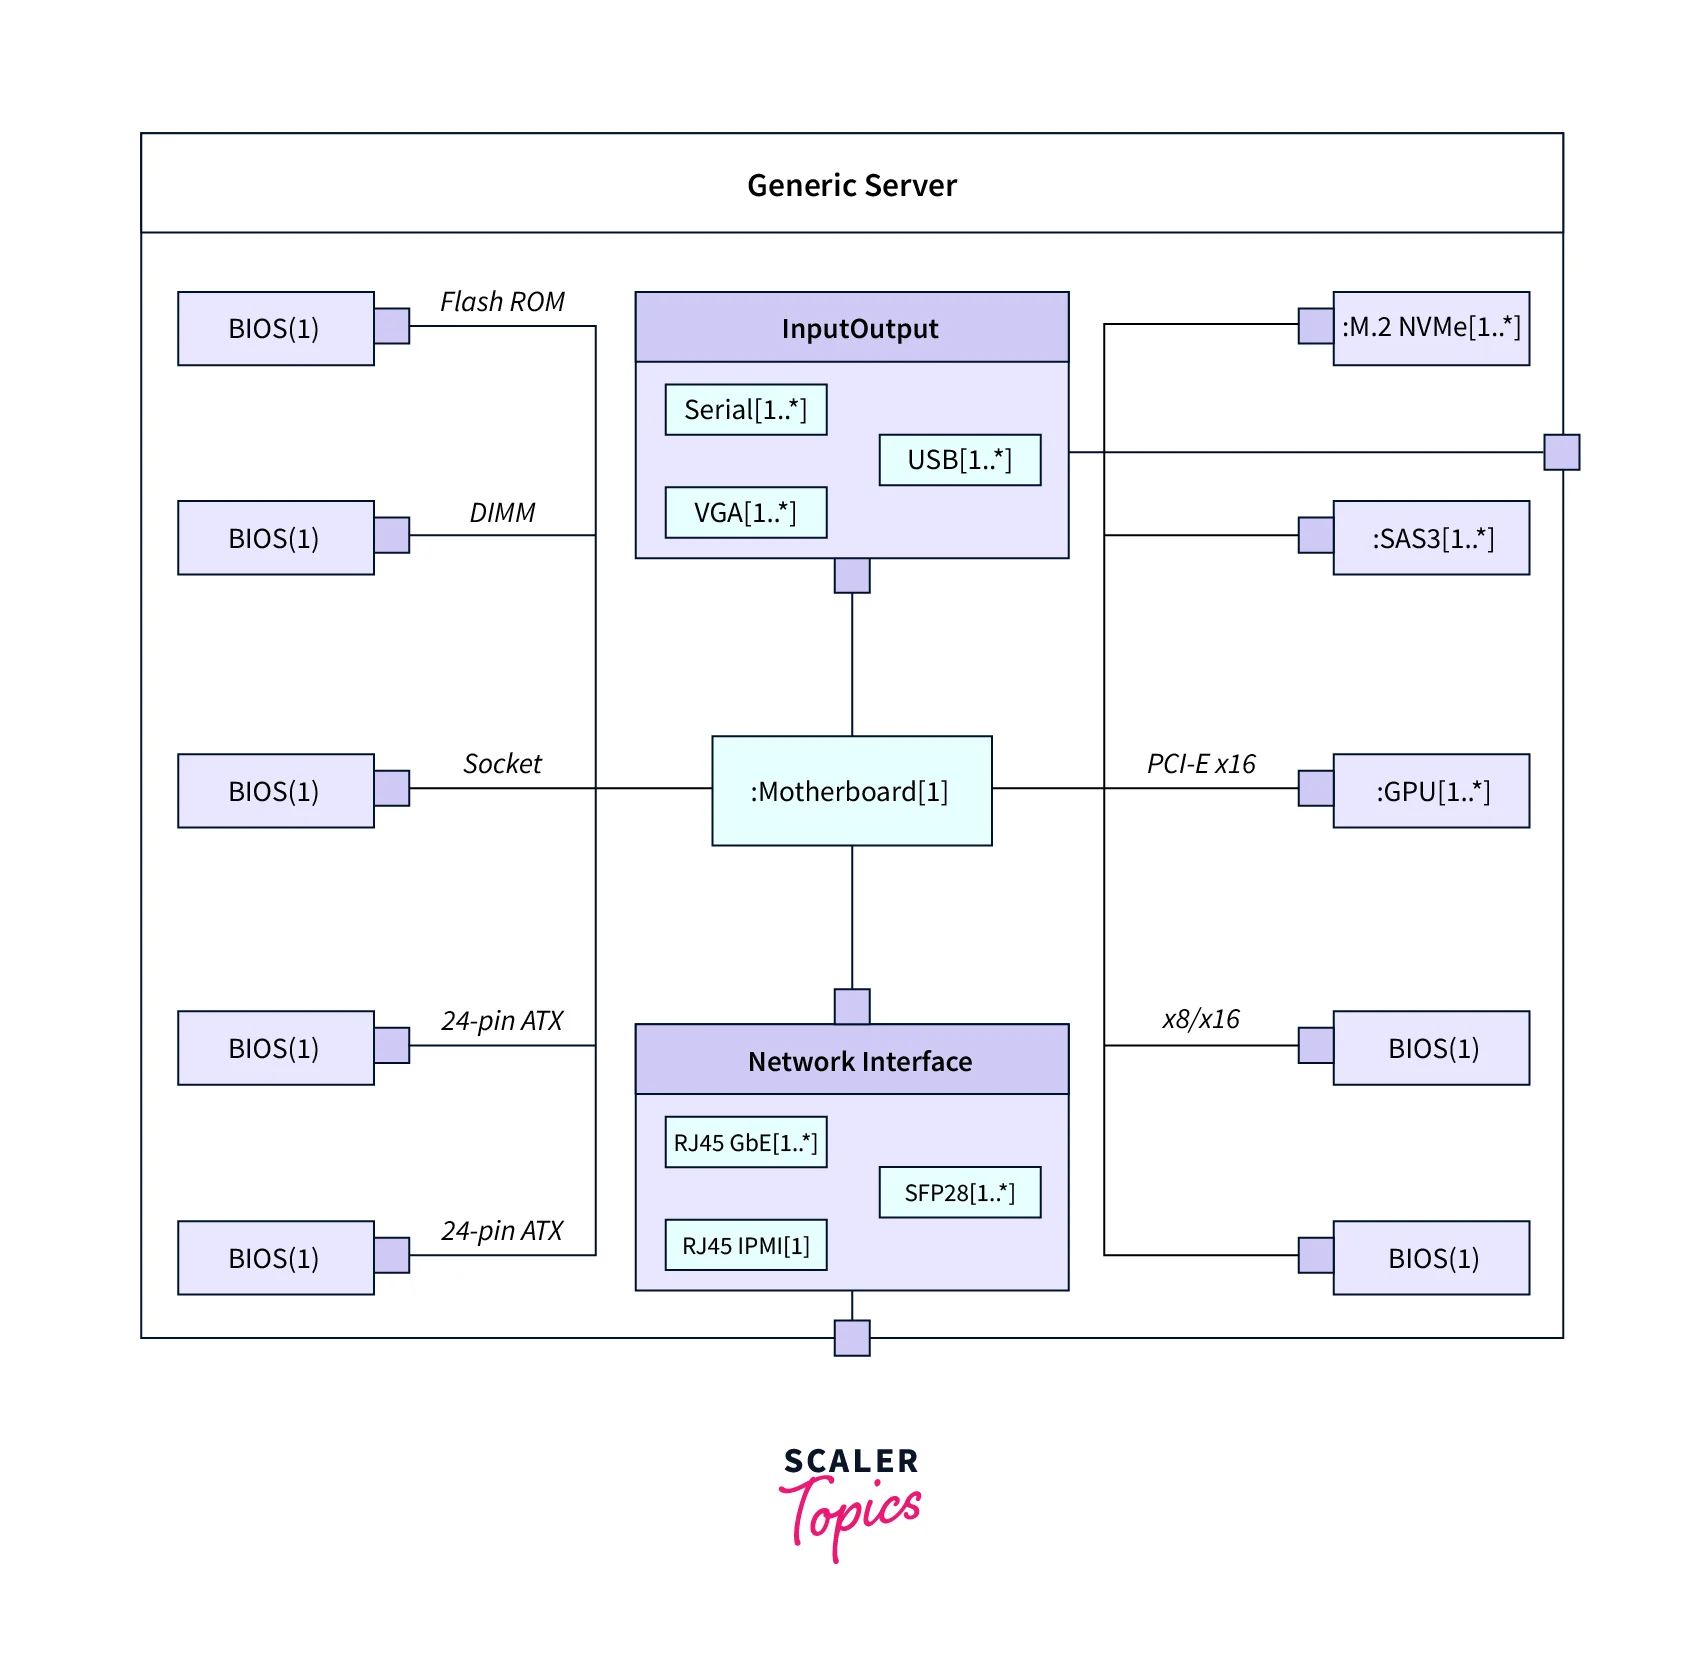
Composite Structure Diagram
These diagrams are essentially the blueprints for a classifier's internal structure. They can also be used to demonstrate how a collaboration or a classifier interacts with their environment via ports. They can quickly represent the internal components of any hardware to gain a better understanding of its inner workings.
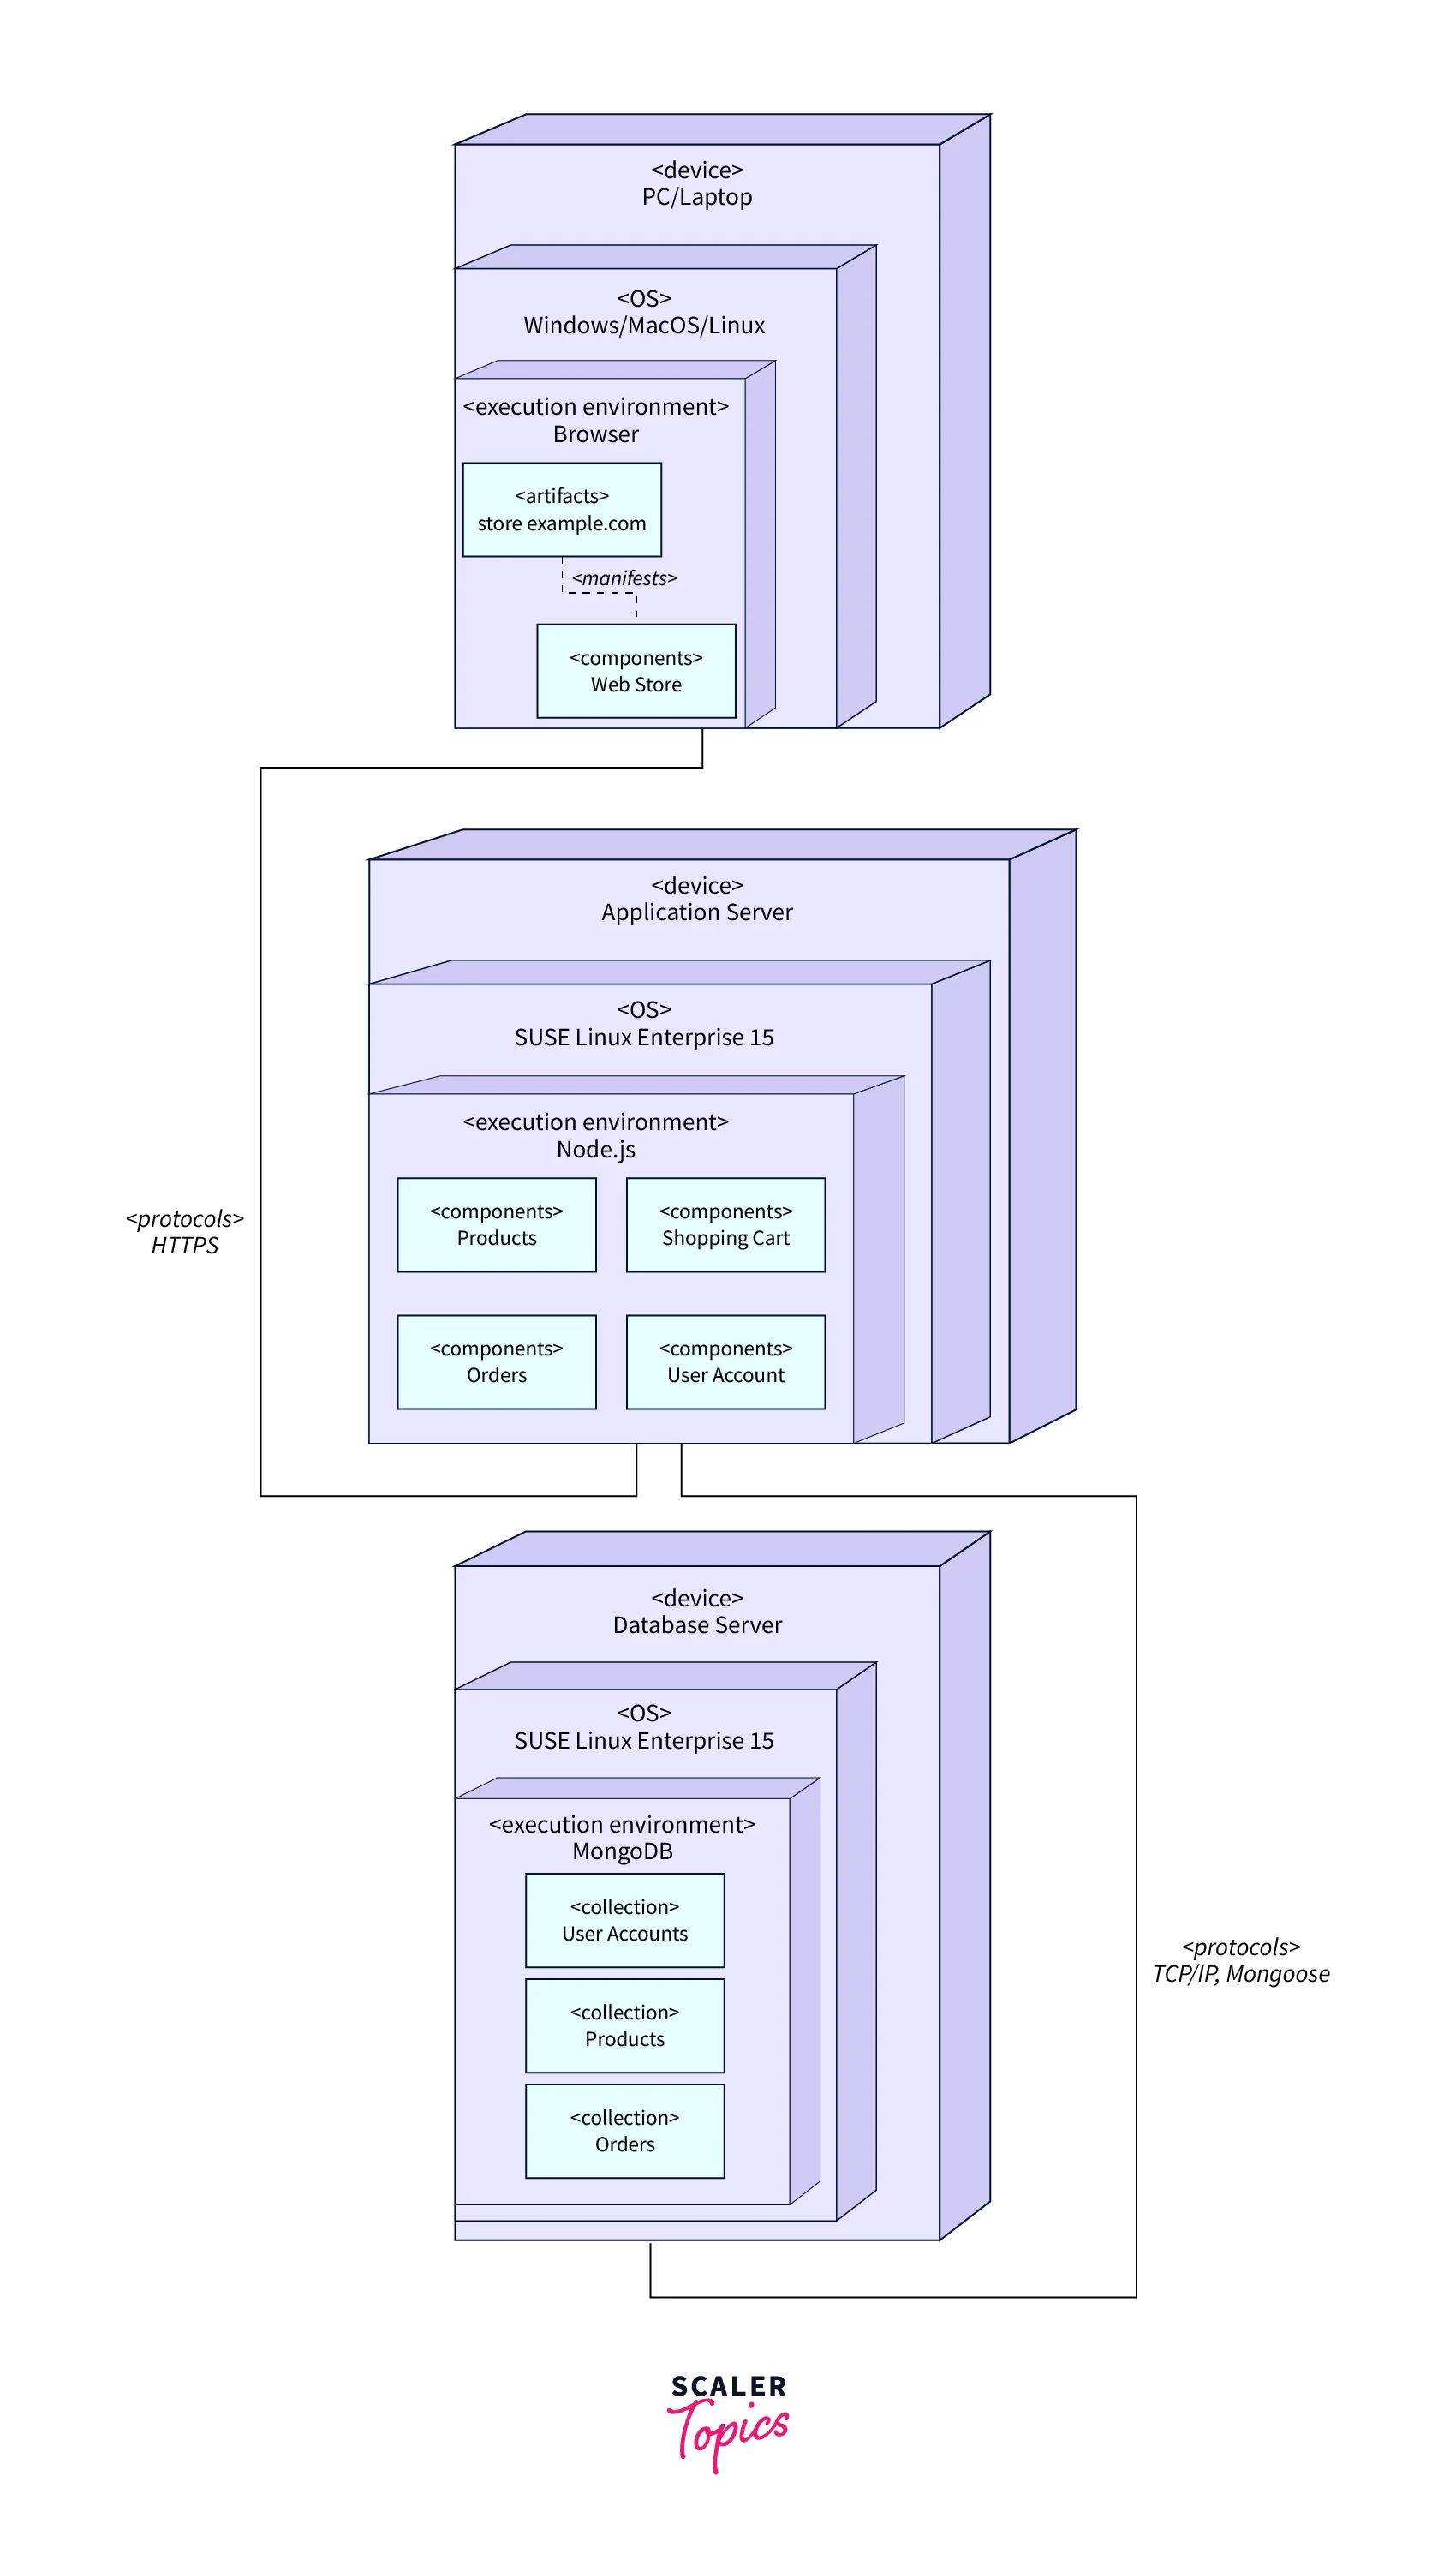
Deployment Diagram
Deployment diagrams are made up of nodes and their connections. These nodes are physical entities that house the components. Deployment diagrams are used to depict a system's deployment view. The deployment team typically employs this. Below is a sample deployment diagram.
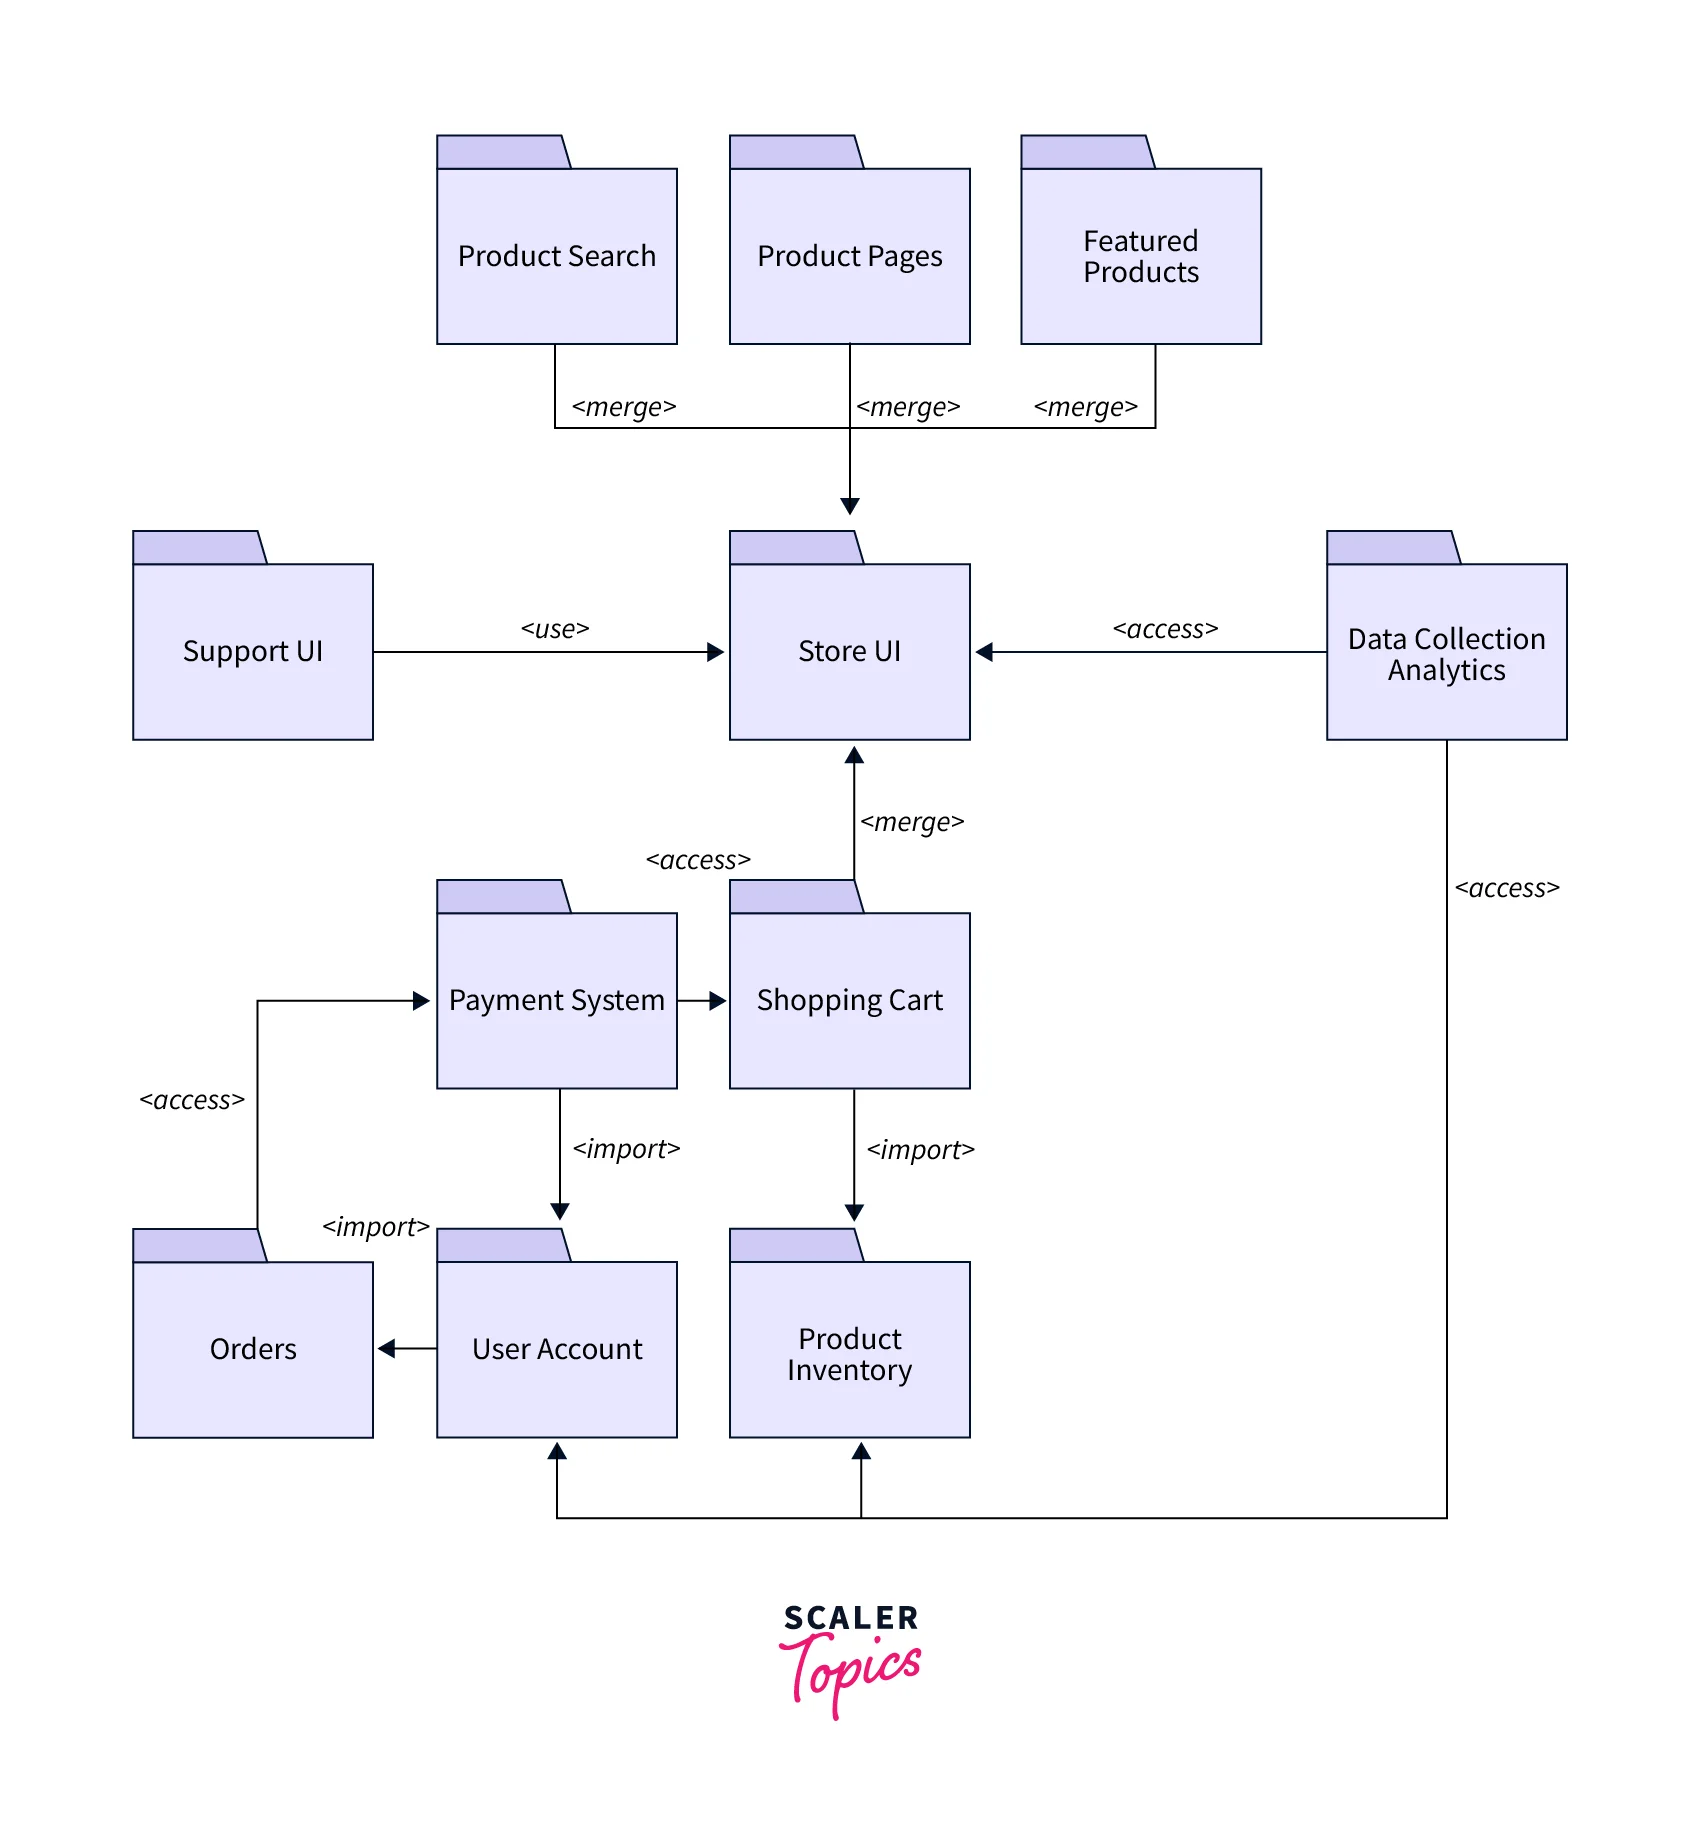
Package Diagram
The package diagram appears to be more of a macro container required for the deployment of UML diagrams, as previously discussed. Different packages now include nodes as well as artifacts. They organize the components and model diagrams into groups in the same way that a namespace might encapsulate many names that are quite connected in some way. Below is a sample package diagram.
Profile Diagram
Profile diagrams are not the conventional form of UML diagrams. Regardless, it is more of an extensible tool than a diagram type like any other. We may simply extend and alter existing UML notations by using stereotypes, restrictions, and tagged values. Profile diagrams, on the other hand, are similar to a language. For instance, if you speak English, you can simply construct new sentences. Similarly, if you speak profile diagrams, you can quickly and precisely build new characteristics and semantics for UML diagrams.
Scaler Placement Report and Statistics
Scaler learners achieved 2.5x salary growth with average post-Scaler CTC reaching ₹23L.
Conclusion
- UML (Unified Modeling Language) is a graphical modeling language that is used in the field of software engineering. It specifies, visualizes, builds, and documents the software system’s artifacts (main elements).
- UML provides many sorts of diagrams to depict the operation of a system or programme in pictorial format, which can be classified into two groups: structural diagrams and behavioral diagrams.
- The static components of the system are represented by the structural diagrams. These static elements represent the stable and major structural elements of a diagram. Classes face, objects, components, and nodes provide representations for these static elements.
- Any system can have static and dynamic elements. As a result, a model is regarded complete when both aspects are fully covered. Behavioral diagrams essentially capture a system's dynamic character. The changing/moving parts of a system are referred to as the dynamic aspect.