Statistics for Machine Learning
Overview
Machine learning, the powerhouse of modern data-driven applications, relies heavily on the foundations of statistics. In this comprehensive guide, we delve into the world of statistics for machine learning, exploring its various facets, from data types and sampling techniques to hypothesis testing and probability density functions. Join us on this journey as we uncover the vital role statistics plays in shaping the landscape of machine learning.
What is Statistics?
Statistics, as a field of study and practice, is fundamentally concerned with transforming raw data into valuable information. It accomplishes this by employing a range of techniques that begin with data collection. Whether through surveys, experiments, observations, or data mining, statistics helps in gathering data from various sources, ensuring it is representative and reliable.
Once data is collected, statistics takes centre stage in the analysis process. It offers a plethora of methods to explore data patterns, relationships, and trends. Descriptive statistics, for instance, enables the summarization and presentation of data concisely and understandably. Through tools like histograms, scatter plots, and summary statistics like means and standard deviations, it provides a visual and numerical snapshot of the data's characteristics.
Beyond description, statistics also delves into inference, where it draws conclusions and makes predictions based on data. Inferential statistics involves hypothesis testing, confidence intervals, and regression analysis, among other techniques, to uncover insights and make informed decisions. This aspect of statistics is particularly valuable in machine learning, where models use statistical principles to generalize patterns from the observed data to make predictions on new, unseen data. In essence, statistics is the key that unlocks the potential of data, transforming it into actionable knowledge across various domains.
Types of Data
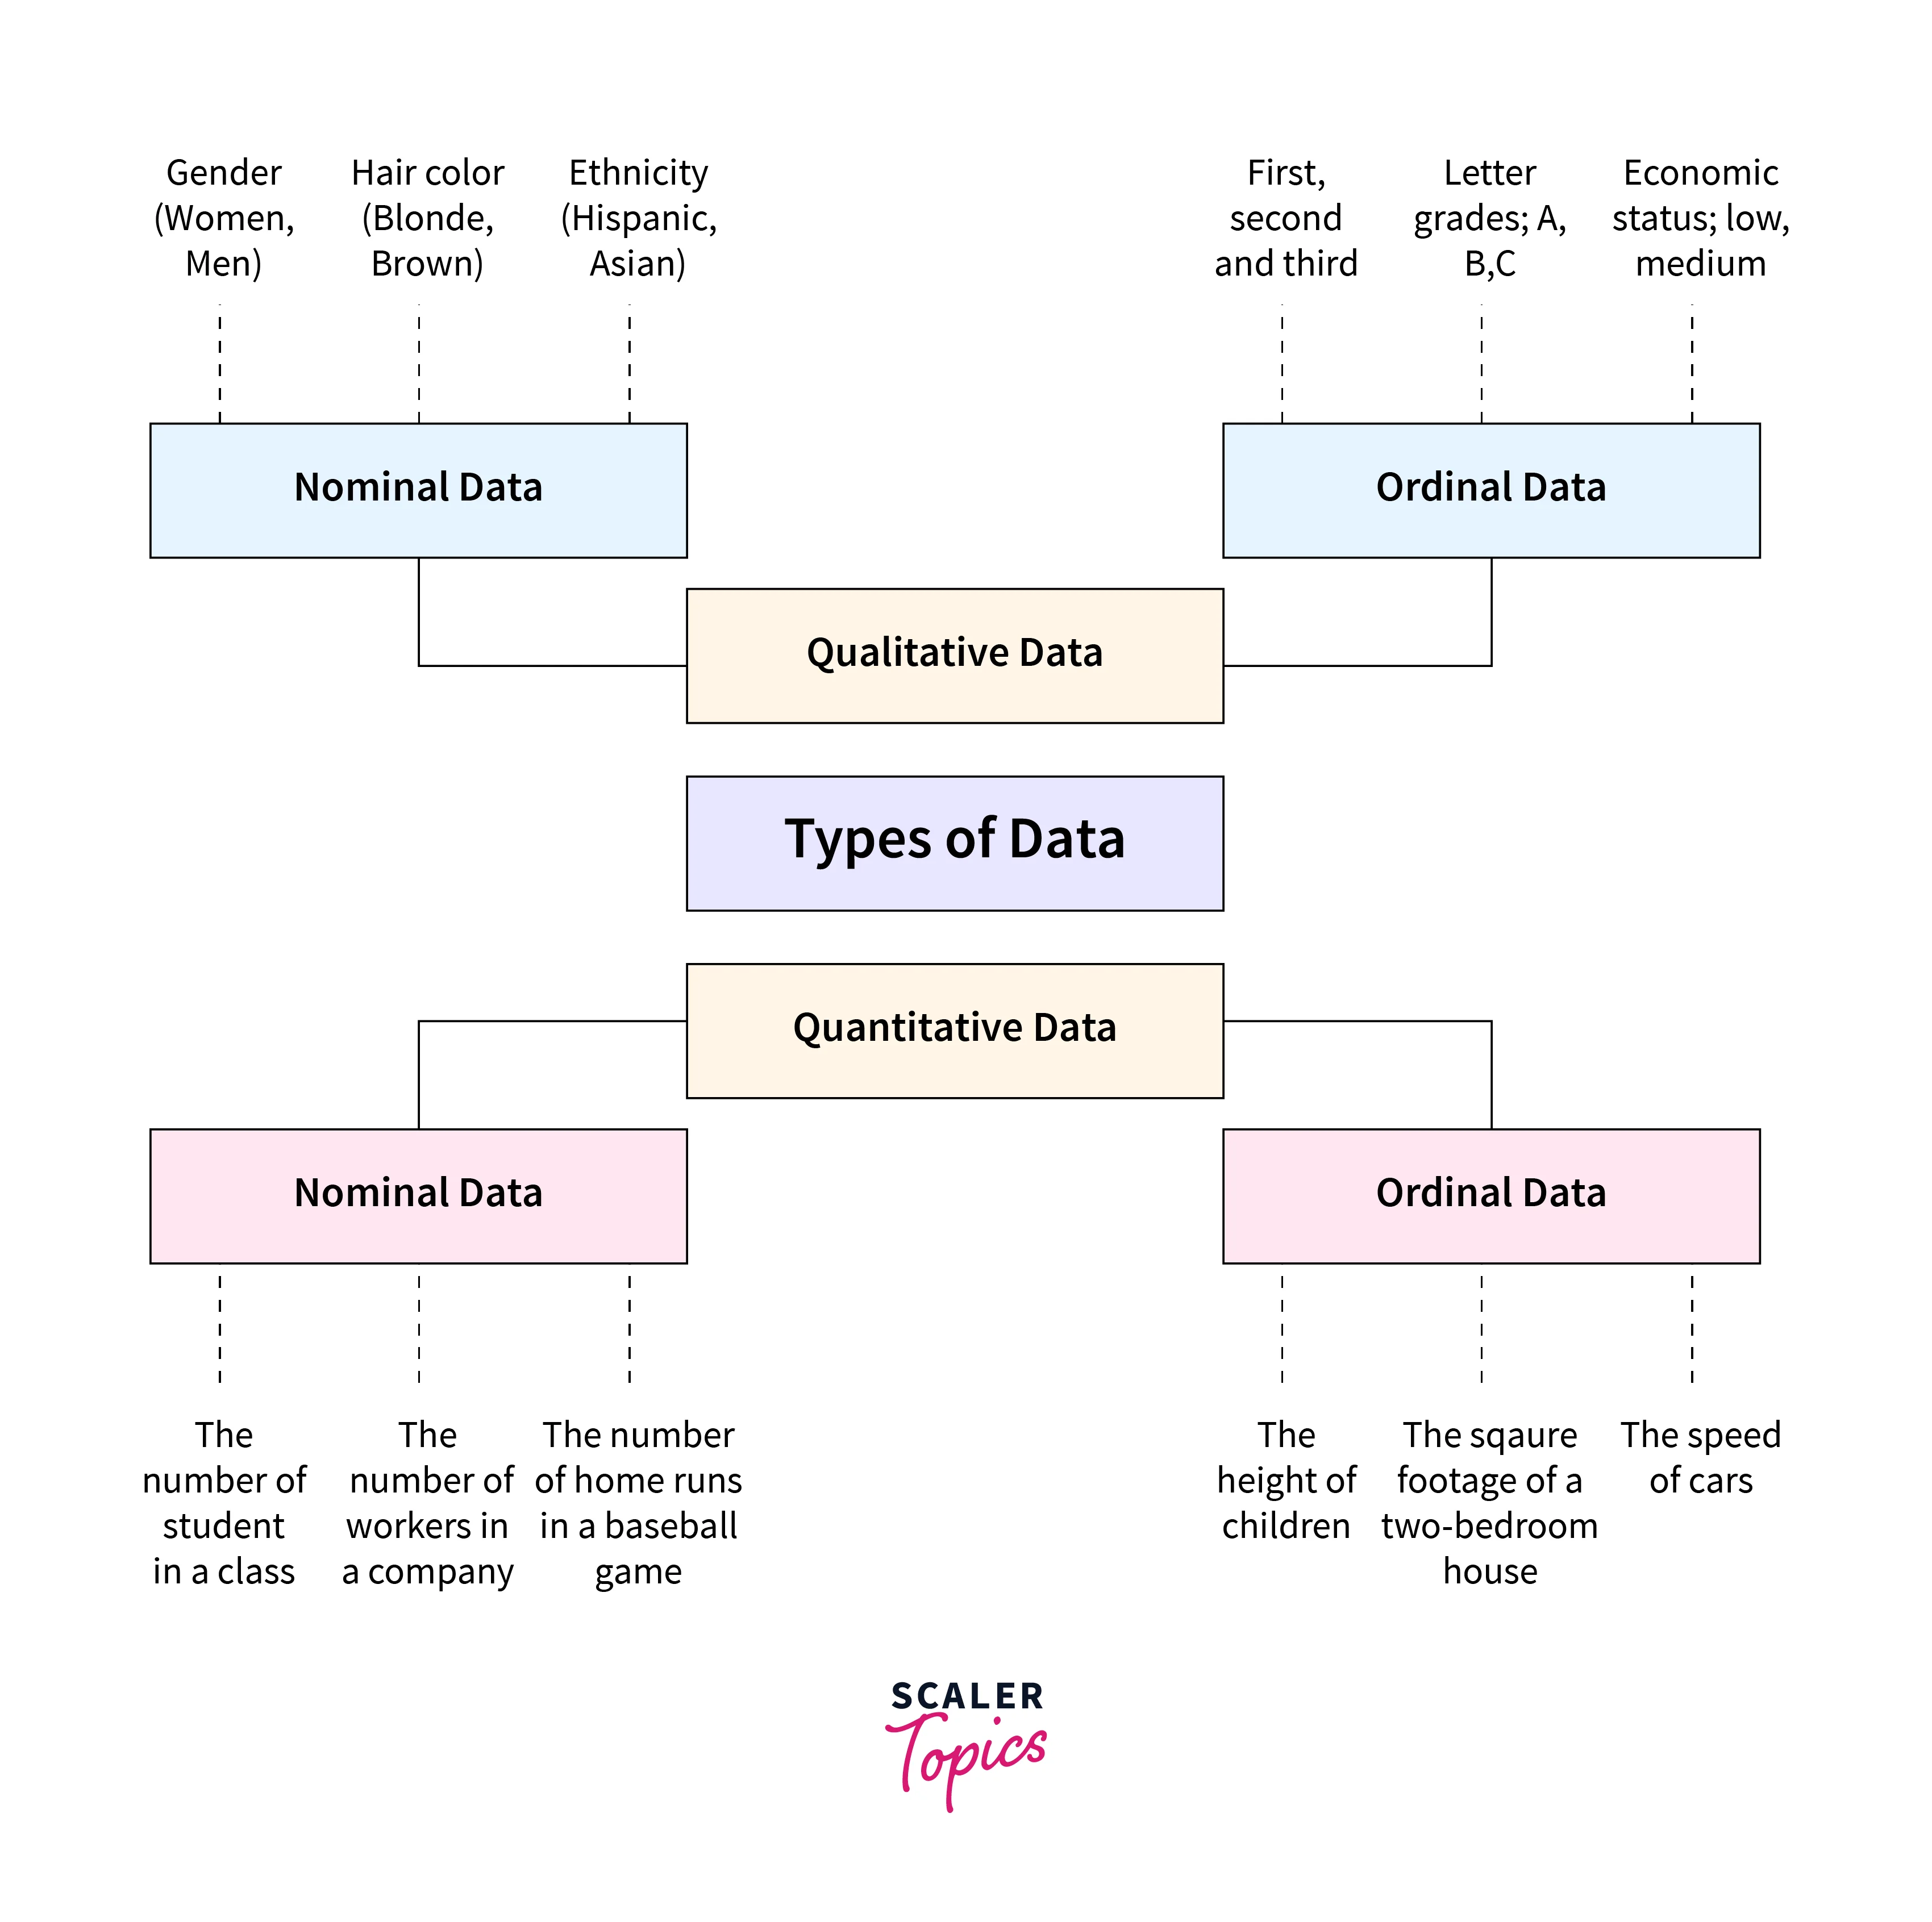 In the realm of statistics for machine learning, data comes in various forms. Understanding the types of data is crucial as it determines the appropriate statistical methods to apply. Broadly, data can be categorized into the following types:
-
Nominal Data: Nominal data represents categories or labels with no inherent order or ranking. It simply classifies data into distinct groups. Examples include:
- Colors: Red, blue, green, etc.
- Gender: Male, female, non-binary, etc.
- Types of Animals: Dogs, cats, birds, etc.
-
Ordinal Data: Ordinal data also involves categories, but it adds a level of ranking or order among them. The order matters, but the differences between categories may not be uniform. Examples include:
- Educational Qualifications: High school diploma, bachelor's degree, master's degree, Ph.D.
- Customer Satisfaction Ratings: Poor, fair, good, excellent.
-
Discrete Data: Discrete data consists of distinct, separate values or whole numbers. These values often represent counts or can be counted. Examples include:
- Number of Cars in a Parking Lot: 0, 1, 2, 3, ...
- Number of People in a Household: 1, 2, 3, ...
-
Continuous Data: Continuous data, on the other hand, can take any value within a given range and is not limited to distinct, separate values. It often involves measurements and can have fractional or decimal values. Examples include:
- Height of Individuals: Can be any value between a minimum and maximum height.
- Temperature in Celsius or Fahrenheit: Can be 25.5°C, 26.3°C, etc.
Understanding the nature of your data is the first step in applying appropriate statistical techniques in machine learning tasks.
Use of Statistics in Machine Learning
Statistics plays a pivotal role in various aspects of machine learning, making it an indispensable tool for data scientists and machine learning practitioners.
Here are some key areas where statistics for machine learning come into play:
- Data Preprocessing: Before training a machine learning model, it's essential to clean and preprocess the data. Statistics help in handling missing values, outlier detection, and data scaling, ensuring that the model receives high-quality input.
- Feature Selection: Statistics aids in selecting the most relevant features or variables for model training. Techniques like correlation analysis and feature importance scores help identify the variables that have the most impact on the target variable.
- Model Evaluation: Assessing the performance of machine learning models requires statistical measures such as accuracy, precision, recall, F1-score, and ROC curves. These metrics provide insights into how well a model generalizes to new data.
- Estimating Risk Statistics in Machine Learning: Understanding and quantifying risk is crucial in various domains, including finance and healthcare. Statistics enables the estimation of risk statistics like Value at Risk (VaR) and Conditional Value at Risk (CVaR) for making informed decisions.
- Predictive Modeling: Building predictive models involves statistical techniques such as regression and classification. These methods enable the modelling of relationships between variables and making predictions based on data.
Now that we've established the significance of statistics in machine learning, let's dive deeper into some essential statistical concepts and techniques commonly used in this field.
Types of Statistics for Machine Learning
In machine learning, two primary types of statistics play distinct roles:
-
Descriptive Statistics: These statistical techniques serve the purpose of summarizing and presenting data in a comprehensible and meaningful manner. Descriptive statistics provide a quick overview of the dataset's main characteristics. Measures of central tendency, such as the mean, median, and mode, help identify the typical value within a dataset. Additionally, measures of spread, such as the range and standard deviation, offer insights into how the data points are distributed around the centre. Visual representations, including histograms and box plots, provide a visual snapshot of the data's distribution, making it easier to grasp its overall shape and any potential outliers.
-
Inferential Statistics: In contrast, inferential statistics are employed to make educated inferences or predictions about a broader population based on a sample of data. These techniques are particularly valuable when it's impractical or impossible to gather data from an entire population. Hypothesis testing, a prominent aspect of inferential statistics, allows researchers to assess whether observed differences or relationships in the sample data are statistically significant and, by extension, applicable to the entire population. Confidence intervals provide a range within which population parameters are likely to fall, offering a degree of certainty in estimation. Regression analysis enables the modelling of relationships between variables, facilitating predictions and understanding dependencies within the data.
These two types of statistics work in tandem, with descriptive statistics offering an initial understanding of the dataset's characteristics and inferential statistics helping draw broader conclusions and make predictions based on that data. Together, they form the statistical foundation upon which much of machine learning relies.
Population & Sample
Understanding Populations and Samples
In statistics for machine learning, it's essential to distinguish between populations and samples.
- Population: The population refers to the entire group or set of items that you are interested in studying. For instance, if you want to analyze the heights of all adults in a country, the population would consist of every adult in that country.
- Sample: A sample is a subset of the population. Due to practical constraints, it's often impossible to collect data from an entire population. Instead, you gather data from a representative sample and use it to conclude the population as a whole.
Sampling Techniques
Sampling is a critical aspect of statistics in machine learning, as it ensures that the data used for analysis is representative of the population. Here are some common sampling techniques:
- Random Sampling: In random sampling, each member of the population has an equal chance of being selected. This method helps minimize bias and is commonly used when obtaining a simple random sample is feasible.
- Stratified Sampling: Stratified sampling involves dividing the population into strata or subgroups based on certain characteristics (e.g., age, gender, income). Then, random samples are drawn from each stratum to ensure representation.
- Systematic Sampling: Systematic sampling involves selecting every nth element from a list or population. This method is efficient and easy to implement when the population is ordered.
- Cluster Sampling: Cluster sampling divides the population into clusters and randomly selects some clusters for analysis. It's particularly useful when it's difficult to obtain a simple random sample.
Variance & Standard Deviation
Variance and standard deviation are essential statistics for machine learning, as they quantify the spread or dispersion of data points in a dataset.
- Variance: Variance measures the average of the squared differences from the mean. It tells us how much individual data points deviate from the mean. A higher variance indicates greater dispersion in the data.
- Standard Deviation: The standard deviation is simply the square root of the variance. It provides a measure of dispersion in the same units as the data. A smaller standard deviation suggests that data points are closer to the mean.
In machine learning, understanding the variance and standard deviation of features can help in feature scaling and assessing model performance.
Central Limit Theorem
The Central Limit Theorem is a fundamental concept in statistics for machine learning. It states that, regardless of the underlying distribution of the population, the distribution of the sample means will approximate a normal distribution as the sample size increases. This is a powerful property because it allows us to make inferences about population parameters even when we don't know the population's distribution.
In line with the central limit theorem, when you draw sizable random samples from a population, regardless of the initial distribution of that population with a mean of μ and a standard deviation of σ, the distribution of the means of those samples will tend to approximate a normal distribution.
The Central Limit Theorem is particularly important when dealing with hypothesis testing and confidence intervals in machine learning. It forms the basis for many statistical tests and estimation techniques.
Hypothesis Testing
Hypothesis testing is a critical statistical tool in machine learning for making decisions and drawing conclusions based on data. It involves the following steps:
- Formulating Hypotheses: The first step is to define two hypotheses: the null hypothesis H0 and the alternative hypothesis Ha. The null hypothesis represents the status quo or no effect, while the alternative hypothesis suggests a change or effect.
- Collecting Data: Data is collected and analyzed to determine if there is enough evidence to reject the null hypothesis in favour of the alternative hypothesis.
- Statistical Test: A statistical test is chosen based on the nature of the data and the research question.
- Calculating P-value: The p-value is calculated, representing the probability of observing the data if the null hypothesis is true. A smaller p-value indicates stronger evidence against the null hypothesis.
- Drawing Conclusions: Based on the p-value and a pre-defined significance level (alpha), a decision is made to either reject the null hypothesis or fail to reject it.
Several well-known hypothesis tests include:
- Chi-square test
- T-test
- Z-test
- Analysis of Variance (ANOVA)
Hypothesis testing is used in machine learning for various purposes, such as comparing model performance, testing the significance of features, and validating assumptions.
Measure of Central Tendency
Measures of central tendency provide insight into the centre or average of a dataset. The three most common measures of central tendency are:
- Mean: The mean, or average, is the sum of all data points divided by the number of data points. It represents the "typical" value in a dataset and is sensitive to outliers.
- Median: The median is the middle value when data is sorted. It is less affected by outliers and provides a robust estimate of central tendency.
- Mode: The mode is the most frequently occurring value in a dataset. A dataset can have one mode (unimodal) or multiple modes (multimodal).
These measures are crucial in machine learning for summarizing data and gaining a better understanding of its central characteristics.
Measure of Spread
Measures of spread, also known as measures of dispersion, help us understand how data points are spread out in a dataset. In addition to variance and standard deviation, discussed earlier, other common measures of spread include:
- Range: The range is the difference between the maximum and minimum values in a dataset. It provides a simple but limited measure of spread.
- Interquartile Range (IQR): The IQR is the range between the first quartile (25 percentile) and the third quartile (75 percentile) of a dataset. It's less sensitive to outliers than the range.
- Coefficient of Variation (CV): The CV is the ratio of the standard deviation to the mean. It's useful for comparing the relative variability of different datasets.
Understanding the spread of data is crucial in machine learning to assess the reliability and stability of models.
Skewness
Skewness is a measure of the asymmetry or lack of symmetry in the distribution of data. In machine learning statistics, skewness is an essential concept because it can impact model performance and assumptions.
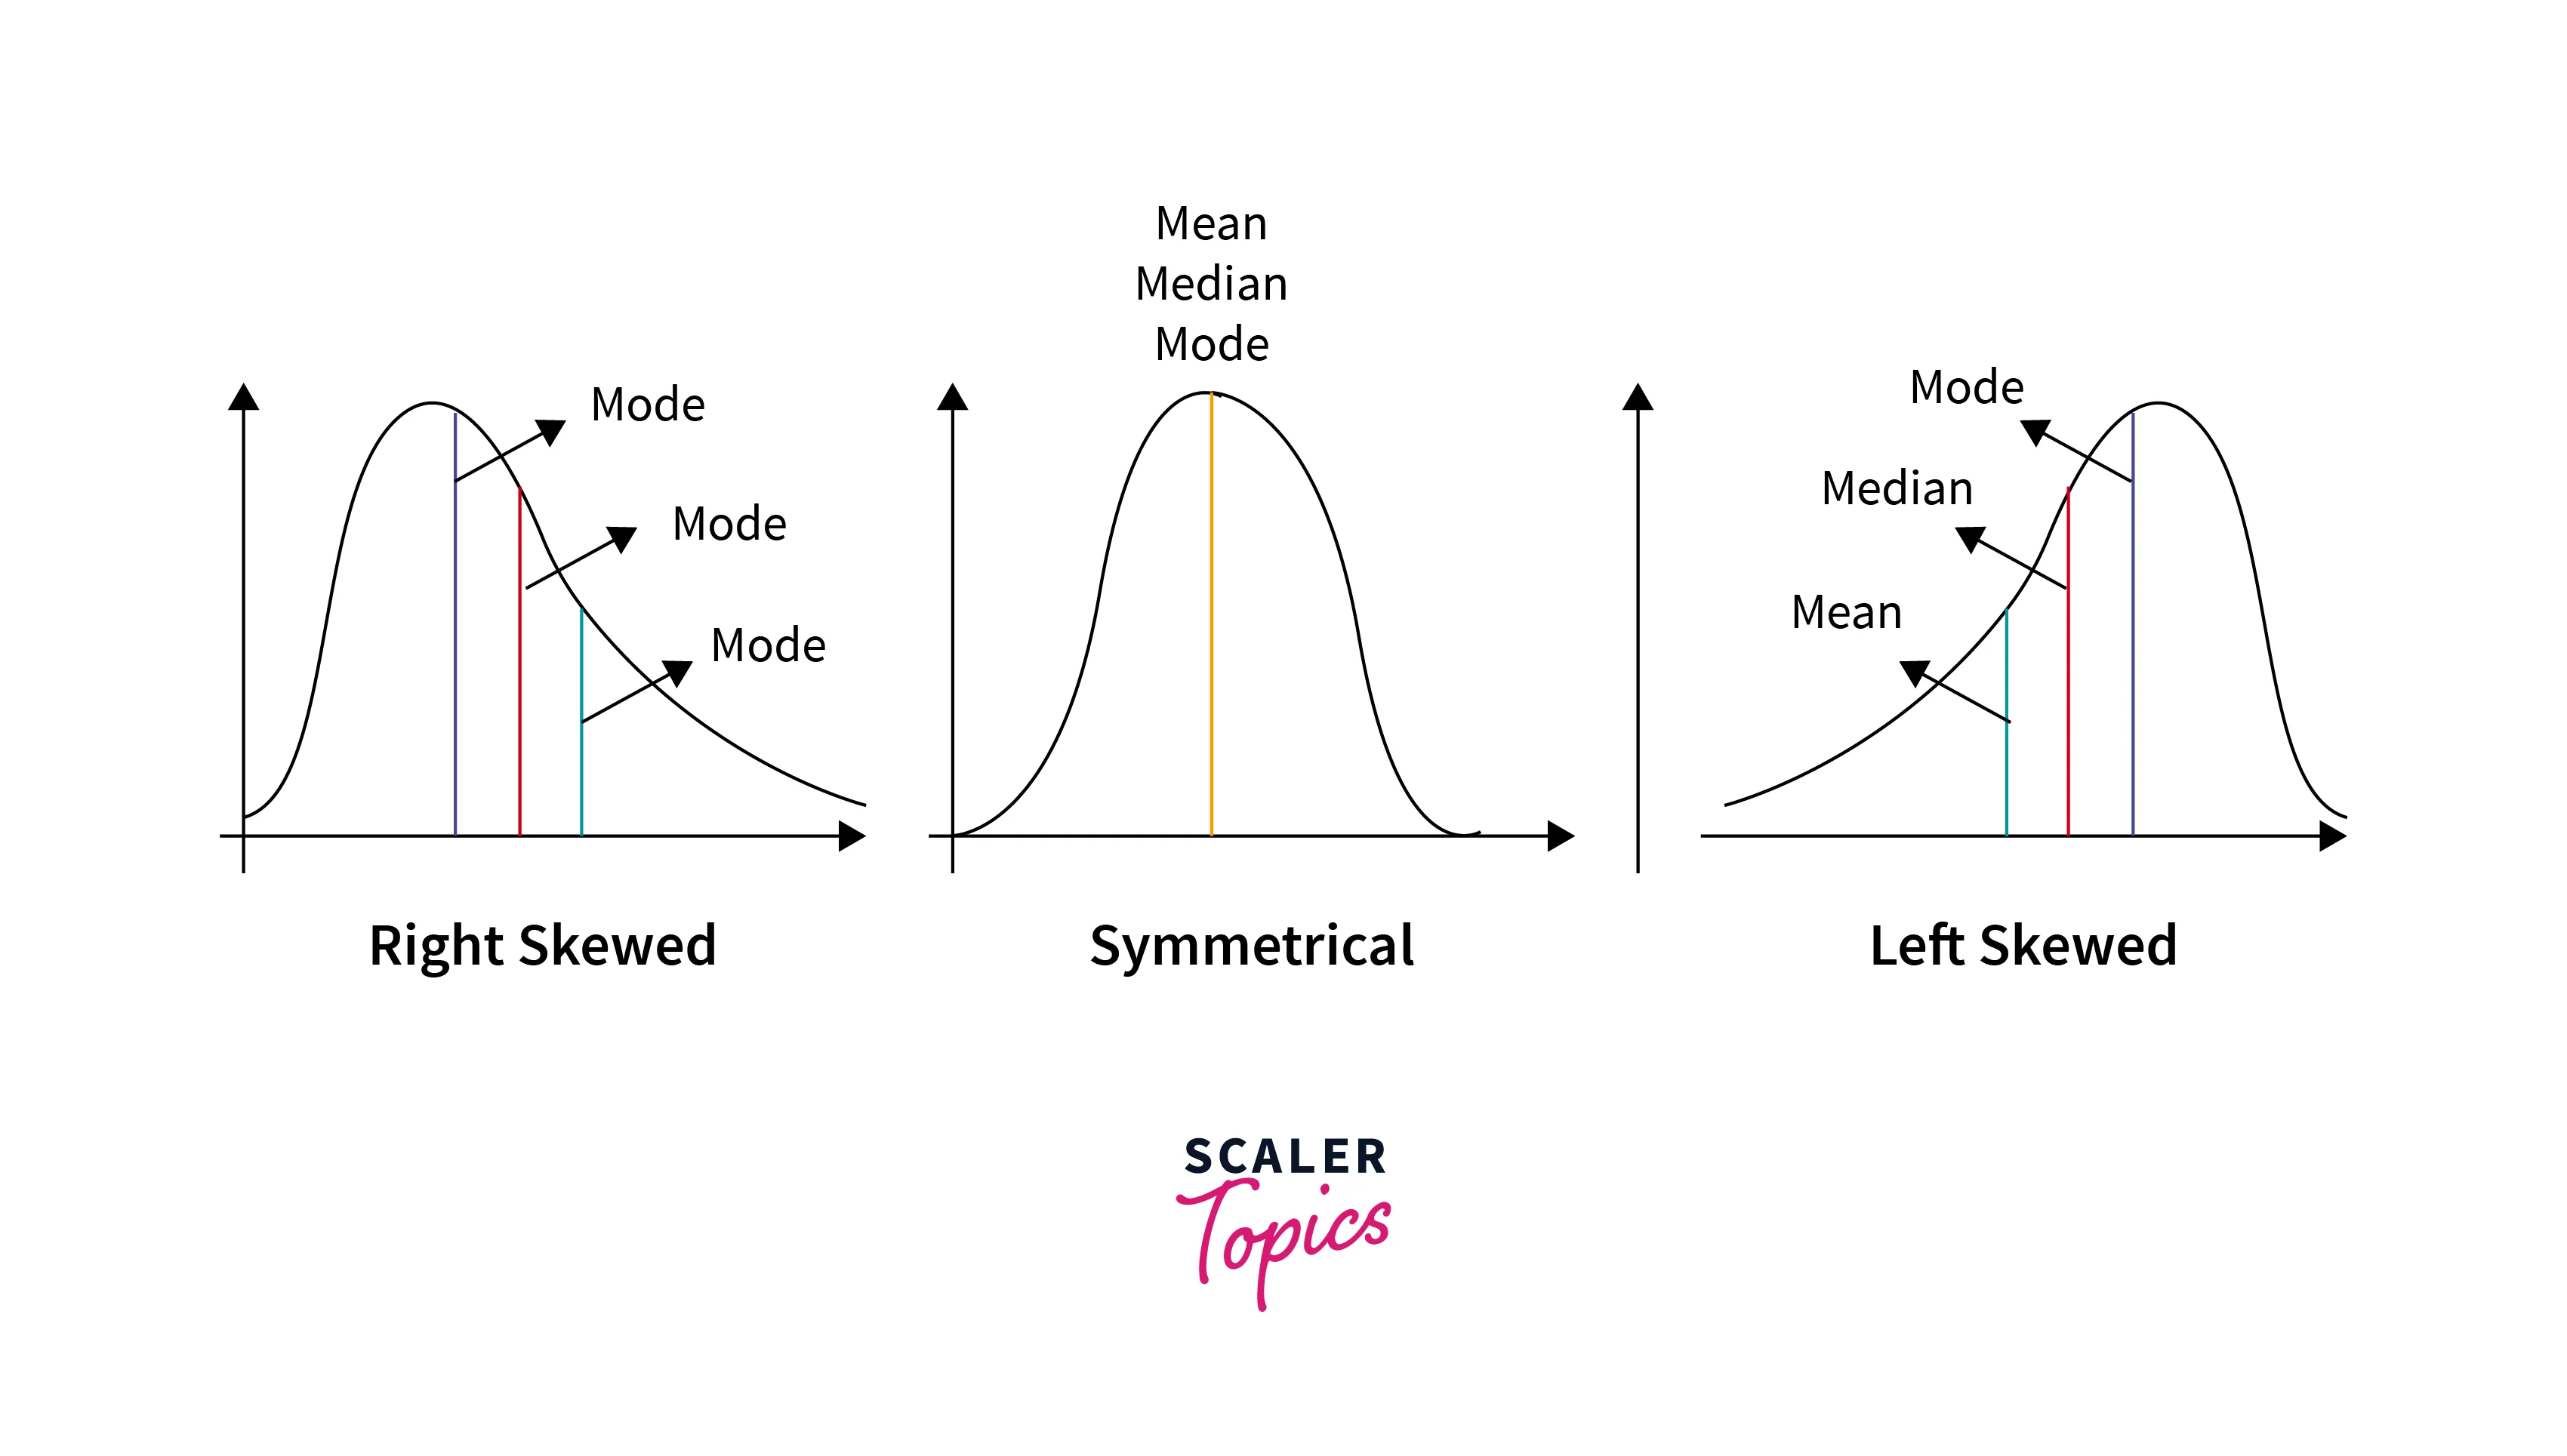
There are three main types of skewness:
- Positive Skew (Right Skew): In a positively skewed distribution, the tail on the right side (larger values) is longer or fatter than the left tail. The mean is greater than the median in a positively skewed distribution.
- Negative Skew (Left Skew): In a negatively skewed distribution, the tail on the left side (smaller values) is longer or fatter than the right tail. The mean is less than the median in a negatively skewed distribution.
- No Skew (Symmetrical): A symmetrical distribution has no skew and is perfectly balanced. The mean and median are equal in a symmetrical distribution.
Identifying skewness in data is crucial for selecting appropriate modelling techniques and transformations to ensure model accuracy.
Probability Density Function
In machine learning statistics, understanding the probability density function (PDF) is essential for modelling and analyzing random variables. The PDF represents the probability distribution of a continuous random variable and is denoted as .
The key properties of a PDF include:
- Non-Negativity: The PDF is always non-negative, meaning that for all x.
- Area under the Curve: The area under the PDF curve over the entire range of values equals 1, representing the total probability.
- Probability in an Interval: The probability of the random variable falling within a specific interval is given by the integral of the PDF from a to b.
The PDF is instrumental in various statistical tasks in machine learning, including probability calculations, density estimation, and generating synthetic data.
Cumulative Distribution Function
The Cumulative Distribution Function (CDF) complements the PDF in machine learning statistics. It represents the probability that a random variable X takes on a value less than or equal to x, denoted as .
Key characteristics of the CDF include:
- Monotonicity: The CDF is a monotonically increasing function, meaning it never decreases as x increases.
- Range: The CDF's range is between 0 and 1, reflecting the probability scale.
- Step Function: In the case of discrete random variables, the CDF is a step function with jumps at each possible value.
The CDF is useful for calculating probabilities, and quantiles, and understanding the distribution of random variables in machine-learning applications.
Conclusion
- Statistics forms the backbone of data science and machine learning, providing the tools and techniques to analyze, interpret, and make sense of data.
- Understanding the types of data, including nominal, ordinal, interval, and ratio, is crucial for selecting appropriate statistical methods in machine learning tasks.
- Statistics is used throughout the machine learning process, from data preprocessing and feature selection to model evaluation and risk estimation.
- Statistics can be categorized into descriptive (summarizing data) and inferential (making predictions or drawing conclusions about populations) types.
- Distinguishing between populations (entire groups) and samples (representative subsets) is essential for conducting statistical analyses in machine learning.
- Various sampling techniques, such as random sampling, stratified sampling, systematic sampling, and cluster sampling, ensure representative data collection.
- These measures quantify data dispersion and are vital for understanding the variability within datasets and feature scaling in machine learning.
- The Central Limit Theorem is a foundational concept that enables the application of statistical tests and estimation techniques even when population distributions are unknown.
- Hypothesis testing helps make data-driven decisions by comparing sample data to hypotheses, providing evidence to accept or reject the null hypothesis.
- Mean, median, and mode are essential for summarizing the central characteristics of data, helping in data interpretation and model development.
- Range, interquartile range, and coefficient of variation provide insights into data variability and model stability.
- Recognizing skewness in data distributions is critical for selecting appropriate modelling techniques and addressing assumptions.
- The PDF models the probability distribution of continuous random variables and is crucial for various statistical tasks in machine learning.
- The CDF complements the PDF, helping calculate probabilities and understand random variable distributions.