


DAX Summarize Function in Power BI
Overview
In this article, we delve into the powerful world of Data Analysis Expressions (DAX) in Power BI, focusing on the function SUMMARIZE in Power BI function. DAX is a formula language that enables users to create custom calculations and aggregations in Power BI. In this article, we'll explore how the DAX function SUMMARIZE in Power BI allows you to generate summary tables and harness its potential for data analysis and visualization. We will also understand how to use this versatile DAX function to gain deeper insights and improve your Power BI reports with the function SUMMARIZE in Power BI.
Build an AI-First Career, Master the Complete Skillset
Choose from our industry-leading programs designed for career success
Modern Software and AI Engineering Program
Master full-stack development with AI integration


 +1000 more
Modern Data Science and ML with specialisation in AI
Advanced data science techniques with AI specialization
+1000 moreAdvanced AIML with Specialisation in Agentic AI
Deep dive into AIML with focus on Agentic systems
+1000 moreDevOps, Cloud & AI Platform Engineering
Build and manage AI-powered cloud infrastructure
+1000 moreAI Engineering Advanced Certification by IIT-Roorkee
Premier AI engineering certification from IIT-Roorkee

AI Forward Deployed Engineer Program
Full-stack engineering, production AI and client-facing consulting
+1000 moreSyntax of Summarize Function in Power BI
The syntax of the function SUMMARIZE in Power BI is as follows -
Parameters of Summarize Function in Power BI
Here is the table outlining the parameters of the function SUMMARIZE in Power BI. By utilizing these parameters effectively, you can tailor the SUMMARIZE function in Power BI to suit your specific data analysis requirements and easily generate meaningful summary tables.
| Parameter | Description |
| table | A DAX expression that returns a data table as its output. |
| groupBy_ColumnName | (Optional) The name of an existing column in the table that is used to create summary groups based on the values found in it. |
| name | The name is given to a total or summarized column and is enclosed in double quotes. |
| expression | A DAX expression that returns a single scalar value, where the expression is to be evaluated multiple times (for each row/group/context). |
Return Value of Summarize Function in Power BI
The SUMMARIZE function in Power BI returns a new table that contains the summarized data based on the specified grouping columns and the calculated aggregations. This table will contain the selected columns for the groupBy_columnName arguments and the summarized columns described by the name arguments. This table can be used for further analysis, visualization, or as a source for creating visualizations in your Power BI reports.
How Scaler Transformed Careers in Different Fields
Scaler learners achieved 2.5x salary growth with average post-Scaler CTC reaching ₹23L.
 Google
 Amazon
 Microsoft
 Flipkart
 Adobe1200+ more
How Does The Summarize Function In Power BI Work?
The SUMMARIZE function in Power BI works by taking a table and grouping its data based on the specified columns. It then calculates the desired aggregations for each group, creating a new summary table as a result.
For example, if we have a sales table with columns like "Product," "Category," and "Revenue," we can use SUMMARIZE to group the data by "Product" and "Category" and calculate the total revenue for each product-category combination. The function efficiently organizes the data, enabling us to analyze and visualize the summarized information more effectively. By understanding how to utilize this function, you can gain valuable insights from your datasets and present them in a clear and concise manner in your Power BI reports.
Examples
To illustrate the usage of the SUMMARIZE function, we will use the Orders table in Power BI. Through the SUMMARIZE function, we can analyze the sales and profit figures for each region and month by employing the following query.

Turn Learning into Career Growth
Example 1: With ROLLUP
The following example demonstrates the inclusion of rollup rows within the Group-By columns of the SUMMARIZE function call.

Example 2: With ROLLUPGROUP
By incorporating ROLLUPGROUP within a ROLLUP syntax, partial subtotals in rollup rows can be avoided. However, ROLLUPGROUP is only applicable within a ROLLUP, ROLLUPADDISSUBTOTAL, or ROLLUPISSUBTOTAL expression.

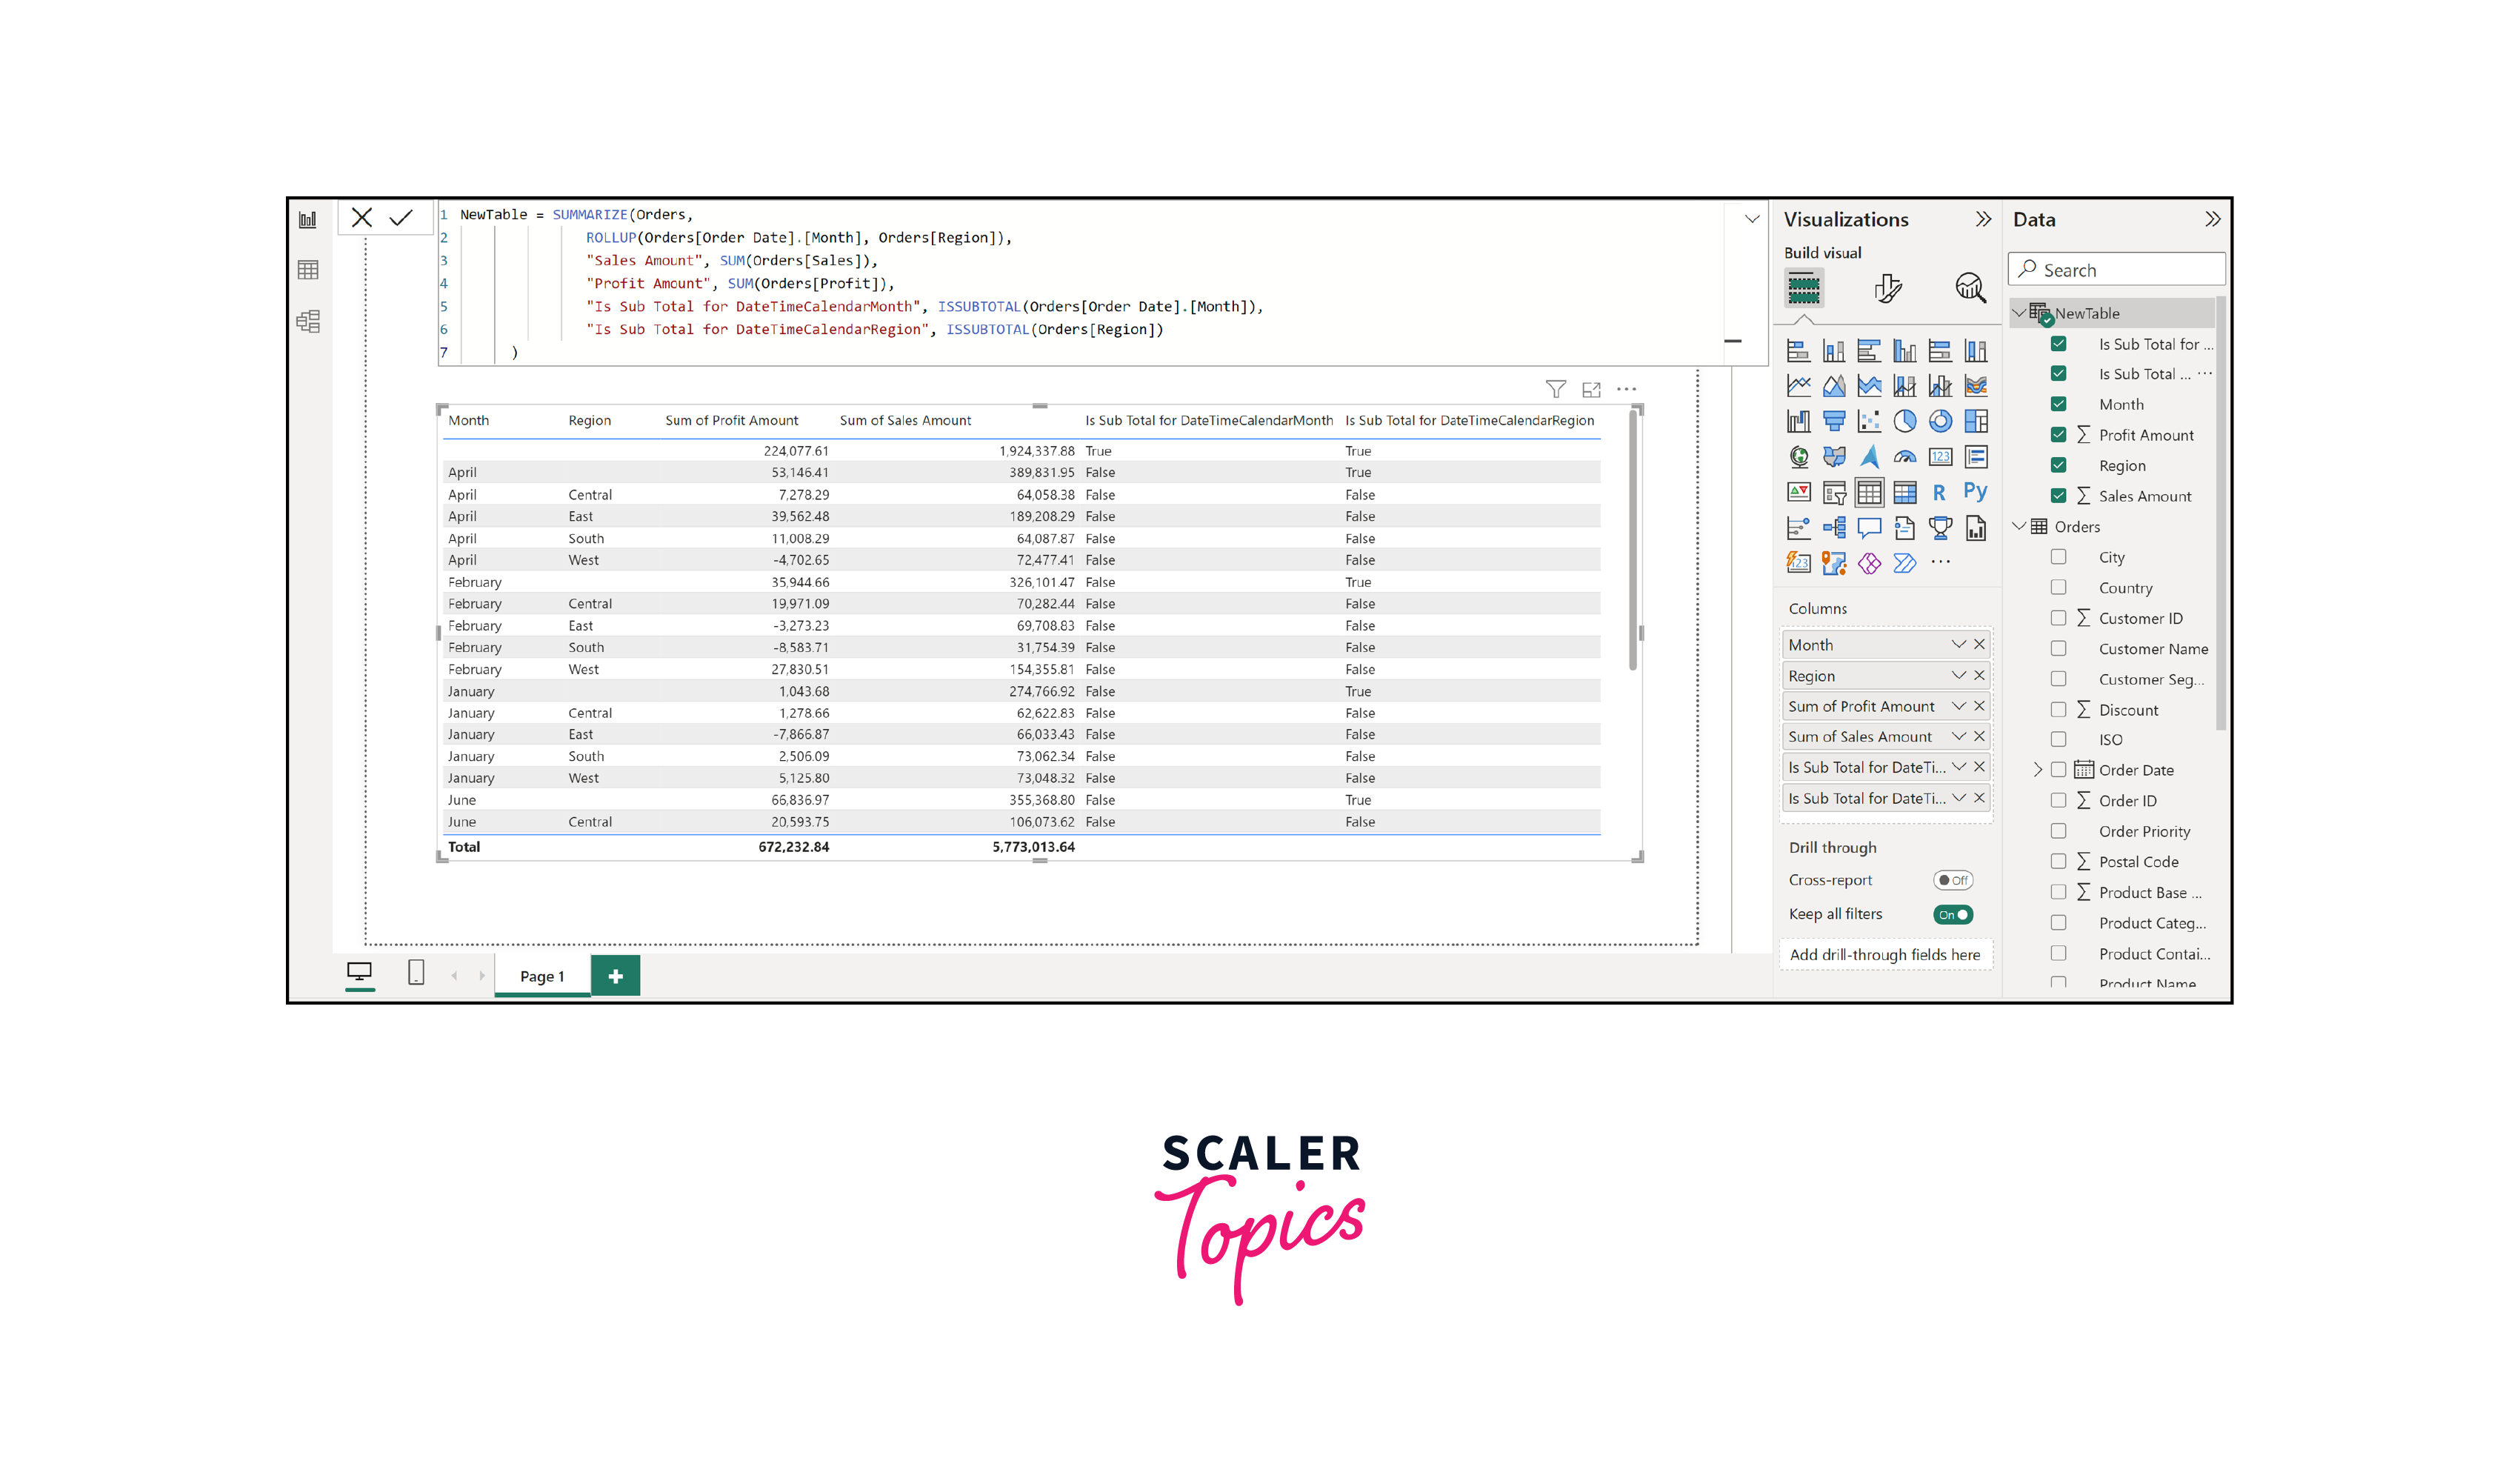
Example 3: With ISSUBTOTAL
Using ISSUBTOTAL in a SUMMARIZE expression allows you to generate an additional column that returns True if the row contains subtotal values for the specified column, otherwise, it returns False. However, ISSUBTOTAL can only be applied within a SUMMARIZE expression.
Conclusion
- The SUMMARIZE function in Power BI is a powerful tool for generating summary tables, enabling users to group data based on specific columns and calculate relevant aggregations. It simplifies the process of data analysis and facilitates better visualization of insights.
- By understanding the syntax and parameters of the SUMMARIZE function, users can efficiently summarize and organize data to gain deeper insights into their datasets.
- Using ROLLUP and ISSUBTOTAL expressions within the SUMMARIZE function provides further flexibility in managing subtotal and grand total values, allowing for more customized and comprehensive summary tables in Power BI reports.




