Supervised and Unsupervised Learning in R Programming
Overview
Big data is generated continuously and is, nowadays, a crucial source for business decision-making. This decision-making is possible quickly due to high computing speeds available for finding trends and patterns through data analysis. We humans have limitations in terms of speed, but we can train computer machines to achieve accurate outcomes speedily. We make this possible through the high computational speeds of these machines and their flawless working by arranging the machines to learn by giving input data in specific ways. This technique is known as Machine Learning and is classified into two types: Supervised and Unsupervised Learning.
Python and R are two programming languages regularly used to make machines learn, adopting several algorithms. This article explains Supervised and Unsupervised Learning in R Programming and the different algorithms falling under each category. We will also discuss the advantages, applications, and packages used for Supervised and Unsupervised Learning in R.
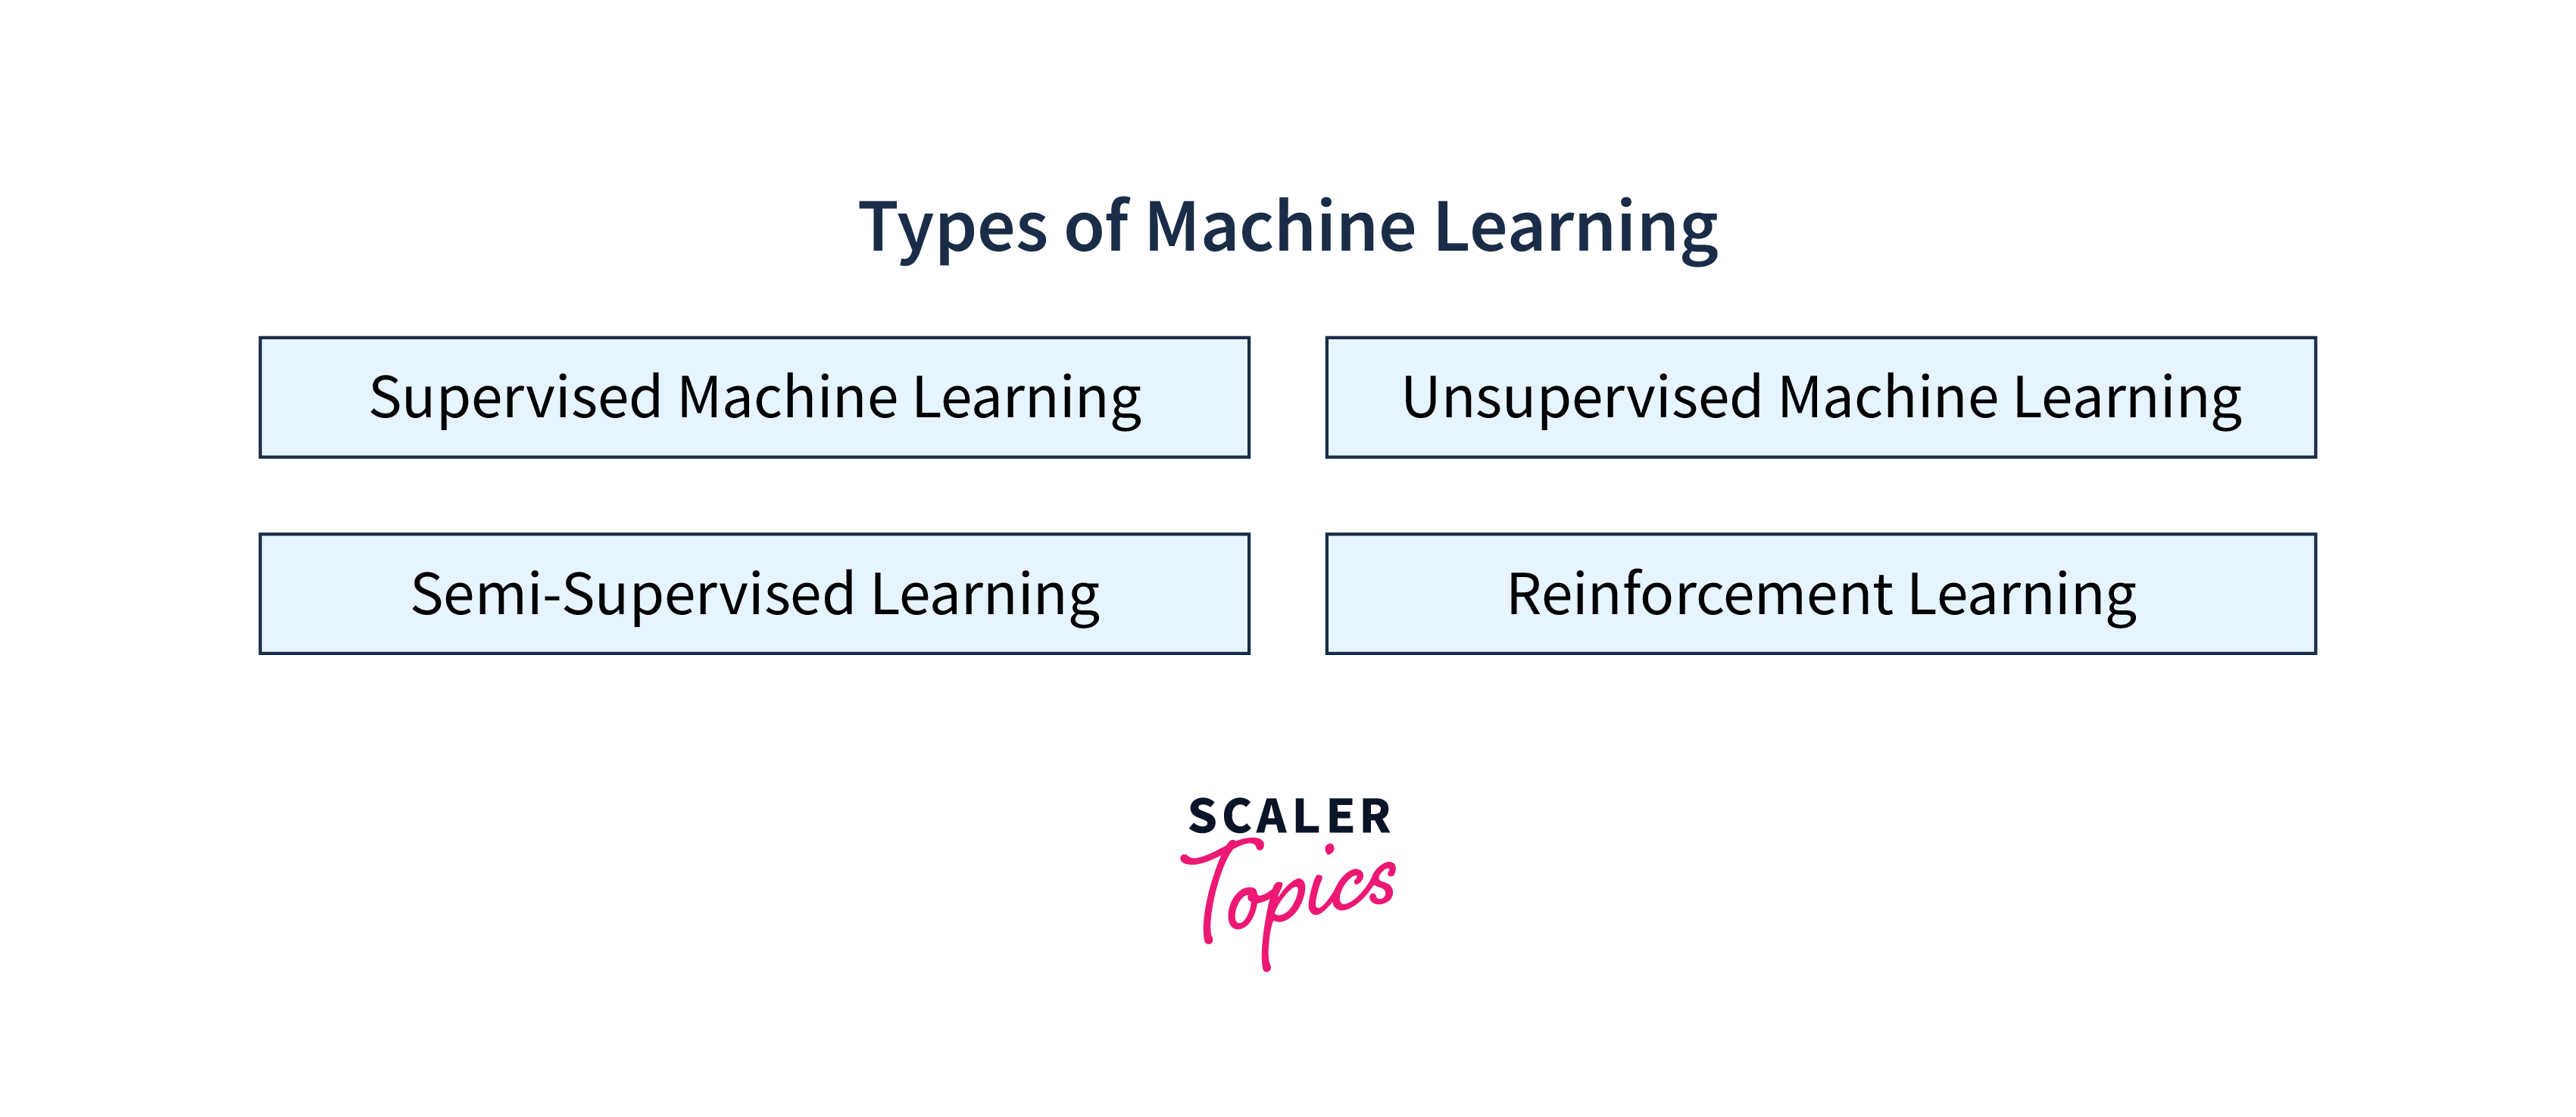
Types of Machine Learning
As mentioned earlier, the popular techniques for making the machines learn are Supervised and Unsupervised Learning. Two further techniques, Semi-Supervised and Reinforcement Learning, are also used in specific situations. However, here, we will focus only on the two methods, Supervised and Unsupervised Learning.
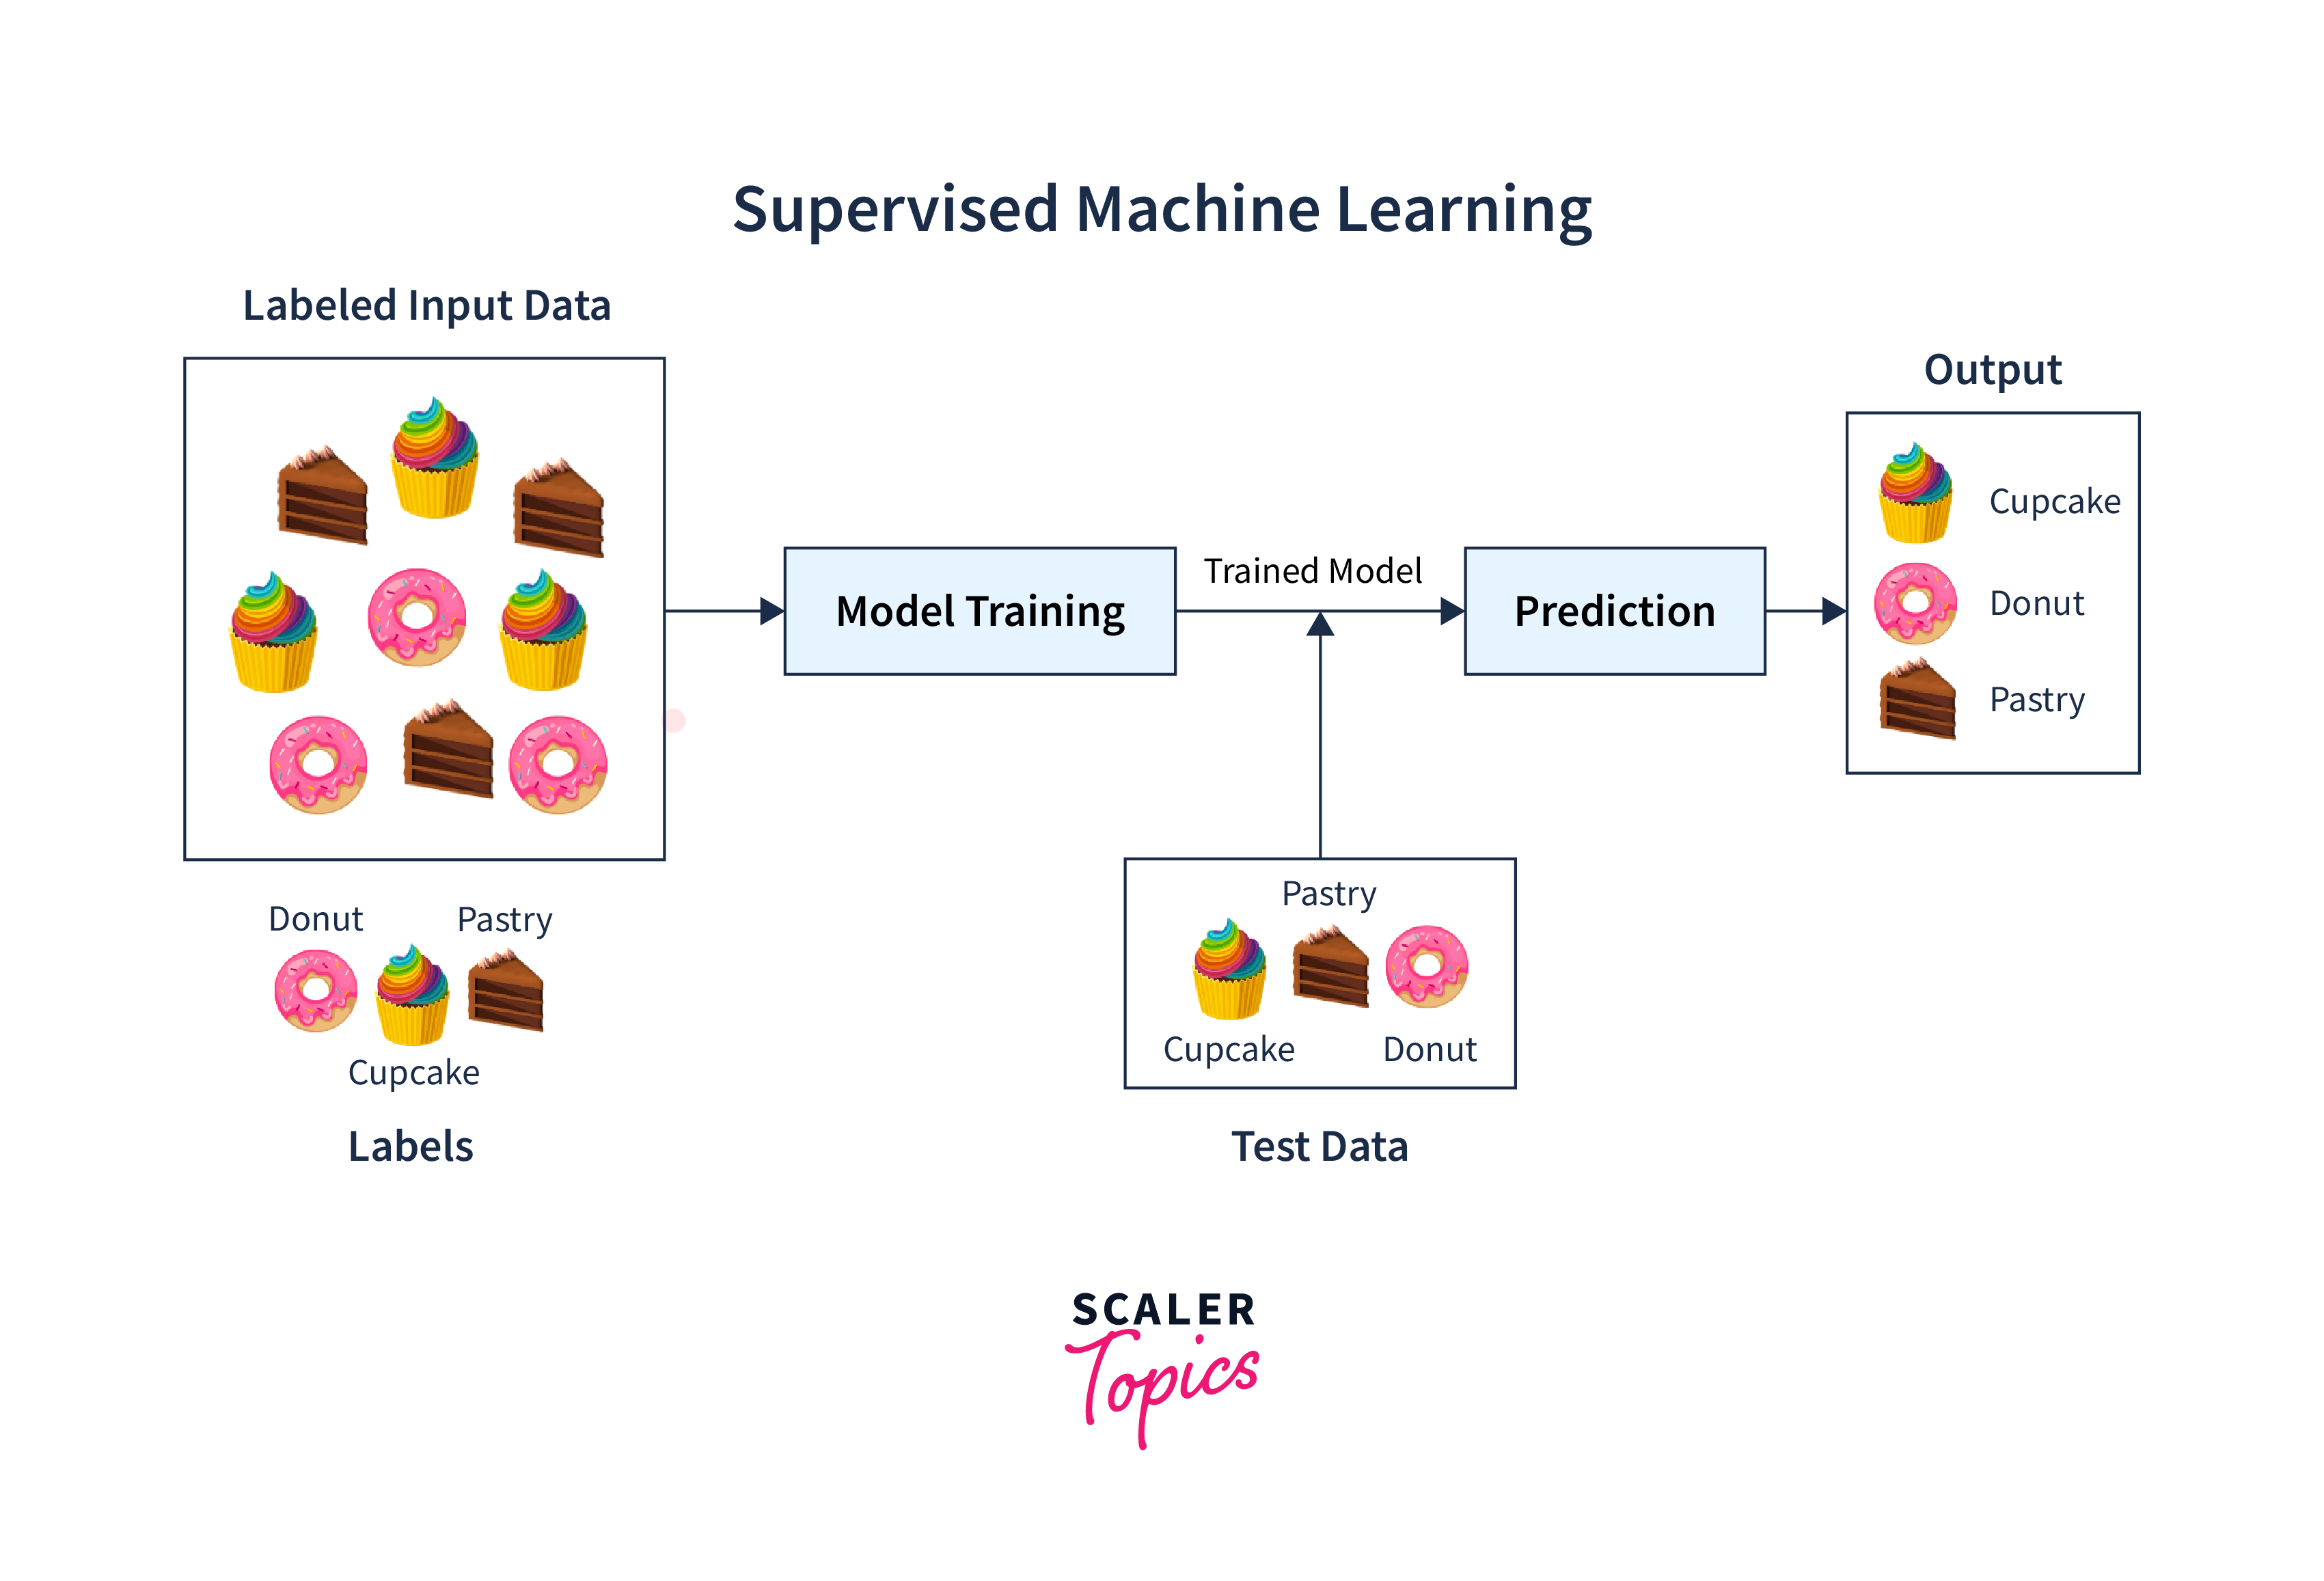
1. Supervised Machine Learning:
It is a technique adopted similar to a classroom scenario where students learn under the supervision of a teacher. In the case of computer machines, data is fed as input with labels. This means the computer system has all the information in terms of features. For example, to identify a plane, input is given with several plane images with identifiable features like shape, wings, windows, wheels, etc. Once trained, it is fed new, unknown images and tested for accurate identification. A higher accuracy indicates a better machine learning model. The process can be repeated until acceptable accuracy is achieved.
The two types of Supervised Machine Learning techniques are:
- Classification:
A classification problem is identified when the output variable falls into a category, such as "true or false", "infected or non-infected", spam or no spam, cat or dog, and so on. - Regression:
A regression problem is confirmed when the output variable has a numeric value such as currency in "Euro" or height in "cm", etc.
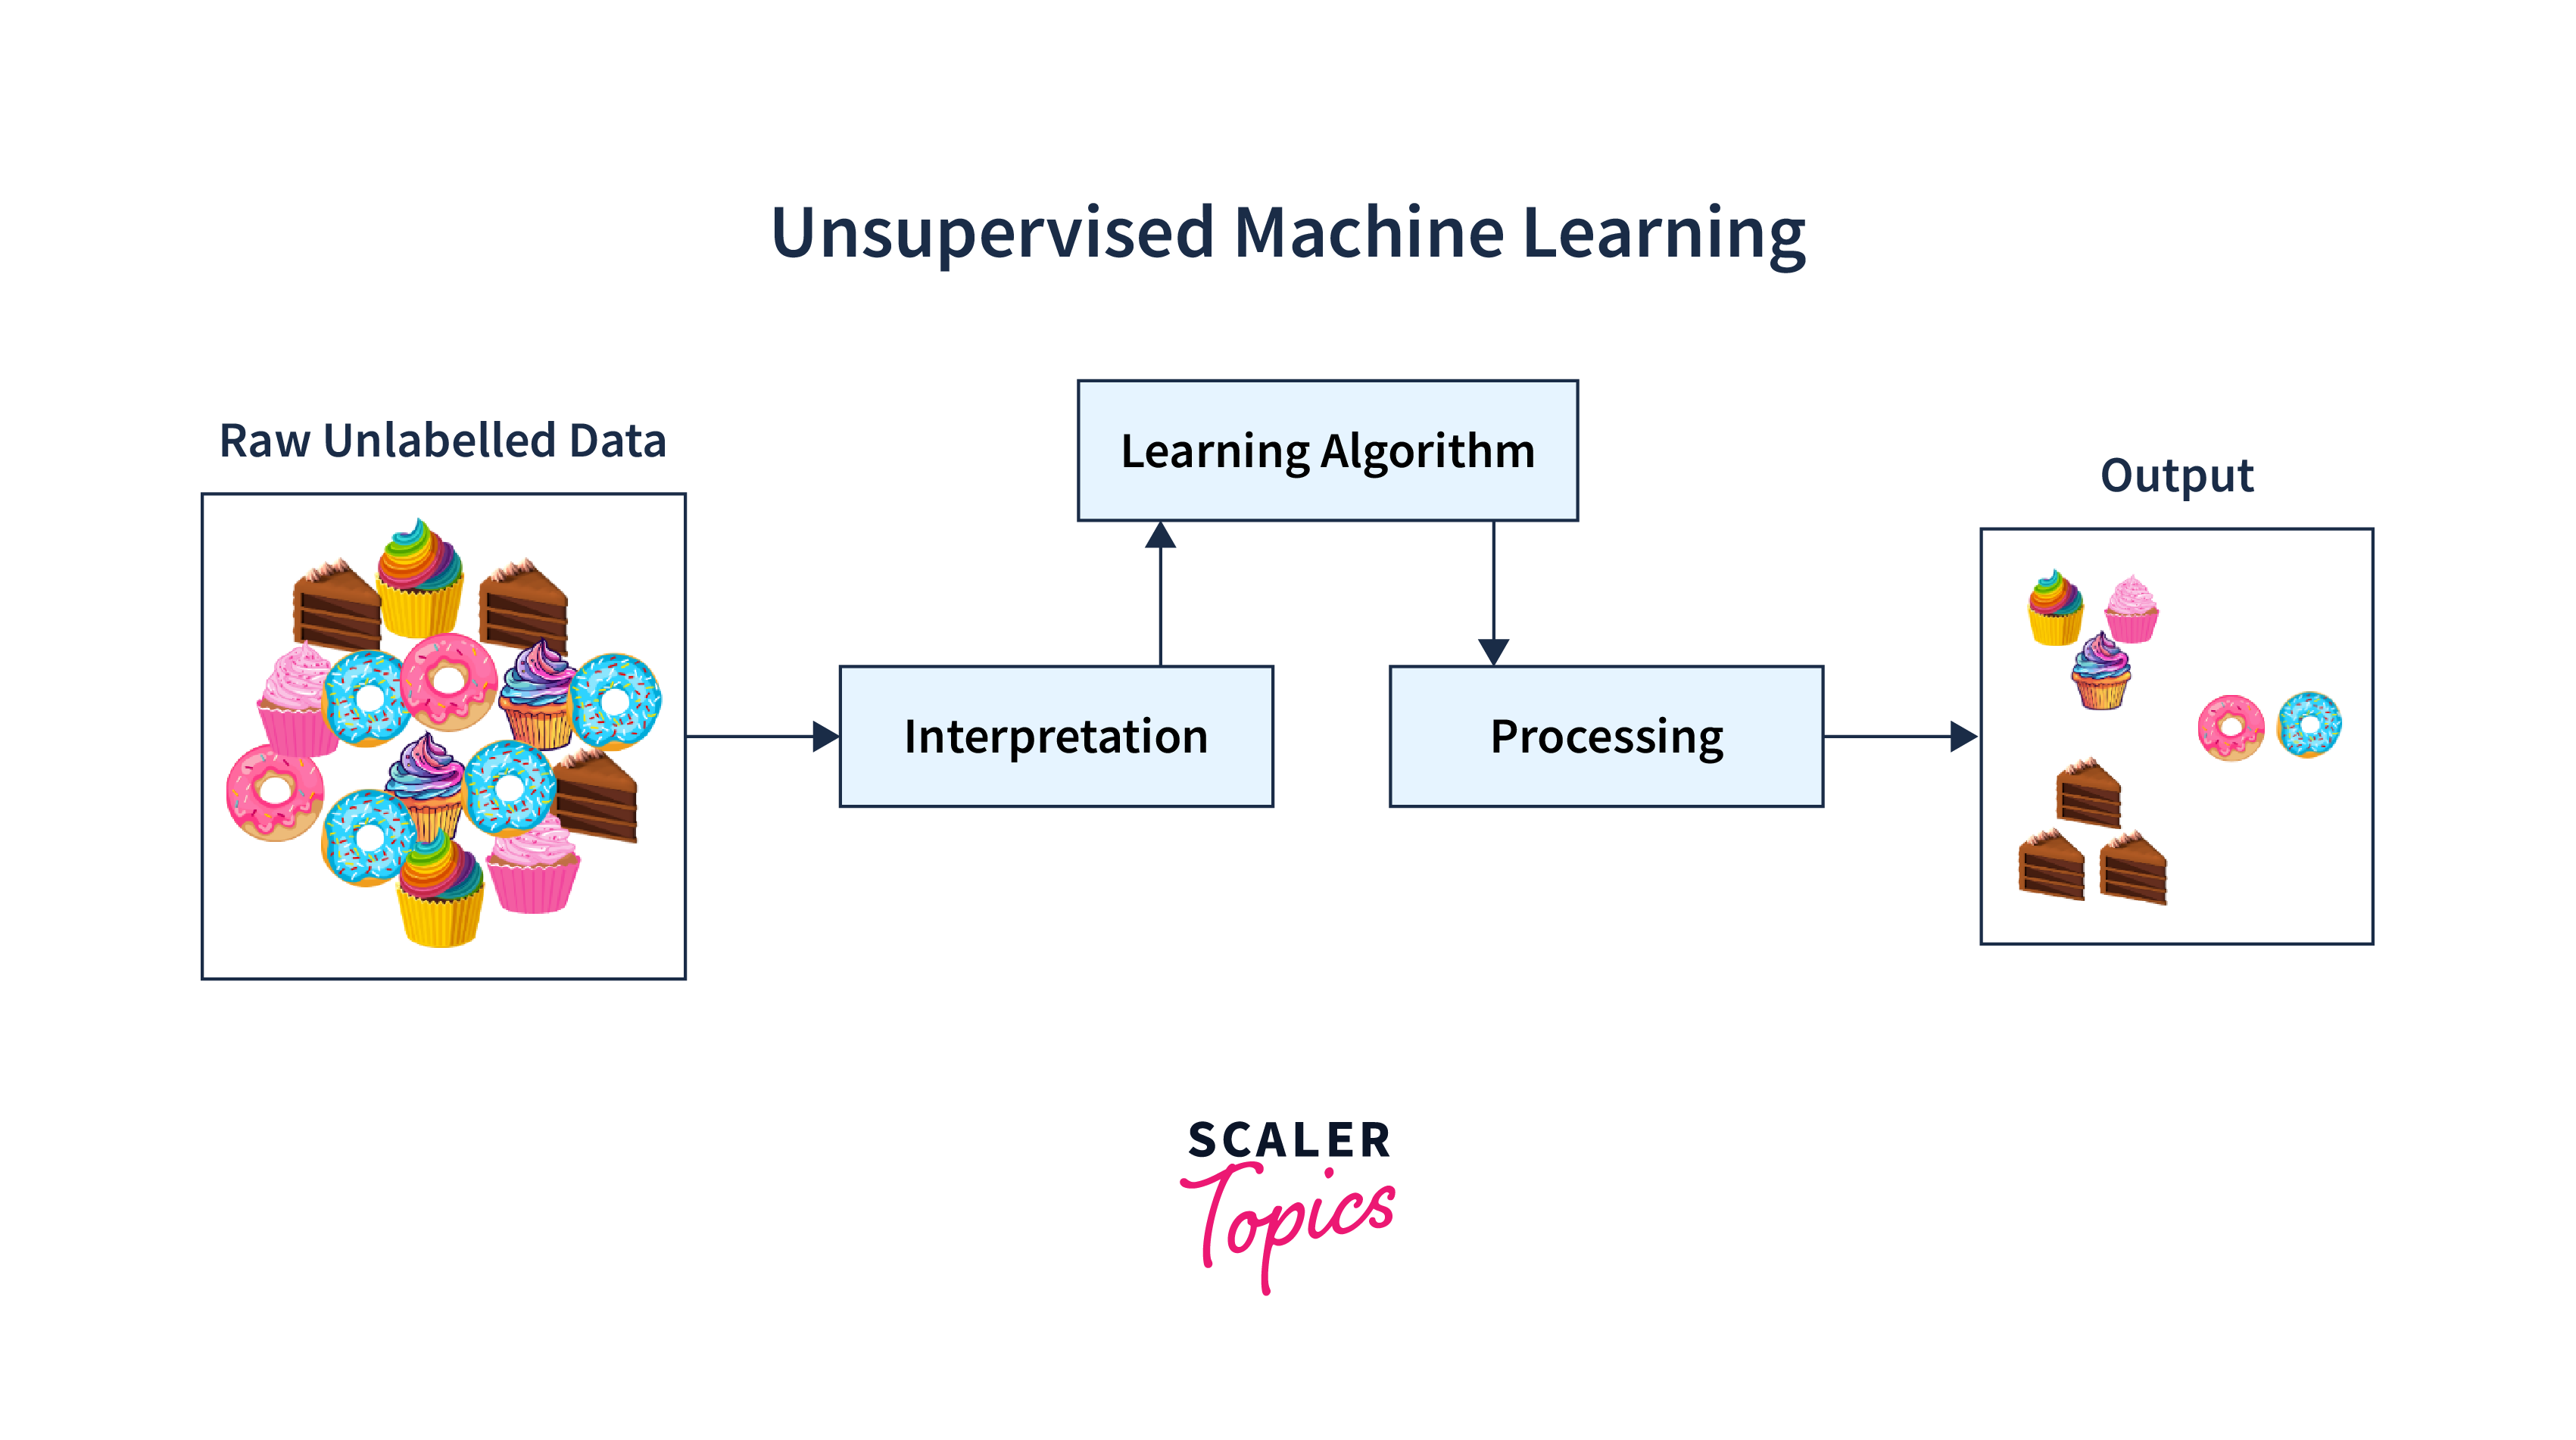
2. Unsupervised Machine Learning:
This technique has a different approach. There is data, but it is not labeled. The algorithm separates the data points into clusters with similar features and patterns and differentiates them from each other. It can accurately sort items into suitable groups based on these features. For example, when fed a large number of images of various fruits like apples, bananas, watermelons, or grapes, the algorithm can create distinct clusters for different fruits, considering features such as size, shape, and color.
Advantages of Implementing Machine Learning in R
- Visualization:
R has several libraries suitable for visualization. Hence, varied informative and attractive graphs and charts can be built both static and interactive. These can enhance the selection of vital features to build convincing machine-learning models. Visualization libraries enable the creation of informative and visually appealing plots and charts. - Power of Statistical capabilities:
R is known for its richness in statistical techniques for proper data analysis and, hence, very useful for subsequent decision-making by different machine learning models. - Integration:
R can easily integrate with other programming languages and tools, facilitating seamless workflows and collaborations. - Rich ecosystem:
R has many built-in packages suitable for solving many practical problems by machine learning, thus providing ample scope for development. - Community support:
R is very popular amongst statisticians, researchers, and professionals. Hence, a strong and dynamic community around the globe exists that provides resources, experimentation, and idea exchanges for learners and experts.
Supervised Learning Techniques in R
Some commonly used Supervised Learning algorithms are briefly discussed below:
1. Linear Regression:
It is a statistical tool that is used to establish a definite relationship between single or multiple input variables x (where x = x1, x2, x3…) with an output variable (y) with a mathematical equation of the form .
2. Logistic Regression:
Logistic regression is regularly used for classification problems of a binary nature. Here, the target is finding the probability whether an event will occur or not. For example, predicting whether a customer will purchase a particular product, i.e., yes or no, whether an email is spam or not, etc.
3. Decision Trees and Random Forests:
This is a Supervised Learning technique algorithm suitable for both regression and classification. It consists of a hierarchical tree structure with a root node, branches, internal and leaf nodes. The data is fed to the tree structure mentioned above, and tests are performed on features that split the data accordingly. Further splitting is done through the next test criteria, and finally, when no splitting is possible, we conclude which class the given data belongs to. Random Forests, an Ensemble algorithm utilizes the average of all decision tree outputs from subsets of the main dataset to give the final output. Obviously, it provides better results than the decision tree model.
4. Support Vector Machines:
This Supervised Machine Learning algorithm can be implemented for Classification and Regression problems but mostly for the former. If N features exist in the data, then each point is plotted in this vector space. Different hyperplanes (separating axis lines) are then considered, and the best hyperplane line is identified that separates the two group data points. The test data point is assigned to that group in which it falls as per the hyperplane.
5. Naïve Bayes Classification:
Naïve Bayes Classifier is a simple, fast, and very effective algorithm that falls under the Supervised Learning technique commonly used for binary classification. It is based on Bayes theorem of conditional probability used to predict whether an outcome will happen or not happen. Prior and posterior probabilities are considered, and then, with the Bayes formula, the probability of assigning a class is made.
6. Ensemble methods:
We know that ensemble technique combines the outcome of different methods to arrive at better results. Bagging and Boosting are well-known ensemble techniques of Machine Learning to optimize the prediction of outcomes with different approaches. In Bagging, different weak learners or models work independently and give some outcome, which is then averaged for the final decision to get a strong learner or best model. In boosting, the outcome of one learner is studied, and the next learner tries to improve the former's performance. This process is repeated so that performance goes on improving or boosting. In short, both methods try to give the best estimate by combining individual performances.
Unsupervised Learning Techniques in R
Some of the regularly used algorithms of Unsupervised Learning techniques are briefly discussed below:
-
Clustering Algorithms:
Clustering algorithms are a set of Unsupervised Learning algorithms that involve forming subgroups of data into different chunks called clusters. Each method has its own concept. Here, distance measurement plays a crucial role in all these algorithms as it helps determine the similarity or dissimilarity between data points, forming the basis for clustering.- K-means:
It is an Unsupervised Learning algorithm that divides the unlabelled data set points into different groups or clusters. K denotes the number of clusters (2, 3, 5, 10, etc.) that can be appropriately estimated. Each cluster contains similar characteristic data points but differs from those in the other group. It is an iterative process. Each cluster is marked with a centroid, and the distance of points from the centroid are calculated, and then points nearest to that centroid are merged into that cluster. The new centroid is again marked, distance is calculated, and the process is repeated till points no longer shift from allotted clusters. That is the ultimate result. - Hierarchical:
Hierarchical clustering shows a visual representation that indicates how clusters are related to each other. There are two types, one adopting a bottom-up approach called Agglomerative clustering in which small clusters nearer to each other are gradually combined to form a final large cluster. The second one uses a top-down approach called Divisive clustering, in which a big cluster containing all data points is gradually broken down into a group of clusters / single clusters till no further cluster can be formed. - DBSCAN:
In the DBSCAN ("Density-Based Clustering of Applications with Noise") algorithm, clusters are formed of crowded points ( densely close). In contrast, other nearer points are gradually added to these clusters based on their close proximity. Points quite far from a specified distance are treated as outliers or noise.
- K-means:
-
Dimensionality Reduction:
It is a statistical or machine learning-based technique where we reduce the number of features in our dataset in order to get a dataset with the optimal number of dimensions.- Principal Component Analysis:
It is a feature extraction technique that converts a higher-dimensional feature space into a lower-dimensional feature space. PCA makes sure that the original dataset's maximum information is maintained in the dataset even with the reduced number of dimensions, and the correlation between the newly obtained Principal Components is minimal. - t-SNE (t-distributed Stochastic Neighbor Embedding):
It is an unsupervised non-linear dimensionality reduction technique used to explore high-dimensional data, different from 2D or 3D data, and the non-spherical distribution of points. Non-linear dimensionality reduction means that the algorithm helps us to separate and classify data that cannot be separated by a straight line.
- Principal Component Analysis:
-
Association Rule Mining:
This technique is used to find the relation or dependence of one entity with the other based on certain rules. These rules are framed by analyzing large data by finding an association between two variables. For example, when a customer buys shoes, he is most likely to purchase socks or shoe polish as well. This transactional behavior is noted, and then a relation-based association rule is formed and is used for making recommendations in the future. Apriori Algorithm primarily focuses on data mining using association rules. With their help, we search the set of items or features seen together in a table referred to as a frequent item set. The Frequent Pattern Mining algorithm is applied to decide whether a new item can be purchased with the chosen frequently purchased item. The other terms defined with frequent item set are:- Absolute support:
The exact number of transactions that contain a particular item set. - Relative support:
The relative number of transactions that contain an item set relative to the total transactions. - Confidence:
It is the probability that if a person buys an item A, he will also buy an item B. With the help of these terms, a rule of association is formed to be used for recommendations in retail stores. A similar analogy is used in the medical field for patient data to identify associated diseases with the existing one.
- Absolute support:
-
Anomaly Detection:
Anomaly means deviations from regular features or values in a data set beyond set values. Outliers are those values that deviate quite a bit from expected ones, and so, if not removed from available data, data analysis would not be accurate but rather misleading. Hence, Outlier Analysis is a very important step in machine learning. Different techniques like numeric range setting, normal distribution, and z value, DBSCAN algorithm can be used for this purpose.
Popular R Language Packages Used to Implement Machine Learning
The R language offers a variety of packages for the implementation and evaluation of various models in machine learning. Let us explore these packages in detail:
- caret (Classification And Regression Training):
The caret package is a multi-purpose tool for training and testing different machine learning models. It has a single interface for many algorithms, making it easy to try other methods. We can apply it for different machine-learning tasks like cross-validation, tuning the hyperparameters, etc. We can install and load the "caret" package in the R environment using the following code:
- glmnet:
This package is helpful for fitting generalized linear models with L1 (Lasso) and L2 (Ridge) regularization. It is commonly used in regression and classification tasks. We can install and load the "glmnet" package in the R environment using the following code:
- randomForest and xgboost:
These packages are used to build ensemble models in machine learning. The randomForest package implements a random forest algorithm, while the xgboost package focuses on gradient boosting. They are widely used for both classification and regression tasks. We can install and load these packages in the R environment using the following code:
- e1071:
This package contains functions for statistical learning, including Support Vector Machines (SVM), Naïve Bayes, Short-time Fourier transform, Radial Basis Function (RBF) networks, and Fuzzy Clustering. It is commonly used for classification tasks. We can install and load the "e1071" package in the R environment using the following code:
- nnet:
This package provides functions for training single-hidden-layer neural networks, multinomial log-linear models, and conditional mixture models. It is commonly used for classification and regression tasks. We can install and load the "nnet" package in the R environment using the following code:
Applications of R in Machine Learning
The R language has a wide range of applications in machine learning. Let us discuss some of these applications:
- Predictive Analytics:
R is widely used for predictive modeling across various industries. For instance, in finance, it can predict stock prices, while in healthcare, it can forecast patient outcomes based on medical data. Additionally, it can be used in sports analytics to predict game outcomes or player performance. - Natural Language Processing (NLP):
R has packages like tm and tidytext that facilitate text mining and sentiment analysis. These tools are applied in sentiment analysis of social media data, customer reviews, and news articles. They can also be used for topic modeling and text classification. - Recommendation Systems:
R can be used to build recommendation systems, like those used by e-commerce websites, to suggest products/services to users based on their browsing and purchase history. It can also be used for collaborative filtering and content-based recommendation systems. - Time Series Forecasting:
R excels at time series analysis and forecasting. It forecasts stock prices, weather patterns, and product demand in supply chain management. - Fraud Detection:
R can be used to build fraud detection models in financial transactions, identifying suspicious activities and preventing fraudulent transactions. It can also be used for anomaly detection and risk assessment.
Conclusion
In conclusion,
- Machine learning in R is a powerful tool for data analysis and prediction.
- Supervised Learning techniques such as Linear Regression, Logistic Regression, Decision Trees, Random Forests, Support Vector Machines, and Naïve Bayes Classification are popularly used algorithms for predictive modeling in R.
- Ensemble methods like Boosting and Bagging are helpful in improving the model performance.
- Clustering methods like K-means, Hierarchical, and DBSCAN, along with dimensionality reduction methods like PCA and t-SNE, are valuable unsupervised learning techniques used for exploring and understanding data patterns.
Overall, R offers a wide array of packages for implementing Machine Learning, making it a versatile language for data science projects.