




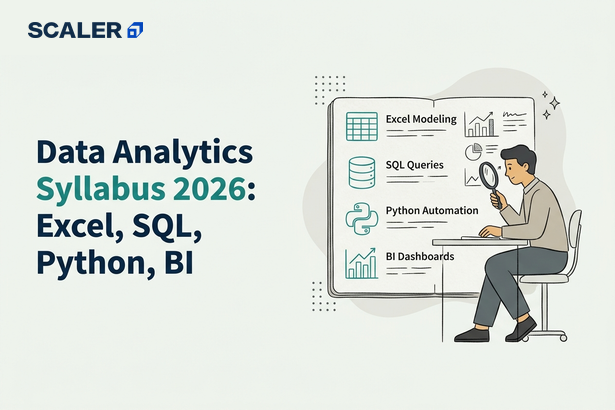
The data analytics syllabus may seem a bit overwhelming with a bunch of tools, a set of skills, and something new introduced every now and then. It may feel strange and be daunting, but that’s the reason why this field is so in demand.
So what exactly does the data analytics syllabus comprise?
One module talks about Excel, another introduces SQL, then suddenly you’re expected to learn statistics, Python, Power BI, and now even AI tools. At first glance, none of these subjects seems connected. After all, Excel is a spreadsheet tool, SQL works with databases, statistics focuses on interpreting data, and Python is a programming language.
But why are they all taught together? We’ll answer this in detail in this complete data analytics syllabus for 2026, what each module covers, why it’s included, and how modern courses are adapting to AI-powered analytics workflows.
What Is Data Analytics and Why Is It Important in 2026?
So, what is data analytics? It is the process of working with data to answer questions, solve problems, and support better decision-making.
It sounds really simple, but for an organization/company, it helps in answering the core of their business problems and practically helps in studying the market better. A company might want to understand why sales dropped in a particular region. An e-commerce business may want to identify which products customers are most likely to buy together. A bank could use analytics to detect unusual transaction patterns, while a healthcare provider might analyze patient data to improve outcomes.
Your work here is to identify patterns and solutions from the data.
Another major change in 2026 is the growing role of AI in analytics. Tools can now help generate SQL queries, clean datasets, create reports, and even build visualizations. But don’t worry, as these tools aren’t here to replace you but to simply make your work more efficient.
Data Analytics Syllabus 2026 at a Glance
Here are the data analytics subjects that we will be covering in this syllabus:
| Learning Stage | What You’ll Learn | Why It Matters |
| Data Foundations | Working with spreadsheets, data cleaning, formulas, and business metrics | Builds confidence in handling and organizing data |
| Database Analytics | Retrieving, filtering, and combining data using SQL | Helps access and prepare data for analysis |
| Statistical Analysis | Understanding patterns, relationships, and decision-making techniques | Ensures conclusions are based on evidence rather than assumptions |
| Data Automation | Cleaning, transforming, and processing data using Python | Makes analytics workflows more efficient and scalable |
| Visualization & BI | Creating dashboards, reports, and data stories | Helps communicate insights clearly to stakeholders |
| Exploratory Analysis & Applications | Identifying trends, uncovering insights, and solving business problems | Brings together concepts from earlier modules |
| AI-Powered Analytics | Using AI tools to support analysis, reporting, and automation | Improves productivity across the analytics workflow |
Why Is a Data Analytics Syllabus Structured This Way?
Because to understand the working and flow required in data analytics, you MUST go step-by-step from point a to z. And there’s a reason for it.
Before you can analyze data, you need to know how to organize it. Before you can identify trends, you need to retrieve the right data from databases. Before you can automate workflows, you need to understand what you’re analyzing. And before you can present insights, you need to know whether those insights can really work or not.
This is why most data analytics syllabus begin with foundational tools such as Excel and SQL, move into statistics and Python, and then progress toward visualization, projects, and AI-powered workflows.
Hence, when you read the roadmap, try to follow it step by step and avoid mixing it up based on maybe tools or theory, which might actually take you longer than it should.
So, let’s take a closer look at what each module covers.
Module 1: Data Foundations with Excel
Excel provides a beginner-friendly environment where you can learn how to work with datasets, which is especially used for excel for data analytics to identify errors, perform calculations, and summarize information. While many workplaces may rely on databases and analytics platforms, spreadsheets are still used for reporting, budgeting, operational tracking, and quick analysis.
This module is used for building familiarity with data itself before introducing more advanced tools.
Topics covered
- Data cleaning and formatting
- Functions and formulas
- Lookup functions
- Conditional logic
- Pivot Tables and Pivot Charts
- Basic dashboards
- KPI tracking and reporting
Learn with: Basic Excel Formulas
Why Is Excel Usually Taught First?
Because many of the concepts you’ll encounter later in SQL, Python, and Power BI are already in some way introduced in Excel. Like filtering data, performing calculations, creating summaries, and identifying trends are all tasks that can be performed using spreadsheets. Learning these concepts in Excel helps build a strong foundation before moving to more technical tools.
By the end of this module, you should be able to work with structured datasets, perform basic analysis, and present information in a clear format.
Start your learning journey for free with Scaler’s Programming and Coding Courses.
Module 2: Working with Databases Using SQL
Once you’ve learned how to work with data in spreadsheets, your next step will be to understand how to access and work with databases using SQL.
Since Excel is mostly used for smaller datasets, most organizations store information in databases. Customer records, sales transactions, inventory data, website activity, and financial information are often spread across multiple tables containing thousands or even millions of records. Hence, it is stored in SQL.
SQL is the language used to access, retrieve, and work with data stored in databases. It allows you to extract specific information, combine data from multiple sources, summarize results, and prepare datasets for further analysis.
This is why SQL is considered one of the most important skills in data analytics. Regardless of the industry or analytics tool being used, you’ll often need SQL to access the data before any meaningful analysis can begin.
Topics Covered
- Database fundamentals
- SQL queries
- Filtering and sorting data
- Aggregate functions
- GROUP BY and HAVING clauses
- Joins
- Subqueries
- Window functions
- Common Table Expressions (CTEs)
- Views
Learn More: Free SQL Online Course with Certification
Why Is SQL Usually Taught Before Python?
We have seen quite a lot of beginners who assume that programming is the first technical skill they should learn in analytics. However, it is better to get done with SQL before doing Python, and let us tell you why.
Before you can analyze data, you first need to access it.
In most organizations, data is stored in databases rather than spreadsheets. Whether you’re analyzing sales performance, customer behaviour, marketing campaigns, or financial transactions, your first task is often retrieving the right data from the database.
SQL is specifically designed for this purpose. It helps you extract, filter, combine, and summarize data efficiently without requiring extensive programming knowledge.
Python can then be used later when you need to automate workflows, clean larger datasets, or perform advanced analysis. But before any of that happens, you need access to the data itself, which is why SQL is typically introduced first.
By the end of this module, you should be able to retrieve data from databases, combine information from multiple tables, and prepare datasets that are ready for analysis.
Module 3: Statistical Thinking for Better Decisions
Through previous modules, you’ll be able to access data and perform a few calculations and functions. Once that’s done, you’ll need to understand the methods to understand how to interpret that data. To do this, you must have a statistical viewpoint to be able to decipher the problem.
Fortunately, learning statistics for data analytics is very different from studying advanced mathematics. Your focus won’t really be on solving complex equations but on understanding patterns, relationships, and the reliability of the conclusions you draw from data.
For example, if sales increase after a marketing campaign, how do you know the campaign actually caused the improvement? If one product performs better than another, how do you determine whether the difference is meaningful or simply due to chance? These are the types of questions statistics help answer.
Topics Covered
- Descriptive statistics
- Probability fundamentals
- Sampling techniques
- Correlation analysis
- Regression basics
- Probability distributions
- Hypothesis testing
- Confidence intervals
- A/B testing
Why Statistics Still Matters in the Age of AI
Modern AI tools can summarize datasets, identify trends, and even suggest possible explanations for patterns in data. While this can significantly speed up analysis, it does not eliminate the need for statistical thinking.
AI can tell you that a trend is there, but it cannot always determine whether that trend is statistically relevant. It can highlight relationships between variables, but it may not explain whether those relationships are strong, weak, or entirely coincidental.
Which is why you shouldn’t skip out on statistical knowledge. Understanding concepts such as sampling, probability, confidence intervals, and hypothesis testing will help you validate findings better so you can make a clear judgment.
As AI becomes more integrated into analytics workflows, the ability to question results and verify conclusions is becoming just as important as generating insights in the first place.
By the end of this module, you should be able to interpret data with greater confidence, evaluate the reliability of findings, and make decisions that are supported by evidence rather than assumptions.
Module 4: Data Preparation and Automation with Python
As datasets become larger and analytics tasks become more complex, spreadsheets often start reaching their limits.
Imagine having to clean thousands of records, combine multiple files, generate the same report every week, or prepare data for a dashboard manually. These tasks are possible in Excel, but they also become time-consuming as the volume of data grows.
Hence, we learn Python!
Python is one of the most widely used programming languages in analytics because it helps automate repetitive tasks, process large datasets efficiently, and perform analysis that would be difficult to manage using spreadsheets alone. The good news is that data analysts don’t need to learn software development. Instead, they focus on using Python as a practical tool for working with data.
Most data analytics courses introduce libraries such as Pandas and NumPy, which simplify tasks like cleaning datasets, transforming information, and performing calculations.
Topics Covered
- Python fundamentals
- Variables, loops, and functions
- Pandas
- NumPy
- Matplotlib basics
- Data cleaning
- Data transformation
- Working with CSV and Excel files
- Exploratory data analysis
- Automation workflows
Common Analytics Tasks Automated with Python
One of the biggest reasons Python is included in modern analytics curricula is its ability to automate repetitive work.
For example, instead of manually cleaning datasets every time new data arrives, Python scripts can automate the process. Multiple files can be combined into a single dataset within seconds, reports can be generated automatically, and dashboard-ready data can be prepared with minimal manual effort.
Some common analytics tasks that are often automated using Python include:
- Cleaning and standardizing datasets
- Combining data from multiple files or sources
- Generating recurring reports
- Preparing data for dashboards and visualizations
- Detecting missing values and anomalies
- Automating repetitive calculations
As analytics workflows continue to become more data-intensive, automation is increasingly becoming a valuable skill. Python helps analysts spend less time on repetitive tasks and more time interpreting results and generating insights.
By the end of this module, you should be comfortable using Python to clean, transform, and organize data while automating routine analytics tasks that would otherwise require significant manual effort.
Need help in getting started? Check out: python for data science
Module 5: Visual Storytelling and Business Intelligence
All the details and findings you gather from the data must be presented to the stakeholders. At that time, make sure everything is understandable to them, which is why the data is presented visually, and you explain it through it.
Think about it this way: a dataset containing thousands of rows may reveal an important trend, but if stakeholders cannot quickly understand that trend, the analysis loses much of its impact. This is why data visualization and business intelligence tools are such an important part of the data analytics syllabus.
You will require data visualization tools like Power BI and Tableau to create interactive dashboards and monitor key business metrics in real time.
Topics Covered
- Data visualization principles
- Choosing the right chart types
- Dashboard creation
- KPI reporting
- Data storytelling
- Power BI fundamentals
- Tableau fundamentals
- Interactive reports and filters
- Business intelligence workflows
What Makes an Effective Dashboard?
Always keep in mind that your dashboard should answer all the questions at a glance. It should highlight the most relevant metrics, make trends easy to identify, and present information in a way that supports action.
For example, a sales manager may want to track revenue growth, customer acquisition, and regional performance. A marketing team may focus on campaign results and conversion rates. While the visual layout matters, the real purpose of a dashboard is to help users understand what is happening and what action to take next.
That’s why it’s important to place significant emphasis on KPI reporting and data storytelling alongside visualization tools. Because your charts should be made in a way to be communicated effectively.
By the end of this module, you should be able to present analytical findings through dashboards and reports that make data easier to understand, explore, and act upon.
Learn More: EDA and Data Visualization Course with Certificate for free.
Module 6: Exploratory Analysis and Projects
By this stage of the syllabus, you’ve learned how to work with data in spreadsheets, retrieve information from databases, interpret results using statistics, automate tasks with Python, and communicate findings through dashboards.
Now you need to work with them all together and understand the workflow practically.
This is where Exploratory Data Analysis (EDA) becomes an important part of the learning journey. EDA is the process of examining datasets to understand their structure, identify patterns, detect anomalies, and uncover insights before performing deeper analysis.
Rather than jumping directly to conclusions, analysts use EDA to explore the data, ask questions, and understand what the information is revealing.
More importantly, this is the stage where analytics starts feeling less like learning individual tools and more like solving real business problems.
Topics Covered
- Data profiling and dataset understanding
- Missing value treatment
- Outlier detection
- Pattern discovery
- Trend analysis
- Correlation analysis
- Feature exploration
- Insight generation and reporting
How All the Modules Come Together
One of the reasons EDA is usually introduced later in the syllabus is that it requires concepts from multiple subjects.
For example, you may use SQL to retrieve data from a database, Python to clean and transform the dataset, statistical techniques to identify relationships and validate findings, and visualization tools to communicate the results.
This is why many learners consider EDA the point where the analytics workflow starts making complete sense. Instead of learning tools individually, you begin using them together to answer business questions and generate insights.
Common Analytics Project Categories
Most data analytics courses include projects that allow learners to apply their skills to real-world scenarios. These projects are typically based on datasets from different industries and business functions.
Some common project categories include:
Marketing Analytics
- Campaign performance analysis
- Customer segmentation
- Conversion funnel analysis
E-commerce Analytics
- Product performance tracking
- Customer behaviour analysis
- Sales trend forecasting
Finance Analytics
- Revenue and profitability analysis
- Budget tracking
- Financial performance reporting
Healthcare Analytics
- Patient outcome analysis
- Resource utilization studies
- Healthcare reporting dashboards
HR Analytics
- Employee attrition analysis
- Recruitment funnel tracking
- Workforce performance reporting
Projects play an important role in the syllabus because they demonstrate how multiple tools work together within a complete analytics workflow.
By the end of this module, you should be able to approach a dataset systematically, identify meaningful patterns, and combine multiple analytics tools to solve practical business problems.
Read More: 20 Best Data Analyst Projects for 2026 (Beginner to Advanced)
Module 7: AI-Powered Analytics Workflows in Data Analytics
Over the past few years, AI has become one of the biggest additions to modern data analytics curricula. However, contrary to popular belief, ai in data analytics is not replacing employees. Instead, it is changing how analysts work.
Many tasks that once required significant manual effort can now be completed much faster with AI-assisted tools. Writing SQL queries, cleaning datasets, generating reports, summarizing findings, and creating visualizations can all be supported by AI.
This is why many data analytics courses now include AI and Generative AI as a dedicated module. Rather than treating AI as a separate skill, the goal is to understand how it fits into the broader analytics workflow and where it can improve productivity.
Topics Covered
- Prompt engineering fundamentals
- AI-assisted SQL generation
- AI-assisted Python scripting
- Data summarization
- Dashboard and report generation
- Workflow automation
- AI-assisted exploratory data analysis
- Output validation and fact-checking
Also check out: Top 11 AI Tools for Data Analysis
Where AI Fits in the Analytics Workflow
AI can support almost every stage of the analytics process.
During data preparation, it can help identify inconsistencies and suggest cleaning steps. While working with databases, it can assist in generating SQL queries and explaining complex logic. During analysis, it can summarize trends, identify patterns, and automate repetitive tasks. It can even help create reports and dashboards that communicate findings more efficiently.
As a result, many analytics teams now use AI as a productivity tool that helps reduce manual effort and speed up routine tasks.
However, faster analysis does not automatically mean better analysis.
What AI Can and Cannot Do in Analytics
AI can be extremely useful when it comes to handling repetitive or time-consuming work.
AI can help with:
- Generating SQL queries
- Writing Python scripts
- Summarizing datasets
- Identifying patterns and trends
- Creating draft reports
- Automating repetitive workflows
However, there are still important areas where human judgment remains essential.
AI cannot reliably:
- Understand business context in the same way humans do
- Validate assumptions behind an analysis
- Distinguish between correlation and causation without guidance
- Take accountability for decisions
- Make final business recommendations
This is why modern data analytics courses continue to emphasize foundational concepts such as SQL, statistics, data visualization, and critical thinking. AI can help analysts work faster, but it cannot replace the ability to interpret results, question findings, and make informed decisions.
By the end of this module, you should understand how AI fits into the analytics workflow, where it can improve efficiency, and where human expertise remains indispensable.
If you’re planning a long-term career in the data domain, learning data science and AI can open up a wider range of opportunities. Check out this Data Science & ML Course with AI Specialization to build practical, industry-relevant skills.
Core Tools Covered in a Data Analytics Syllabus
These are the common tools that are used by a data analyst, these may vary with times and if anything new is introduce but till then, be prepared with these primary and basic ones:
| Category | Tools You’ll Learn |
| Spreadsheet Analytics | Excel, Google Sheets |
| Database Management | SQL, MySQL, PostgreSQL |
| Cloud Data Platforms | Google BigQuery, Microsoft Fabric |
| Data Analysis & Programming | Python |
| Python Libraries | Pandas, NumPy, Matplotlib |
| Data Visualization & BI | Power BI, Tableau, Looker Studio |
| Analytics Workspaces | Jupyter Notebook |
| AI-Assisted Analytics | ChatGPT, Microsoft Copilot, Gemini, Claude |
You don’t need to master every tool before applying for data analytics roles. Employers typically expect a strong understanding of Excel, SQL, one programming language (usually Python), and at least one visualization tool. The rest of your skills will continue to develop with hands-on projects and work experience.
How Long Does It Take to Complete a Data Analytics Syllabus?
In all honesty, the timeline mostly depends on how much time YOU can give for learning, but to provide an overall estimation, given you are consistent, you might take:
| Timeline | Focus Area |
| Weeks 1 – 4 | Data Foundations with Excel |
| Weeks 5 – 8 | Working with Databases Using SQL |
| Weeks 9 – 12 | Statistical Thinking for Better Decisions |
| Weeks 13 – 16 | Data Preparation and Automation with Python |
| Weeks 17 – 20 | Visual Storytelling and Business Intelligence |
| Weeks 21 – 24 | Exploratory Analysis and Real-World Applications |
| Weeks 25 – 28 | AI-Powered Analytics Workflows |
Keep in mind that this timeline is only a general guideline. Some learners may move through the curriculum more quickly, while others may spend additional time practicing projects, strengthening technical skills, or exploring advanced analytics concepts.
Don’t worry about completing the syllabus as quickly as possible; instead, give as much time as possible to become confident in your skills!
How to Evaluate a Data Analytics Course Before Enrolling
Not all data analytics courses cover the same depth of content. While many programs include familiar topics such as Excel, SQL, Python, and Power BI, the quality of learning often depends on how these subjects are taught and applied throughout the curriculum.
Before enrolling, take a close look at the syllabus rather than focusing only on course duration or marketing claims.
1. Curriculum Depth
You should look into the curriculum and see if cover the complete analytics workflow, from data preparation and querying to statistical analysis, visualization, and AI-assisted analytics. Be cautious of courses that focus heavily on tools without explaining the underlying concepts behind them.
2. Practical Projects and Case Studies
Analytics is a hands-on field. Look for courses that include real-world datasets, business case studies, and end-to-end projects that require you to apply multiple concepts together rather than isolated exercises.
3. AI Integration
As analytics workflows continue to evolve, many organizations now use AI tools to accelerate reporting, analysis, and automation. A modern syllabus should introduce learners to AI-assisted analytics while still emphasizing critical thinking and data validation.
4. Mentorship and Guided Learning
Learning technical concepts becomes easier when learners have access to instructors, mentors, or industry professionals who can provide feedback and help solve challenges. Guidance can be especially valuable when working on projects and case studies.
5. Career and Portfolio Support
While the syllabus should remain the primary focus, additional support, such as portfolio reviews, interview preparation, and industry exposure, can help learners showcase their skills more effectively once they complete the program.
Ultimately, the best data analytics courses do more than teach tools. They provide a structured learning path that combines foundational concepts, practical application, and modern analytics workflows to help learners develop real-world problem-solving skills.
Key Skills You Gain from a Data Analytics Syllabus
You should be able to develop a combination of technical, analytical, business, and AI-related data analytics skills. Let’s take a look at each skill set.
Technical Skills
Technical skills form the foundation of data analytics. Throughout the syllabus, you should gain hands-on experience working with datasets, databases, programming languages, and visualization tools.
1. Key technical skills include:
- Data cleaning and preparation
- SQL querying and database management
- Python programming for analytics
- Data transformation and automation
- Dashboard creation and reporting
- Data visualization using BI tools
2. Analytical Skills
Data analytics is all about making sense of information. Analytical skills will help you identify patterns, evaluate findings, and draw meaningful conclusions from data.
Key analytical skills include:
- Statistical analysis
- Trend identification
- Hypothesis testing
- Problem-solving
- Pattern recognition
- Data interpretation
3. Business Skills
Analytics creates the most value when insights can support business decisions. This is why the current and most recent data analytics courses also emphasize business understanding and communication.
Key business skills include:
- KPI tracking and performance measurement
- Business reporting
- Data storytelling
- Decision-making using data
- Presenting insights to stakeholders
- Translating business problems into analytical questions
4. AI Skills
As AI becomes a part of everyday analytics workflows, you will also be expected to understand how to use AI tools responsibly and effectively.
Key AI skills include:
- Prompt engineering fundamentals
- AI-assisted data analysis
- AI-generated SQL and Python workflows
- Automated reporting and summarization
- Output validation and fact-checking
- Using AI to improve productivity without replacing critical thinking
By the end of the syllabus, you will be equipped with a balanced mix of technical expertise, analytical thinking, business awareness, and AI-assisted problem-solving skills that are increasingly valued across industries.
If you’re exploring a career in tech and looking for a structured way to build in-demand skills, explore Scaler Academy. From software development and data science to AI, machine learning, cloud computing, and DevOps, you can find programmes designed to help you build practical, industry-relevant skills.
Conclusion
A data analytics syllabus may not seem linear; the whole roadmap has its demands, learning, and practice, and will unlock one skill to move on to another.
From Excel and SQL to Python, visualization tools, and AI-assisted workflows, each module builds on the previous one to develop a complete analytics skill set. The goal isn’t just to learn individual tools but to understand when to use them, how they work together, and how they support data-driven decision-making.
As analytics continues to evolve, modern curricula are also incorporating AI, automation, and real-world projects to reflect current industry practices. Whether you’re a student, graduate, or working professional, understanding the structure of a data analytics syllabus can help you choose a course that aligns with your learning goals and career aspirations.
Explore These Course Syllabus
Frequently Asked Questions
1. What is the syllabus of a data analytics course?
The Data analytics syllabus covers Excel, SQL, statistics, Python, data visualization, exploratory data analysis (EDA), and real-world projects. Modern curricula also include AI-assisted analytics, where learners use tools such as ChatGPT and Copilot to support querying, reporting, and workflow automation.
2. Is data analytics different from data analysis?
The terms are often used interchangeably, but data analytics is generally considered broader. Data analysis focuses on examining data to answer specific questions, while data analytics can include descriptive, diagnostic, predictive, and prescriptive techniques that support decision-making.
3. Do I need to code to learn data analytics?
Not necessarily. Many learners start with Excel and spreadsheets before moving to technical tools. However, learning SQL and basic Python can significantly improve your ability to work with larger datasets, automate tasks, and perform advanced analysis.
4. How long does a data analytics course take?
The duration depends on the curriculum and your learning pace. Most learners can build a solid foundation in data analytics within six to eight months, although shorter bootcamps and longer certification programs are also available.
5. Which tools are taught in a data analytics syllabus?
Most data analytics courses include tools such as Excel, SQL, Python, Power BI, Tableau, and Jupyter Notebook. Many modern programs also introduce AI assistants like ChatGPT, Microsoft Copilot, Gemini, and Claude to support analytics workflows.
6. Does the 2026 data analytics syllabus include AI?
Yes. Many data analytics courses now include AI-assisted workflows as part of the curriculum. Learners are introduced to generative AI tools and large language models (LLMs) that can help with SQL generation, exploratory data analysis, reporting, dashboard creation, and workflow automation.
