Amazon CloudWatch
Overview
Amazon CloudWatch is a monitoring and observability service that delivers data and actionable insights for customers to monitor applications, respond to system-wide performance changes, and optimize the usage of resources.
Transform Your Career
Choose from our industry-leading programs designed for career success
Modern Software and AI Engineering Program
Master full-stack development with AI integration

Modern Data Science and ML with specialisation in AI
Advanced data science techniques with AI specialization
Advanced AIML with Specialisation in Agentic AI
Deep dive into AIML with focus on Agentic systems
DevOps, Cloud & AI Platform Engineering
Build and manage AI-powered cloud infrastructure
AI Engineering Advanced Certification by IIT-Roorkee
Premier AI engineering certification from IIT-Roorkee
What is Amazon CloudWatch, and How Does It Work?
AWS resources and client applications operating on the Amazon infrastructure are monitored by AWS CloudWatch, a part of Amazon Web Services.
AWS resources like Elastic Compute Cloud (EC2) instances, Elastic Block Store (EBS) volumes, Elastic Load Balancing, and AWS Relational Database Service (RDS) instances can all be monitored in real-time using AWS CloudWatch. For measurements of CPU use, latency, and request counts, the program automatically gathers and presents them. Users can provide additional monitoring indicators, including memory use, transaction volumes, and error rates.
After learning more about AWS CloudWatch, let's know its typical procedure. AWS CloudWatch completes four tasks : it gathers log and metric data, monitors the applications, takes appropriate action, and analyzes the information for future use.
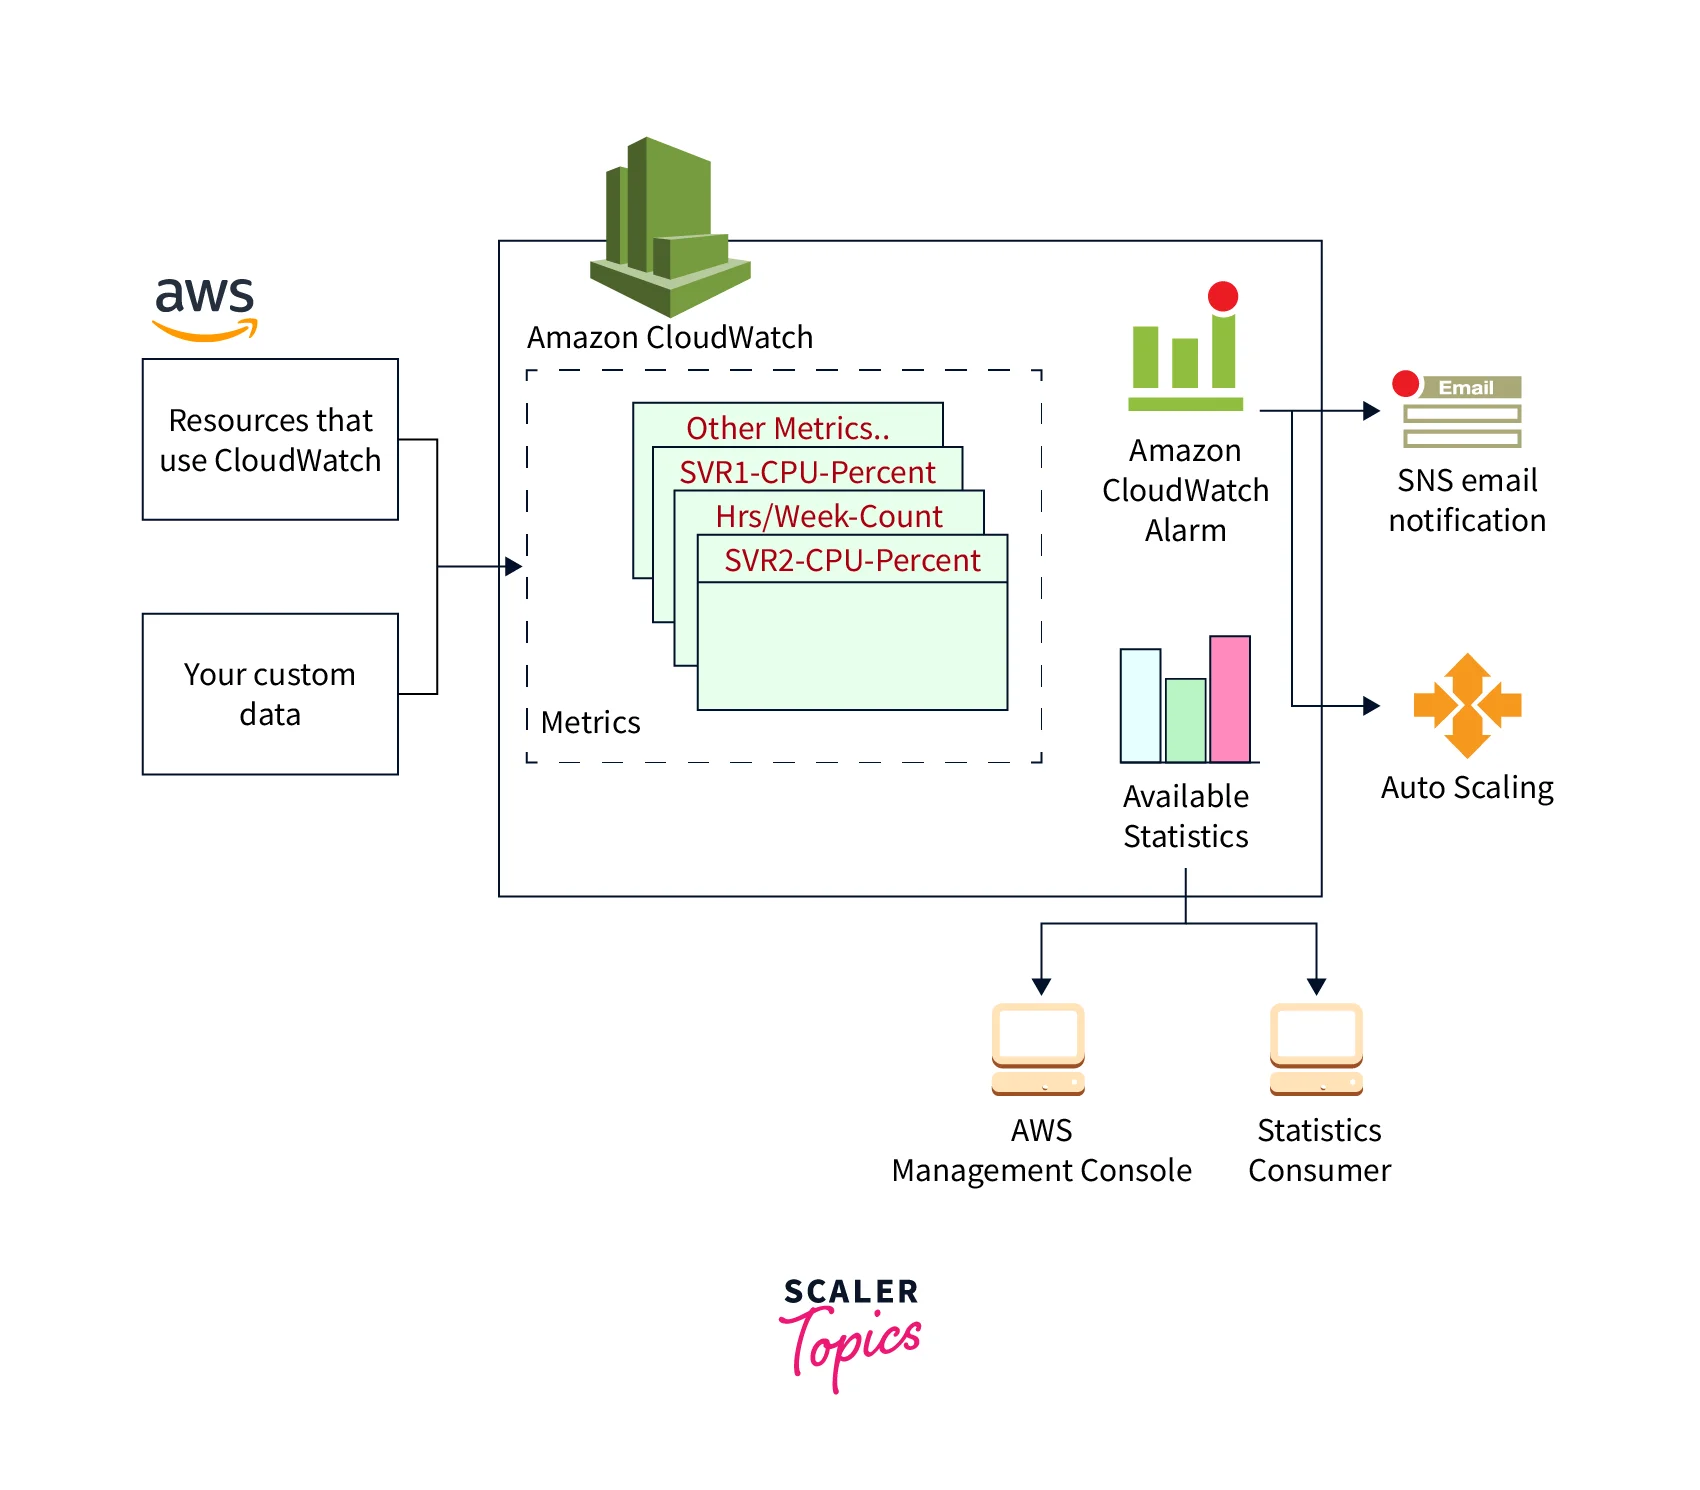
In essence, AWS CloudWatch is a storehouse for measurements. You may receive statistics based on measurements from the repository using an AWS service, such as Amazon EC2. You can also get your unique custom metrics data if you save them in the repository.
Metrics can generate statistics, which are then displayed graphically in the AWS CloudWatch console.
When conditions are satisfied, you may specify alert actions to stop, start, (or) terminate an Amazon EC2 instance. You may also set alerts that command Amazon EC2 Auto Scaling and Amazon Simple Notification Service (Amazon SNS) to take specific actions on your behalf.
The AWS Cloud's computing resources are kept in data centers with high levels of availability. Each data center facility is positioned in a specific geographic region known as a Region to offer more scalability and dependability. To achieve the highest level of failure isolation and stability, each Region is intended to be separated from the other Regions. Metrics are kept individually in each Region. However, you may combine metrics from many Regions using AWS CloudWatch cross-Region capability.
Features of AWS CloudWatch
Two key services are provided by AWS CloudWatch's features : Logging and Metrics. These two services are essentially a combination of AWS CloudWatch.
Service for Logging :
It includes gathering, managing, and keeping track of service and application logs.
Services for Metrics :
The resource and operational metrics performance are among the metrics services provided by AWS CloudWatch.
Let's now examine the combined functionality of AWS CloudWatch's logging and metric services.
-
Using AWS CloudWatch Logs : An interactive log query tool that aids in log data visualization and analysis. The log insights tool aids in filtering and aggregating log data, whether for publishing to the AWS CloudWatch dashboard or making time-series graphs to illustrate the data.
-
AWS CloudWatch Logs : This feature allows users to gather and store logs for various AWS services, including AWS CloudTrail, AWS API Gateway, and other AWS Services, as well as for particular applications and on-premises resources.
-
AWS CloudWatch Alarm : The AWS CloudWatch Alarm continuously monitors CloudWatch metrics. An alarm is raised if a measure (or metrics) exceeds the predetermined or preset thresholds. The AWS CloudWatch dashboard may also show the status of the alarm.
-
Automatic Resizing : Planning for capacity and resources is automated by AWS auto-scaling of CloudWatch.
-
Integrating AWS : It is well known that AWS CloudWatch makes it easier to integrate AWS Identity and Access management. These integration capabilities provide ownership, control over, and access to ClodWatch data and resources in a management console.
-
Events in AWS CloudWatch : It selects for AWS resource status changes and is in charge of producing a nearly real-time stream of events delivered to processing destinations. Eventually, the targets are informed of the state changes with these occurrences.


Benefits of AWS CloudWatch
Access all data from a single dashboard :
Due to their widespread distribution, web apps generate a lot of data, which can all be accessed through a single AWS CloudWatch interface.
View of the entire infrastructure :
You can compare and contrast data generated by various services because you can access all your AWS resources and services.
Lowering the total cost of ownership :
When the stated limitations are violated, AWS CloudWatch may be used to set high-resolution alarms and can execute automatic actions. This can reduce the amount paid for AWS services.
Observations from logs :
You get thorough insights on various AWS services and the apps you operate on the infrastructure. Information on memory usage, CPU usage, and monitoring capacity use and concluding it.
Application and resource optimization :
Using the log and metric data, you can tune your AWS services to deliver the highest throughput and performance.
Scaler Placement Report and Statistics
Scaler learners achieved 2.5x salary growth with average post-Scaler CTC reaching ₹23L.
AWS CloudWatch vs. AWS CloudTrail
| AWS CloudWatch | AWS CludTrail | |
|---|---|---|
| 1. It mainly focuses on events using AWS resources. | 1. It primarily focuses on who uses AWS and what they do there. | |
| 2. It is an AWS resource and application monitoring service. | 2. In the AWS account, it logs API activity. | |
| 3. You may track metrics and keep an eye on log files with Cloudwatch. You may also set alarms for different occasions. | 3. By logging AWS console operations such as who called, from which IP address, when, and the time of the call, CloudTrail gives users more insight into user behavior. | |
| 4. The application logs are precisely recorded. | 4. It offers details on what happened in your AWS account. | |
| 5. For extensive monitoring, it gives metrics data every 1 minute, and for simple tracking, it is every 5 minutes. | 5. Within 15 minutes after the API call, it produces an event. | |
| 6. It keeps measurements and records as data on its dashboard. | 6. It can centralize and store on an S3 bucket all the logs from many areas and even numerous accounts. | |
| 7. By default, it provides free access to essential monitoring resources like EC2 instances, RDS, etc. | 7. When an AWS account is established, it is activated by default and begins operating immediately. | |
| 8. The health of AWS resources is the main emphasis of AWS CloudWatch. | 8. The actions carried out within the AWS environment are the main focus of AWS CloudTrail. | |
| 9. It offers data gathering, analysis, and application health monitoring services. | 9. It offers AWS accounts Auditing services. | |
| 10. Logs are preserved in a particular group in CloudWatch. | 10. Logs in CloudTrail are kept in an S3 bucket. | |
| 11. There are paid and free price tiers for AWS CloudWatch. | 11. A free tier of AWS CloudTrail is available. You must set up a single trail if you wish to send a single copy of management events. |
AWS CloudWatch Pricing
There is no minimum purchase requirement (or) upfront cost when using AWS CloudWatch, you only pay for the AWS CoudWatch price that you use. At the month's end, you will be billed for your consumption.
Turn Learning into Career Growth
Free-Tier :
Amazon CloudWatch can be used without cost to begin started. Most AWS services (EC2, S3, Kinesis, etc.) automatically and at no charge provide metrics to AWS CloudWatch. These free tier restrictions ought to allow for the operation of several apps.
Paid Tier :
There is no minimum AWS CloudWatch price (or) upfront commitment. You only pay for your services, and you'll be billed at the end of the month. The payment date for the paid tier is the last day of each month, and the charges are based on the "Pay for what you use" concept. This bill's total will depend on how many metrics, APIs, and metric streams were used.
AWS CloudWatch Use Cases
-
To examine logs :
- AWS CloudWatch can be used to explore and analyze logs. By reviewing your logs, you can identify problems that can fix to boost the performance of your apps. In addition, the logs could help you figure out the reason behind the failure of the application.
-
To keep track of your applications :
- For EC2 instances, you can observe EC2 data like CPU use, memory usage, status checks, network traffic, and more. It provides information about your application so that you can act appropriately. For example, if you observe one EC2 instance approaching capacity, you may add another to avoid reduced performance or downtime.
-
To maximize resources :
- With AWS CloudWatch, you describe what occurs when a given threshold is met or not met. For instance, if a condition is satisfied, terminate an EC2 instance. Alternatively, different instances can be created to handle the increased load.
-
Real-time monitoring of EC2 instance logs :
- Aid with the monitoring of applications and systems by using log data
- May assist in tracking the amount of error occurring in applications, such as 404, 500, or even particular literal phrases such as "NullReferenceException", which can then be matched to a threshold to provide alerts.
-
Keep track of AWS CloudTrail Logged Events :
- Used to track specific API activity collected by CloudTrail by setting alarms in AWS CloudWatch and receiving alerts.
-
Archive Log Information :
- Can assist with highly reliable storage for the log data as an alternative to S3.
- The log retention option may be changed to force the automatic deletion of any log events older than the specified time frame.
-
Route 53 DNS query history :
- Can assist in logging data on the DNS requests that Route 53 gets.
-
Real-time Log Data Processing with Subscriptions :
- AWS Lambda, Kinesis stream, and Kinesis Data Firehose stream are just a few services that can receive real-time log events from AWS CloudWatch logs and process them, analyze them, or load them into other systems.
- A subscription filter specifies the filter pattern to restrict the log events supplied to the AWS resource, as well as details regarding the destination to which matched log events should be sent.
- Elasticsearch Service cluster data may be streamed via AWS CloudWatch Logs log group in almost real-time.
-
Filtering and Searching :
- By adding one or more metric filters, AWS CloudWatch Logs enables searching and filtering of the log data.
- As log data is uploaded to AWS CloudWatch Logs, metric filters describe the words and patterns to check for. AWS CloudWatch Logs use these metric filters to convert log data into numerical CloudWatch metrics that may be plotted or alarmed on.
Conclusion
- AWS CloudWatch mainly accomplishes four tasks : it gathers log and metric data, monitors the applications, takes appropriate action, and analyzes the information for future use.
- When the stated limitations are violated, AWS CloudWatch can be used to set high-resolution alarms and execute automatic actions. This can reduce the amount paid for AWS services.
- AWS CloudWatch helps you to get thorough insights on various AWS services and the apps you operate on the infrastructure. Information on memory usage, CPU usage, and monitoring capacity use and concluding it.
- AWS CloudWatch offers automated dashboards, data with one-second precision, and data storage and retention for up to 15 months. It also enables you to perform calculations data to gain operational and usage insights.