AWS Grafana
Overview
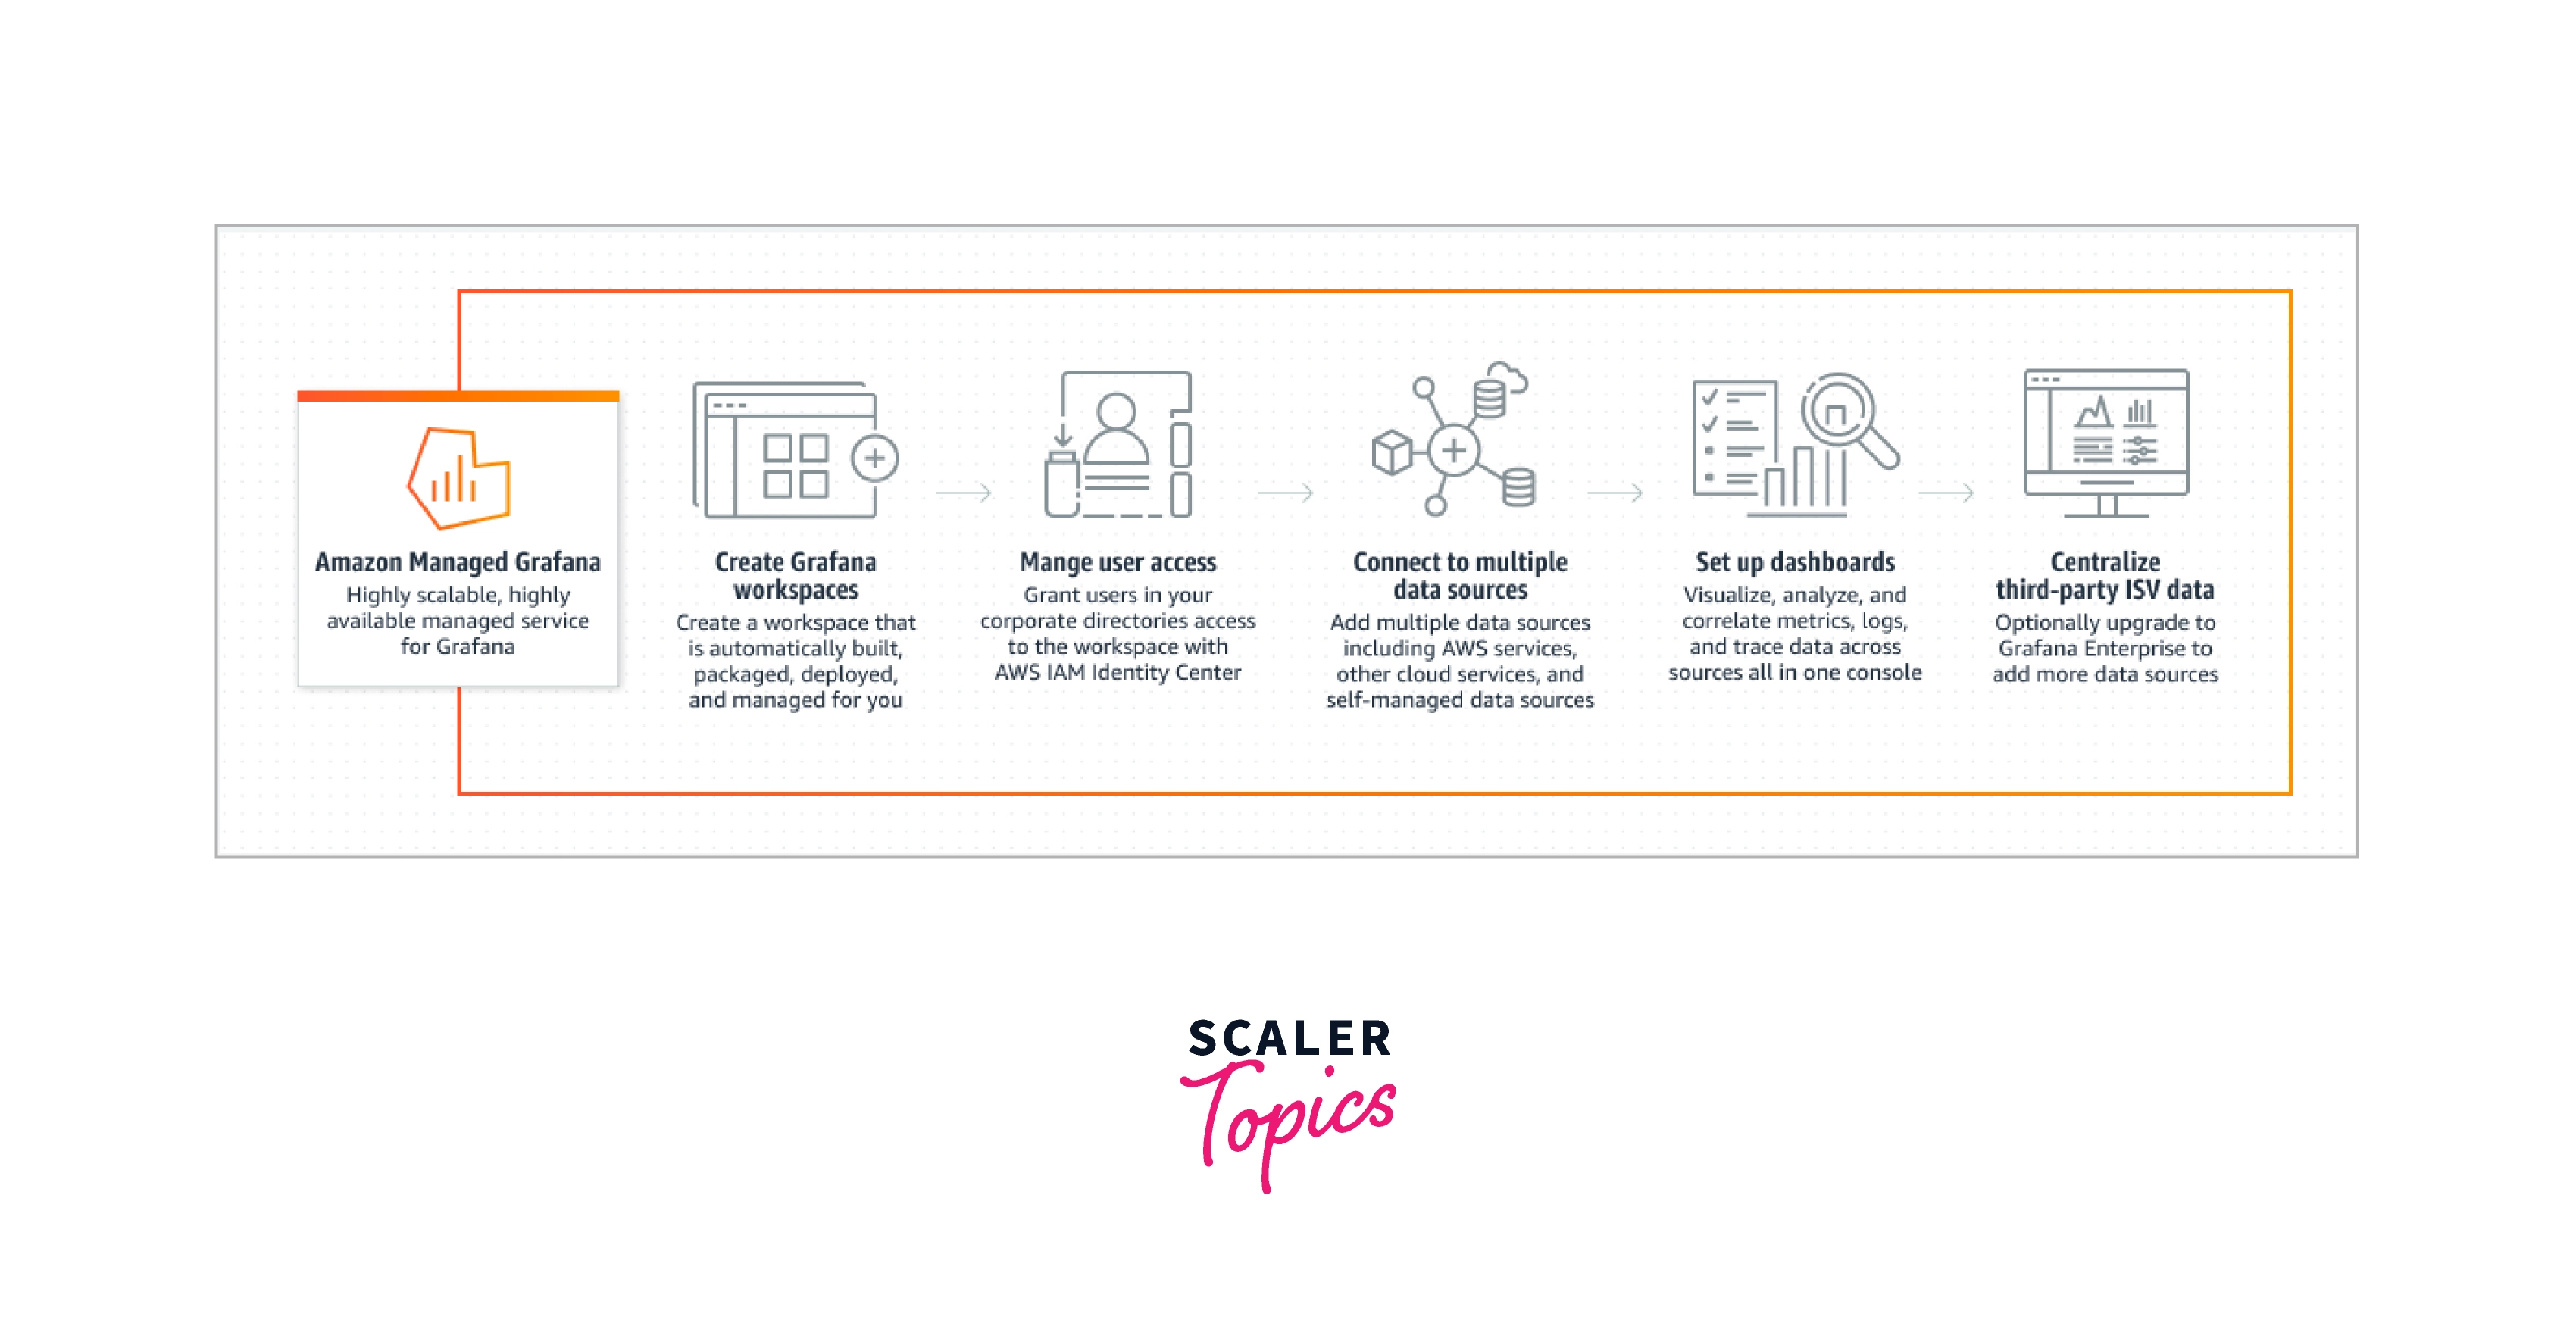
AWS Grafana is a fully managed and highly secure visualization service that enables users to search, integrate, and display operational data, logs and traces from a variety of sources in real-time. Workspaces are conceptually segregated Grafana servers created with AWS Grafana. You could construct a Grafana dashboard and visualization inside workspaces to examine the statistics, records, and traces without requiring you to build, pack, or install the Grafana server.
Transform Your Career
Choose from our industry-leading programs designed for career success
Modern Software and AI Engineering Program
Master full-stack development with AI integration

Modern Data Science and ML with specialisation in AI
Advanced data science techniques with AI specialization
Advanced AIML with Specialisation in Agentic AI
Deep dive into AIML with focus on Agentic systems
DevOps, Cloud & AI Platform Engineering
Build and manage AI-powered cloud infrastructure
AI Engineering Advanced Certification by IIT-Roorkee
Premier AI engineering certification from IIT-Roorkee
What is AWS Grafana?
AWS Grafana handles the provisioning, configuration, scalability, and management of the conceptual Grafana servers, thus customers don't need to by themselves. Amazon Grafana also includes built-in authentication methods for governance requirements, such as SSO, data access management, and auditing reports.
AWS sources of data that gather data sets, including such AWS CloudWatch, OpenSearch , X-Ray, IoT SiteWise, Timestream, and AWS Prometheus, are connected with AWS Grafana. A permissions provision tool for integrating compatible Amazon web services as sources of information is available in Amazon Grafana. Numerous well-liked open-source, 3rd party, and other cloud-based data sources are also supported by AWS Grafana.
Amazon Grafana may interface with IdPs that support SAML 2.0 for authentication process and authorization, in addition to AWS Identity and Access Management.
How AWS Grafana Works?
- Grafana distinguishes three sorts of users: administrators, editors, and viewers. Data sources, users, teams, files, and dashboards may all be added, updated, and removed by administrators.
- Editors may see, add, modify, and delete dashboards and alerts. Viewers can view dashboards that have been granted access, but they cannot create, change, or delete data sources, dashboards, or alerts.
- Amazon Managed Grafana works with several AWS Services, including Amazon Managed Service for Prometheus, Amazon CloudWatch, Amazon Elasticsearch Service, AWS IoT SiteWise, Amazon Timestream, and AWS X-Ray.
- Amazon Managed Grafana also supports plugins for other cloud providers such as Azure Monitor and Google Operations, as well as self-managed data sources such as Graphite, InfluxDB, and others.
Use Cases of AWS Grafana
- Standardize Your Reliability: Utilize metrics, logs, and traces from many tools to query and correlate them, then see and examine the results in a unified dashboard.
- Monitoring Container: Examine container statistics using Kubernetes operating on Amazon EC2, ECS, and EKS.
- Collaborative manner resolve operational challenges: Team members may monitor dashboard version updates, view and modify the dashboard in perfect sync, and share the dashboard with partners.
- Monitoring IoT equipment: Grafana is well-liked for analyzing IoT and peripheral device data because of its data structures plugins structure and rich charting features.
Attractive Features of AWS Grafana
- Analyse and correlate information from many sources of data
Within a single interface, Grafana interfaces to several data sources. AWS Prometheus is one of the Amazon web services that it seamlessly and safely interfaces with AWS Grafana. The AWS data may be accessed from different accounts and regions using queries. You might, for instance, keep an eye on the functionality and stability of your containerized apps.
- Utilize pre-built modules and dashboard to get going quickly
To build the necessary dashboard, AWS Grafana makes it simple to construct the appropriate queries and modify the display parameters. Unlike needing to start again from scratch, one can immediately begin displaying and interpreting data in the app thanks to the several post dashboard from data sets. A dashboard consists of a number of panels grouped into a series of rows. Panels, which are depictions of the queries, are the fundamental visualization foundation pieces of AWS Grafana.
- Set Up Notifications to Swiftly Find Problems
You may reduce service interruptions by rapidly spotting unexpected modifications in the application. You may create alerts using AWS Grafana to spot issues with the platform as soon as they arise. You provide the alert rules, the frequency at which it should be assessed, the circumstances under which the alarm must be triggered, and the format in which the alert notification is to be sent.
- Easy Client Identification and Authorisation for Sharing Dashboards
You can quickly share the dashboard with the team or with particular users thanks to Amazon Managed Grafana. You may utilize your current CDSs to offer access permissions and identification to the Grafana workspaces by integrating AWS IAM and SAML with Identity Providers. Give users Admin, Contributor, or Viewer capabilities to grant them Read/Write or Read-Only responsibilities. In order to limit access to the appropriate persons, you may also build Teams.
- Troubleshoot Issues and Work With Your Team
Grafana allows users to simply publish dashboards with groups of individuals and offer them access to information sources. Later-added members of the team also will acquire access privileges to resource sharing, eliminating the need to manually provide privileges one dashboard at a moment. Users may enable sharing of the dashboards with other teams or other entities by making publicly accessible dashboard snapshots.
- Security and Authentication
Connectivity to AWS Grafana is authorized through SAML 2.0 by AWS IAM by your current Identity Provider, allowing AWS and the enterprise users' directory to utilize existing development connections. Using audit logs supplied by AWS CloudTrail, you may trace modifications required to Grafana workspace for auditing and compliance tracking. AWS Grafana also detects sources in your accounts across various Regions and Organizations and dynamically configures the appropriate IAM rules to retrieve the data.
- There are No Servers to Maintain
You can quickly establish one or more workspaces in the Amazon Managed Grafana interface to display and evaluate the statistics, log, and trace before needing to create, pack, or install any infrastructure or technology. AWS Grafana simply generates, the system integrates, and maintains your Grafana workspaces, including regular version updates to keep your Grafana workstations up to with the most recent capabilities. The service automatically adjusts to suit your changing consumption requirements.
- Fully Automated Patch and Recovering System
By multi-AZ replication, Amazon Grafana workspaces are extremely available. It continuously monitors the health of Grafana workspaces and replaces ill nodes while avoiding interfering with Grafana workspace accessibility. AWS Grafana monitors the reliability of the computing and databases node, removing the need for users to begin, pause, or restart infrastructure components.
- Encryption and security
Amazon Managed Grafana encrypts your data at rest without special configuration, third-party tools, or additional cost. Amazon Managed Grafana also encrypts data in transit via TLS.


Amazon Grafana SSO Integration
User administration is one of the main problems with the Grafana solution. Although it offers connectivity with Google, Git, and other services, it still requires a lot of settings, and you are required to enroll the apps with the authentication providers.
The AWS SSO service is completely integrated with AWS Grafana, making it simple to accept additional users and manage its access. You may import organizations and responsibilities straight from authentication providers since SSO integrates so effectively with LDAP as well as other authentication systems. Additionally, you may employ this to implement any login safety rules already in place at the business, like the need for multiple verifications and strong passwords.
Scaler Placement Report and Statistics
Scaler learners achieved 2.5x salary growth with average post-Scaler CTC reaching ₹23L.
Amazon Grafana SSO Data Source Integration (Auto-Discovery)
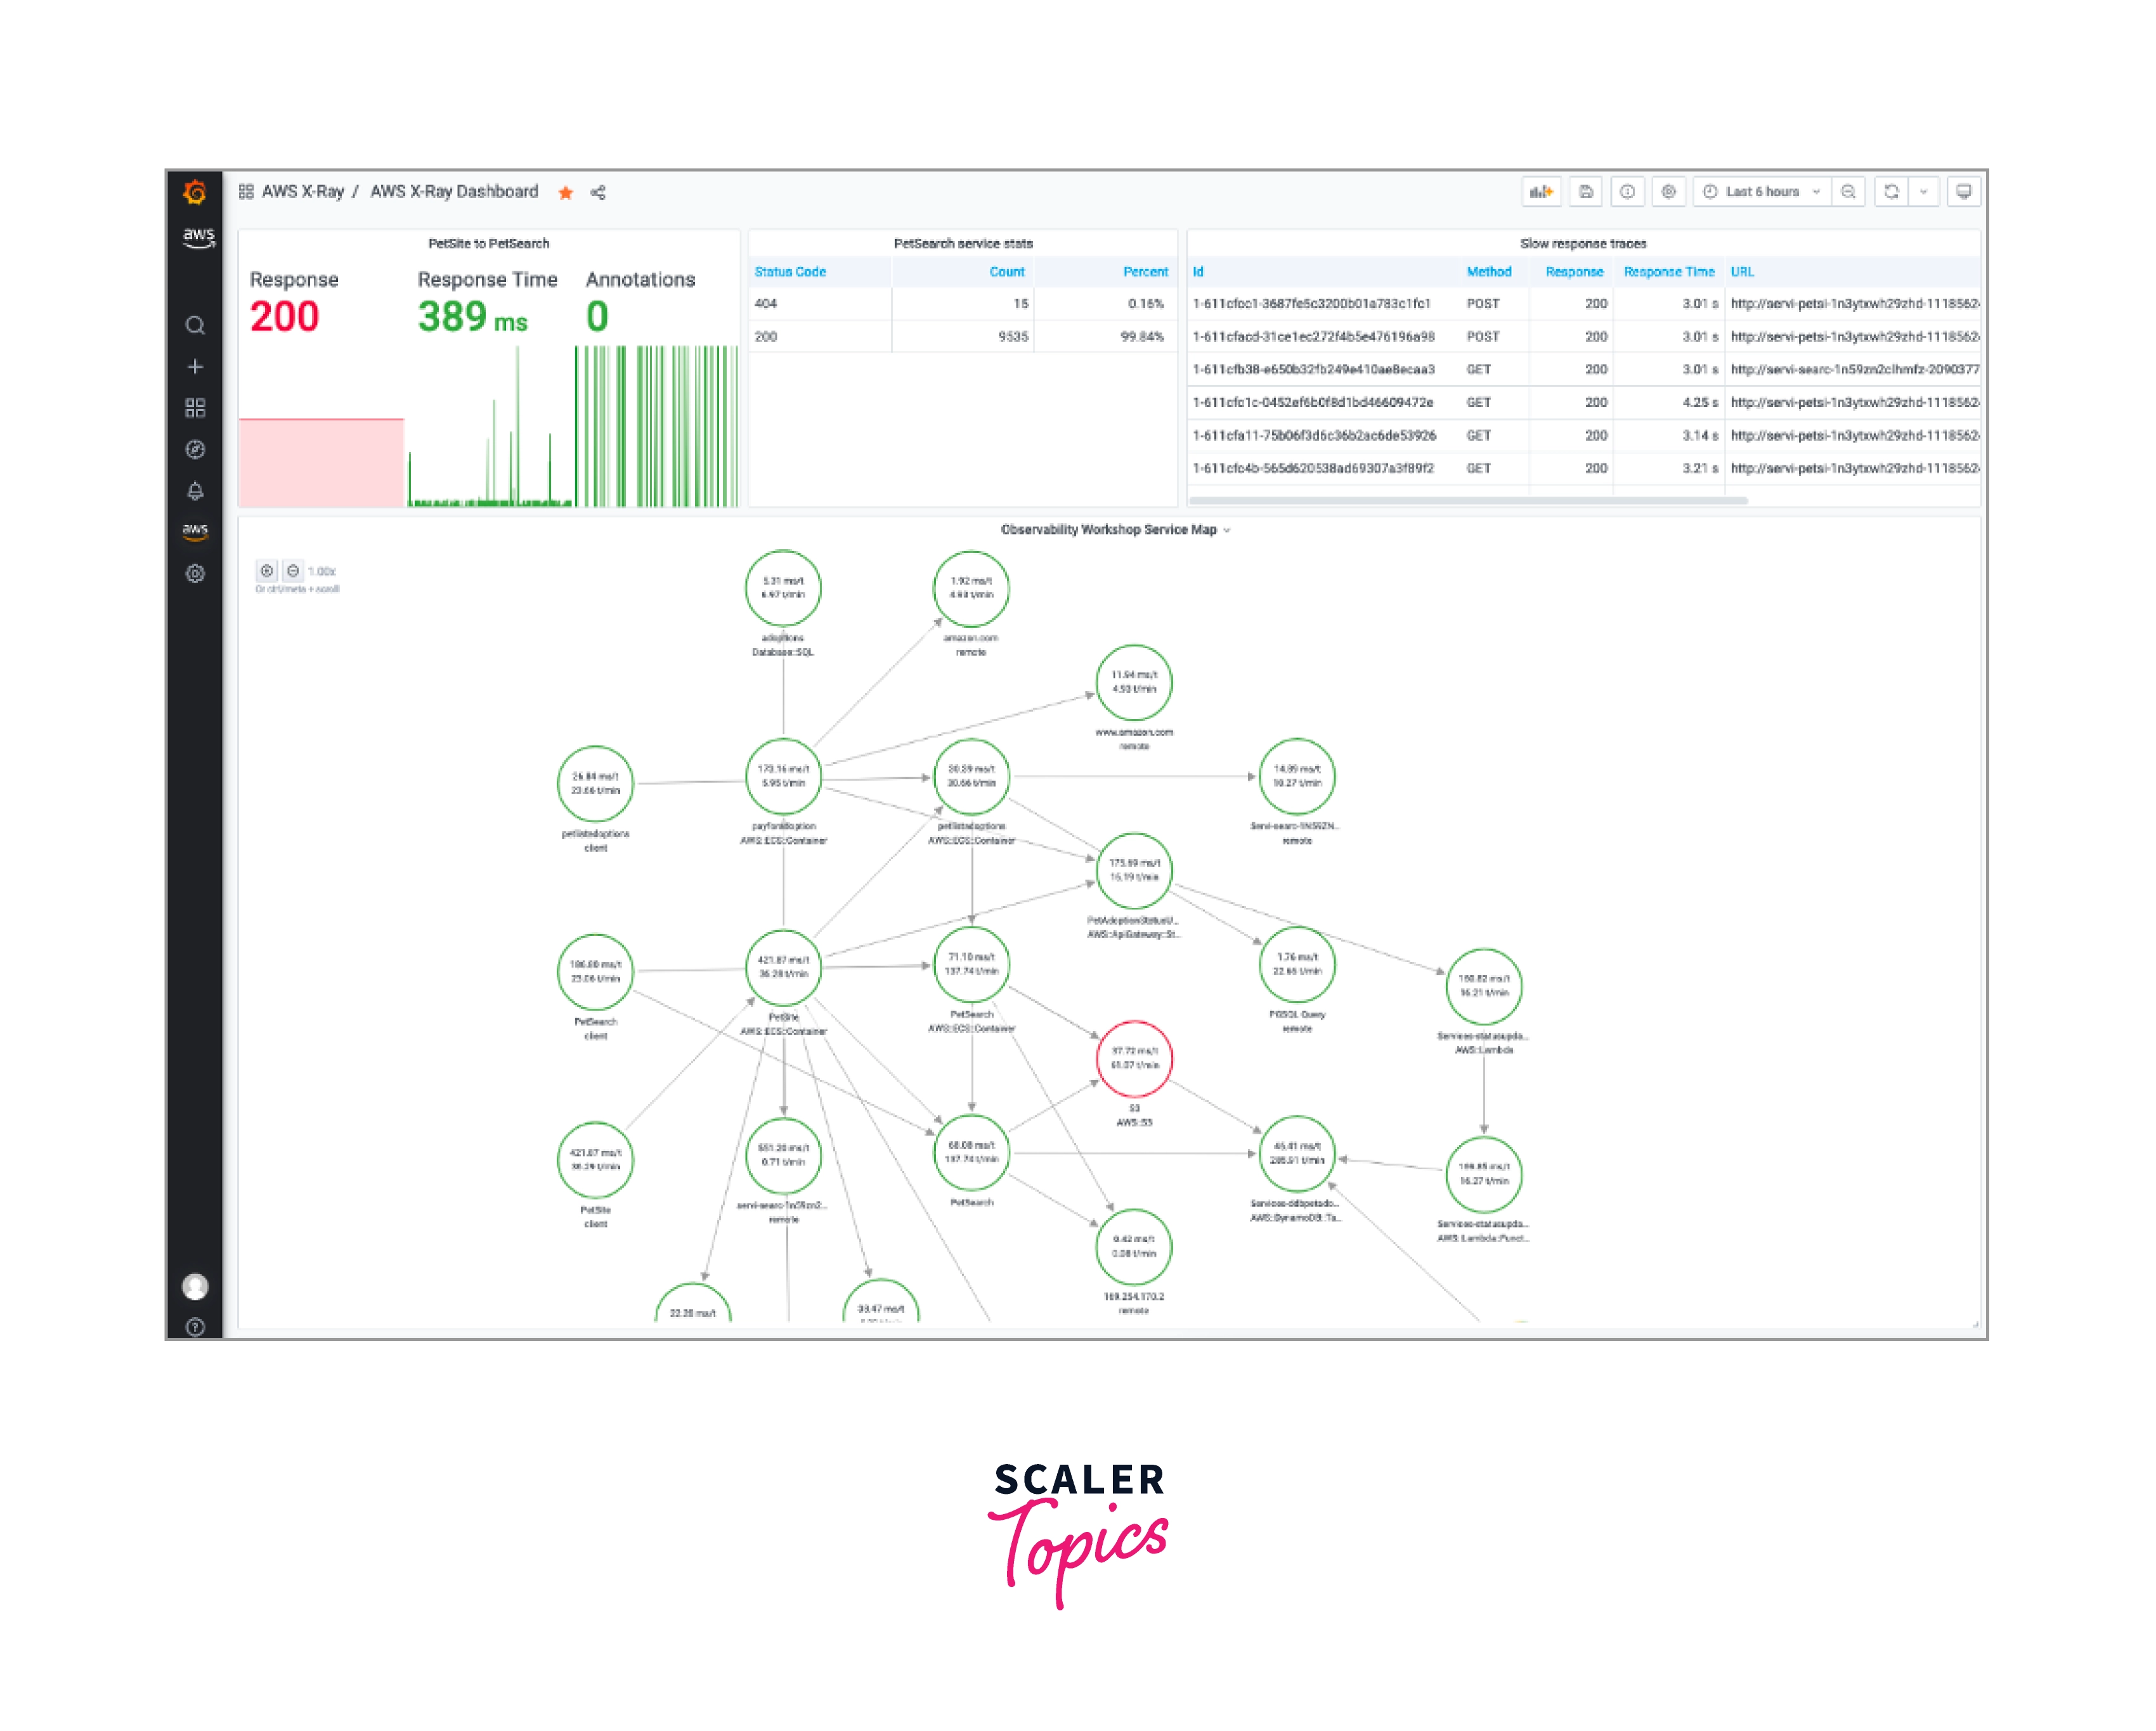
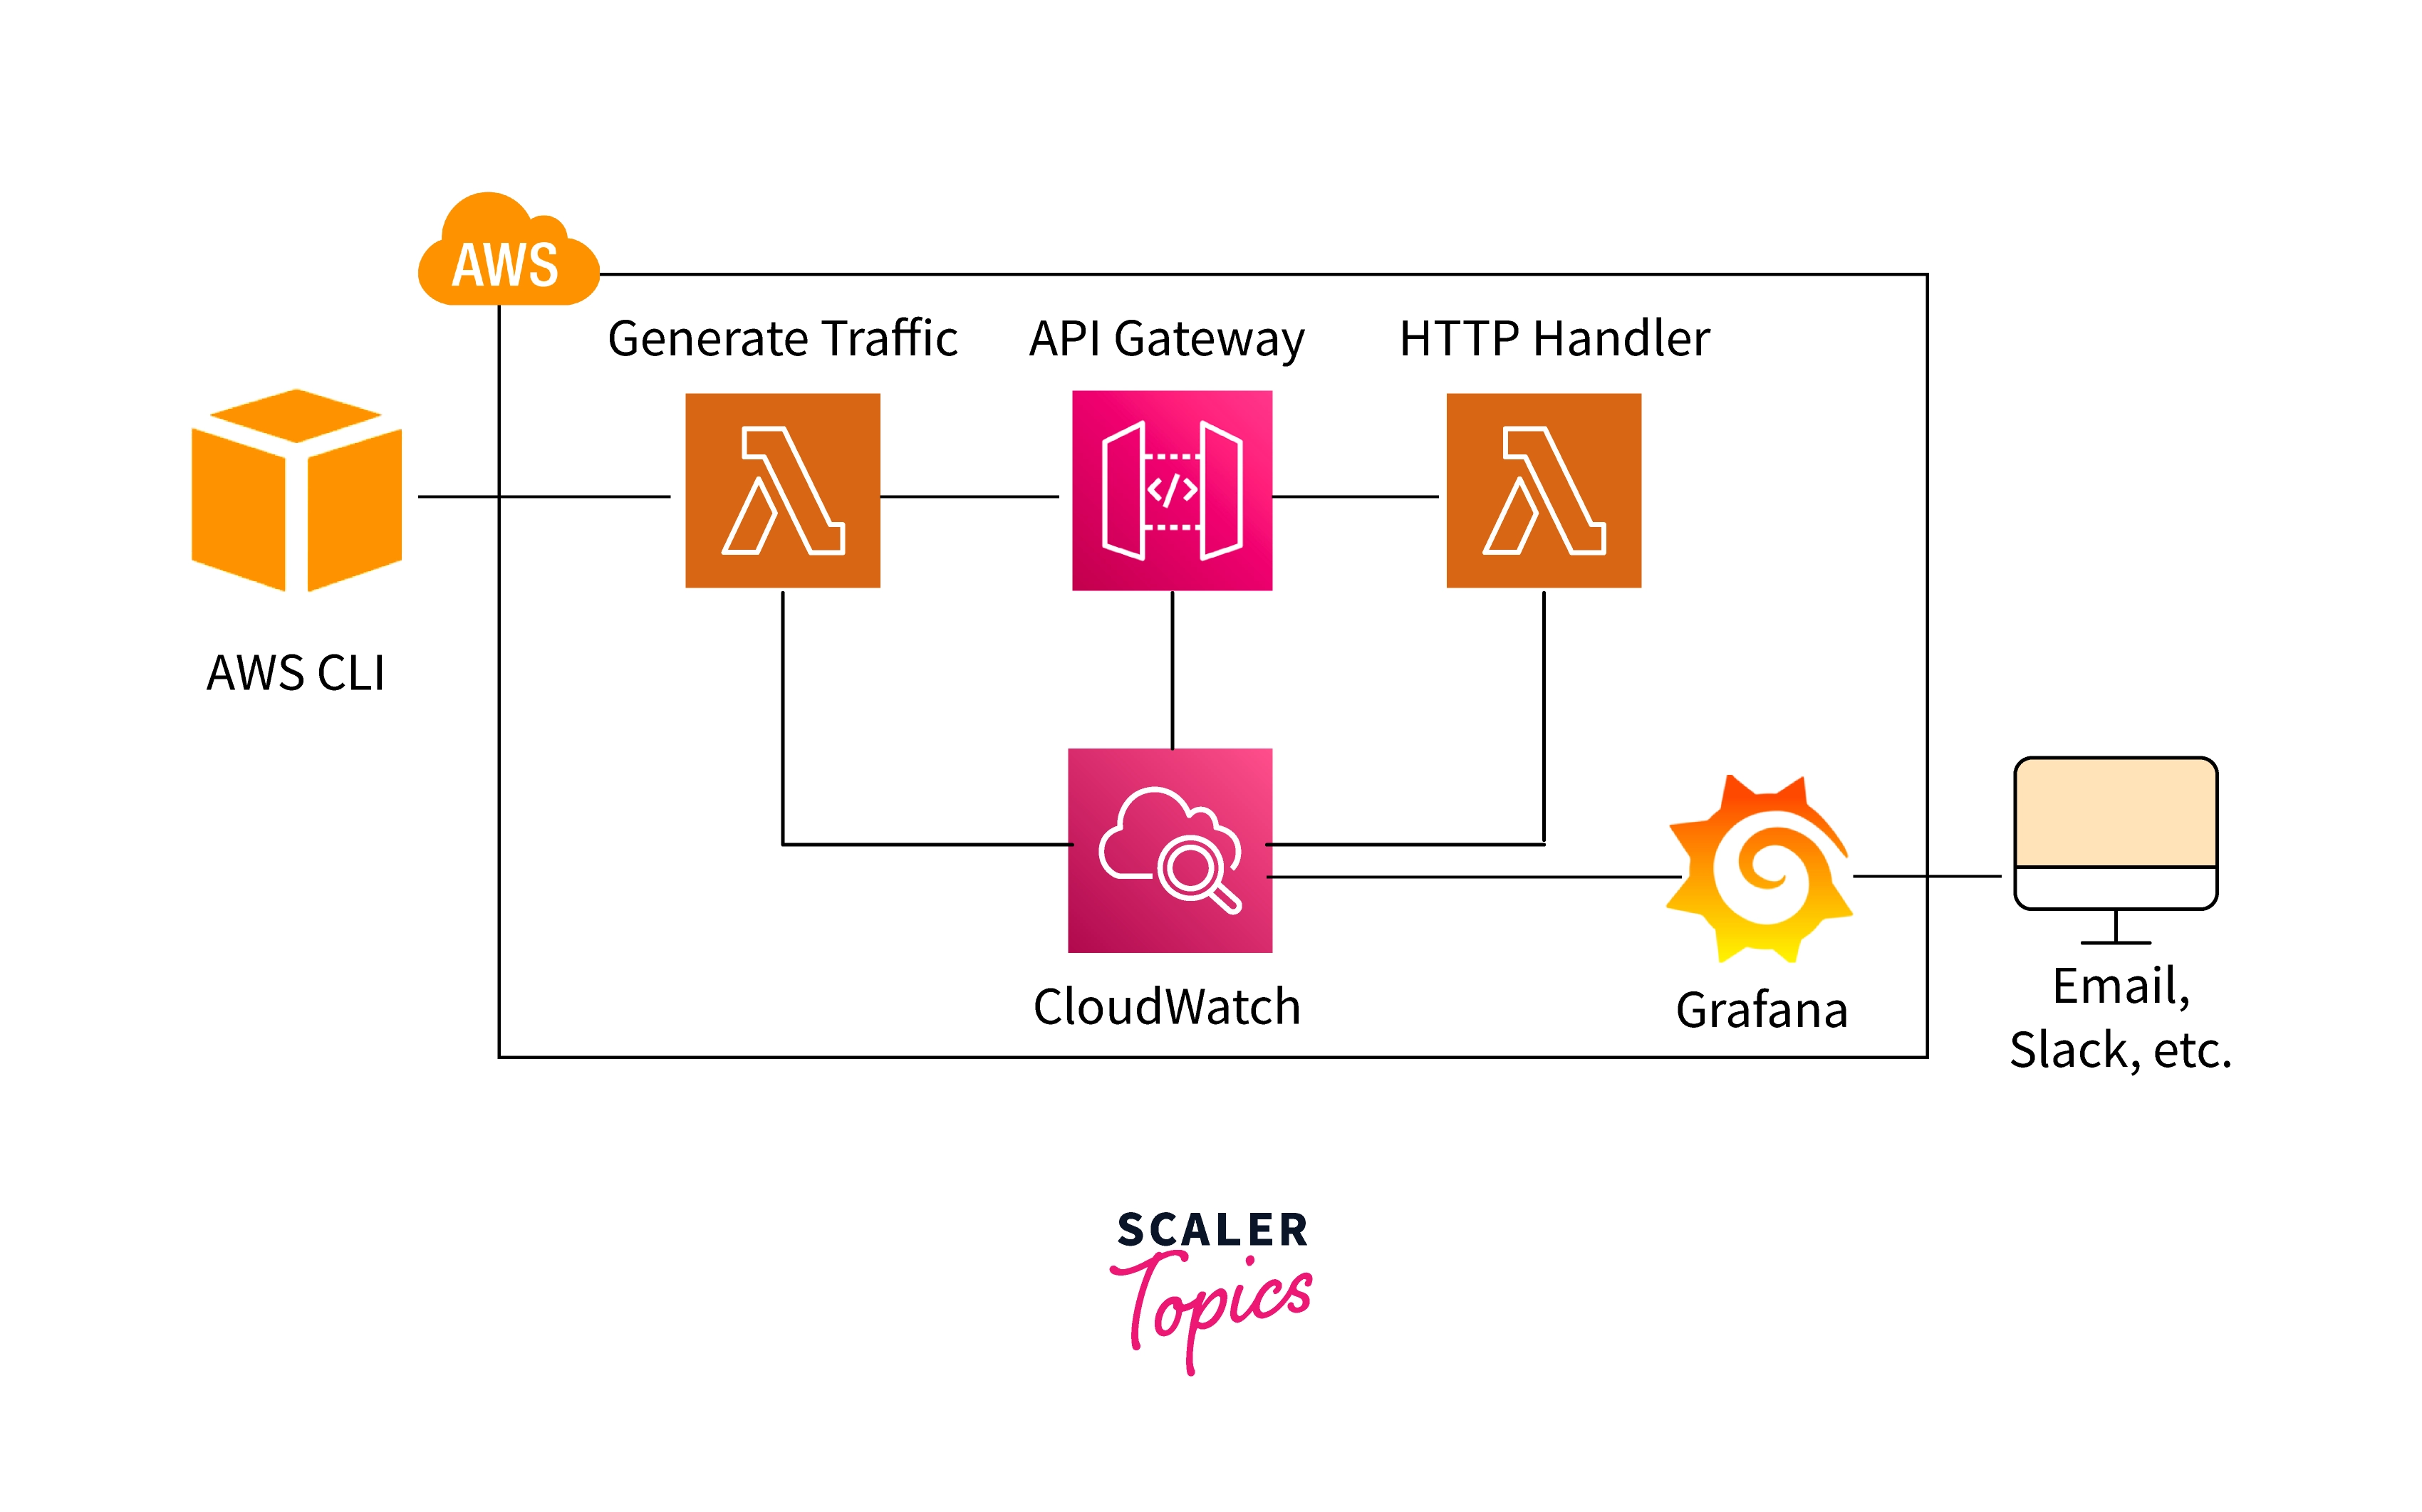
AWS Grafana securely and seamlessly interfaces with AWS services like AWS Prometheus, allowing users to search the AWS data across various accounts and regions from a single UI. To track the health and efficiency of the apps operating in containers, you may develop dashboards that connect container data from AWS Prometheus, AWS service metrics from AWS CloudWatch, and logs using AWS Elasticsearch Service.
The Grafana workspace would be ready to auto-discover those data sources after provisioning, eliminating the requirement for manual operation. This provides a significant benefit to self-managed Grafana since you don't have to worry about importing data in Grafana—AWS does all of the heavy labor. In addition, you can also utilize the Grafana UI to add different sorts of data sources.
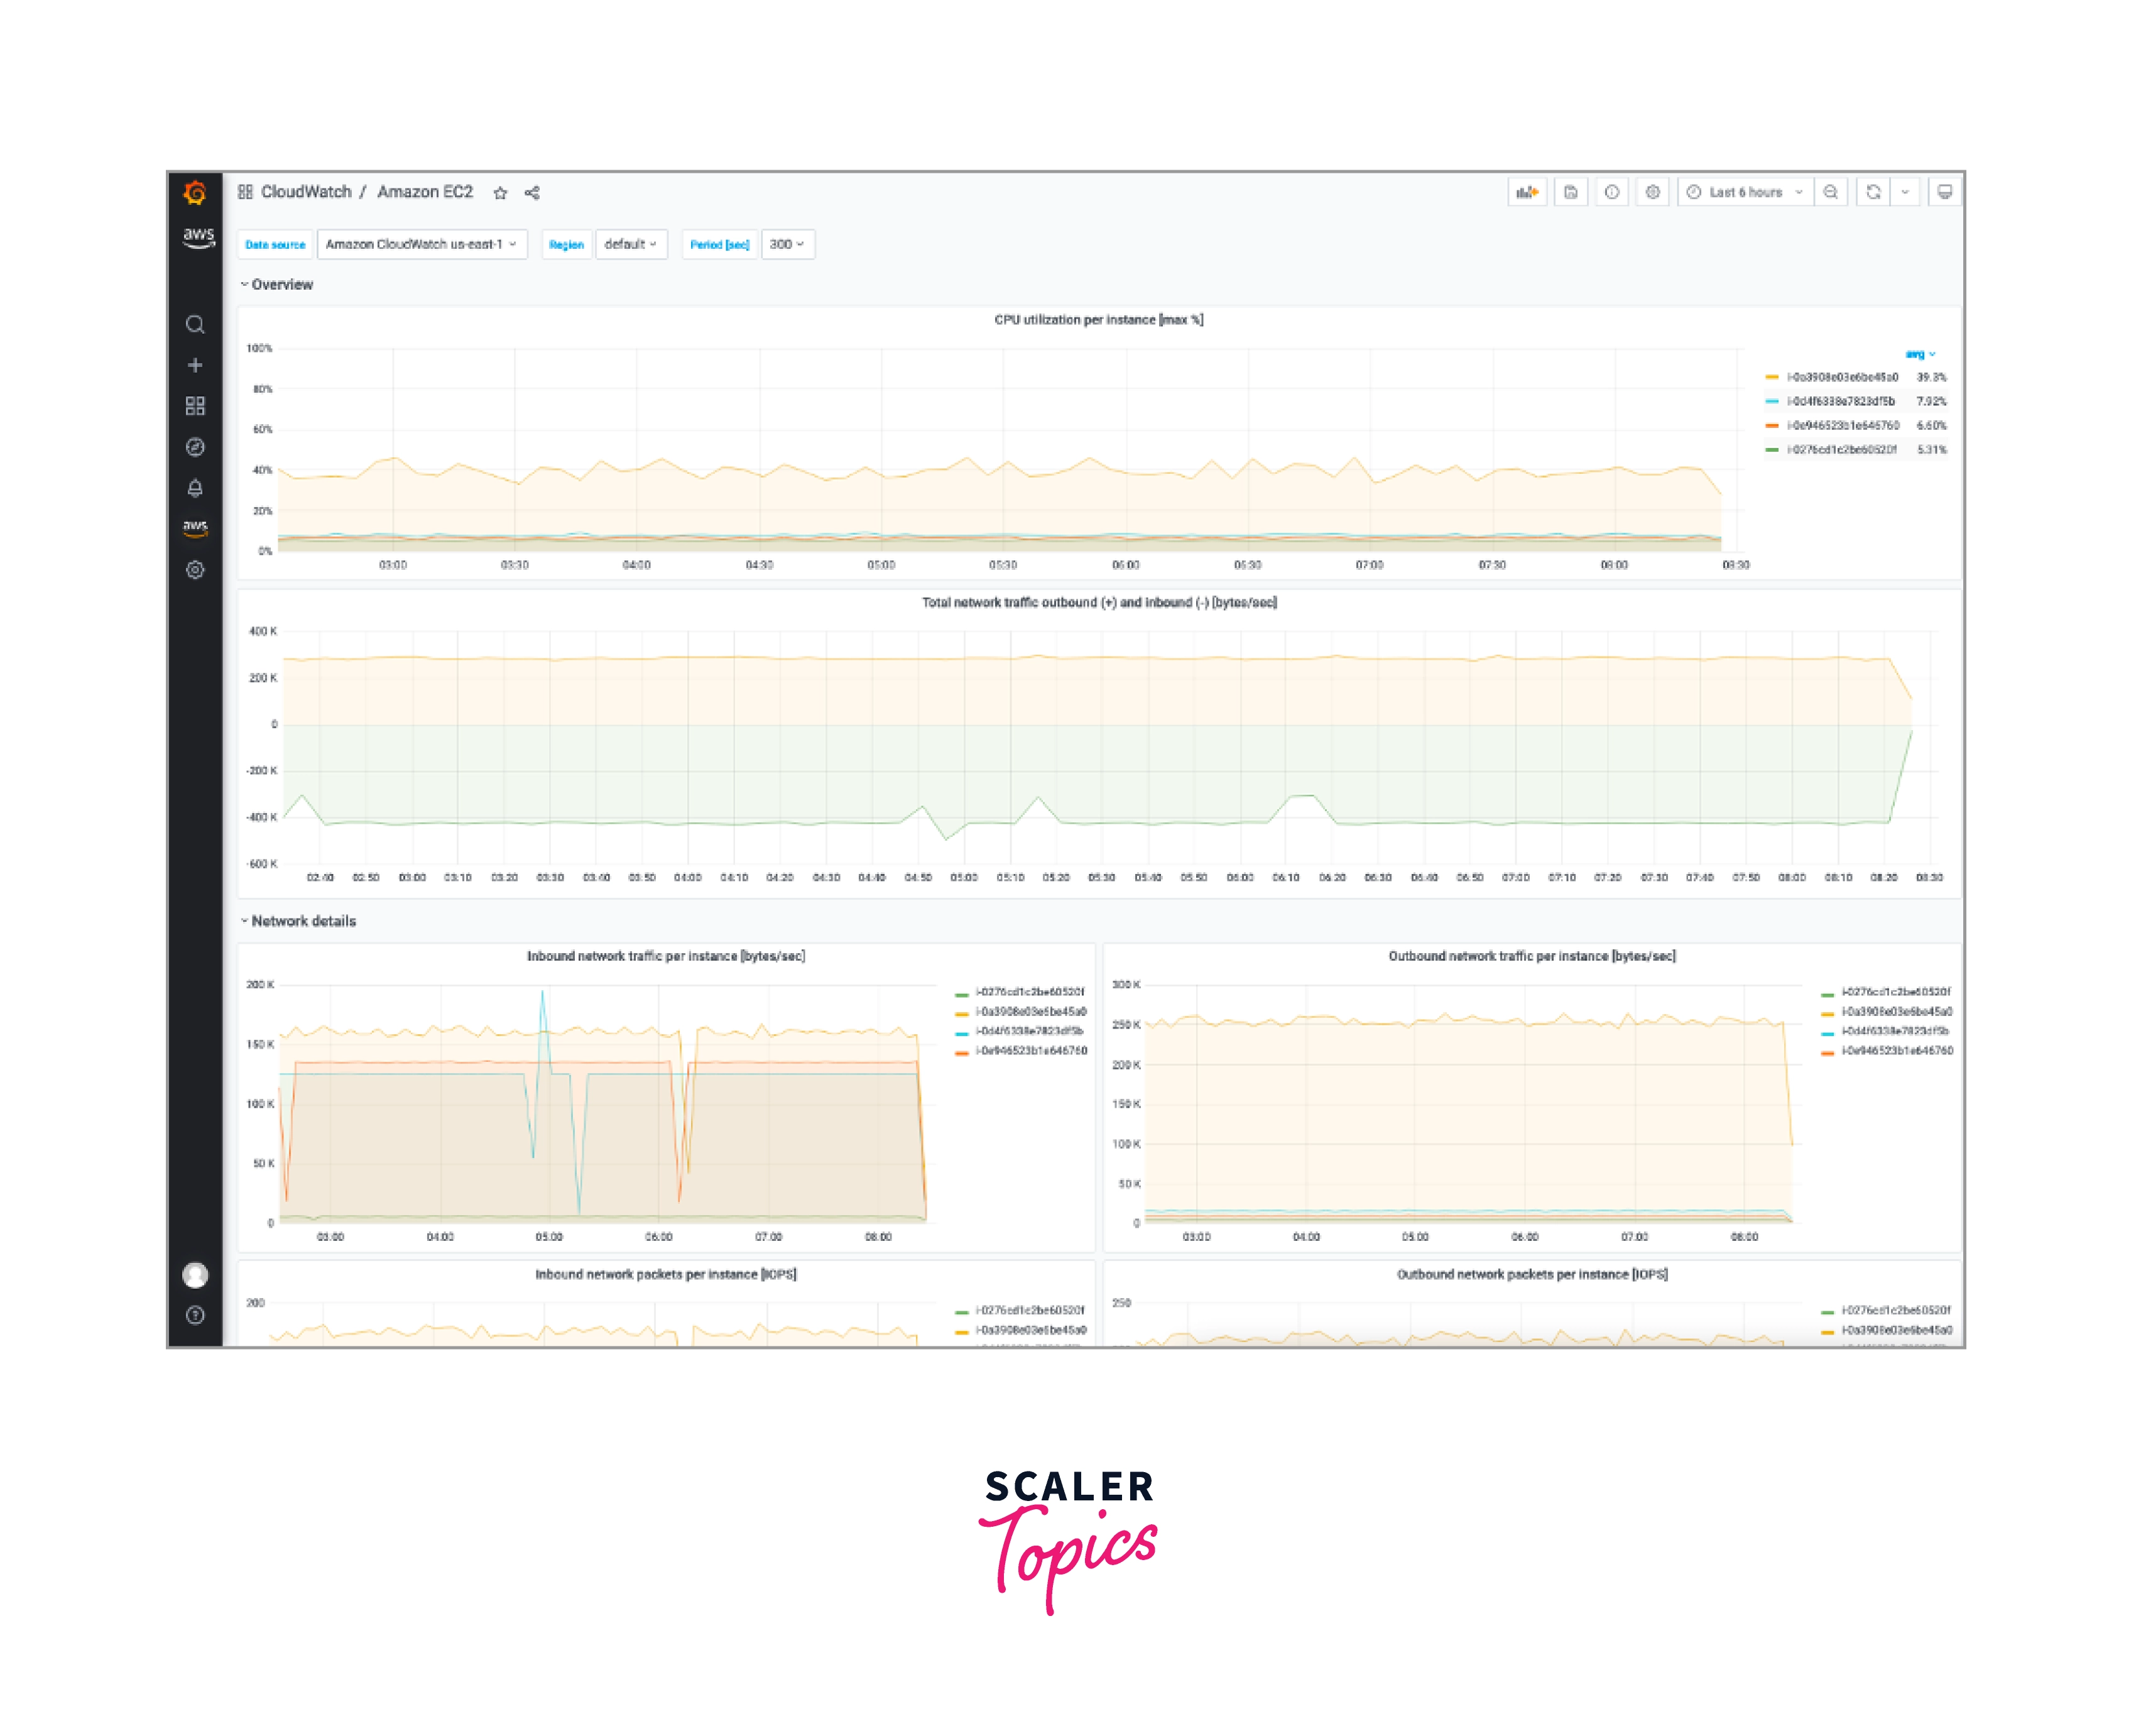
Amazon Grafana Out of the Box Dashboard
Grafana dashboards are large chunks of JSON documents that might be difficult to handle. Building such a dashboard is particularly difficult because you have to account for numerous template parameters, functions, time period options, and so forth. You will not have to perform any of those tasks using AWS Grafana. Amazon Grafana has a dashboard for all key data sources, including Prometheus, Cloudwatch, and others.
Amazon Grafana High Scalability and Availability
In respect of deploying and growing Grafana, AWS handles a significant portion of the work that was previously done by operations teams. This enables organizations to quickly enroll new users and apps.
AWS Grafana is presently available in the following regions:
- US East (Ohio)
- US East (N. Virginia)
- US West (Oregon)
- Asia Pacific (Seoul)
- Asia Pacific (Singapore)
- Asia Pacific (Sydney)
- Asia Pacific (Tokyo)
- Europe (Frankfurt)
- Europe (Ireland)
- Europe (London)
Turn Learning into Career Growth
AWS Grafana Infrastructure-as-Code Integration
It is best practice to manage cloud infrastructure as code. Terraform plugins are available almost for all AWS services, allowing for controlled modifications to cloud infrastructure.
Amazon Grafana is not an exception. Using Terraform, teams can simply automate the provision of Grafana workspace, adding sources of data, and creating dashboards. Terraform may be used to automate self-hosted configurations, although Terraform configuration files are notoriously complicated and difficult to maintain.
This is mostly due to the fact that they would also involve Virtual Machine provision and Grafana installation; however, if you pick the hosted service, the Amazon Grafana Terraform supplier will already start taking care of these tasks.
In short, only with very few clicks, you can create a highly available, expandable Grafana instance with a pre-configured dashboard and data sets, allowing you to begin observing the applications and analyzing business-critical information. AWS handles all of the extra overhead.
Limitations of AWS Grafana
In comparison to a Grafana service, Amazon Grafana solves several main pain problems, but it also has certain restrictions.
Insufficient smart analytic and events connection Grafana lacks the built-in ML features that might aid in the comprehension of metrics data. It's a terrific tool for making charts and graphs, but it's the user's responsibility to sound right about the result.
AWS Services are the only ones that provide data source auto-discovery. Modern applications and infrastructure groups need not rely on one cloud provider. Teams are increasingly embracing multi-cloud and heterogeneous architectures. Since not all metric sources of data are hosted on AWS, they can deny being found automatically by AWS Grafana. Non-AWS sources of data can be readily introduced to Amazon Grafana, they can also be linked to a standard Grafana service.
Inadequate Automation for Taking Any action Grafana may notify you whenever a given measurement threshold has been exceeded, it is unable to take corrective steps on our behalf. While alerting is important, contemporary infrastructure necessitates efficient automated solutions that can guarantee remedial procedures are started when teams are informed and professionals are accessible to alleviate disruptions.
Technology Beyond Grafana
These constraints lead us to believe that they require a more comprehensive surveillance system that not only addresses the problem of maintaining Grafana but also adds value in front of it. To fully manage your app and infrastructures, you'll need a solution that interfaces with contemporary time-series databases like Prometheus and takes information from all main cloud services like AWS Cloudwatch and Google's operational suite.
OpsRamp is based on Cortex, which would be Prometheu's highly available, scalability, storage. It offers first-rate support for various cloud-provider statistics, Prometheus, as well as other data sets. It can readily absorb vast volumes of metrics data and features powerful analytical and ML techniques that enable operations teams cut MTTR.
OpsRamp gives a unified view of your complete infrastructures and application stack. It has a far larger selection of visualizations and dashboards than Grafana. It also offers strong alerting features, allowing you to send alarm alerts to your channel of choice. It also includes SSO capabilities and can simply link with your group's appropriate people for improved access control.
FAQs
Q: What is Amazon Grafana?
A: AWS Grafana is a completely managed service that provides users with sophisticated, dynamic visual analytics to analyze, monitor, and warn on metrics, log, and trace from numerous data sources. With just an automatically scalable, highly available, and corporation service, you can develop dashboards and distribute them to anybody in your business.
Q: What is Grafana?
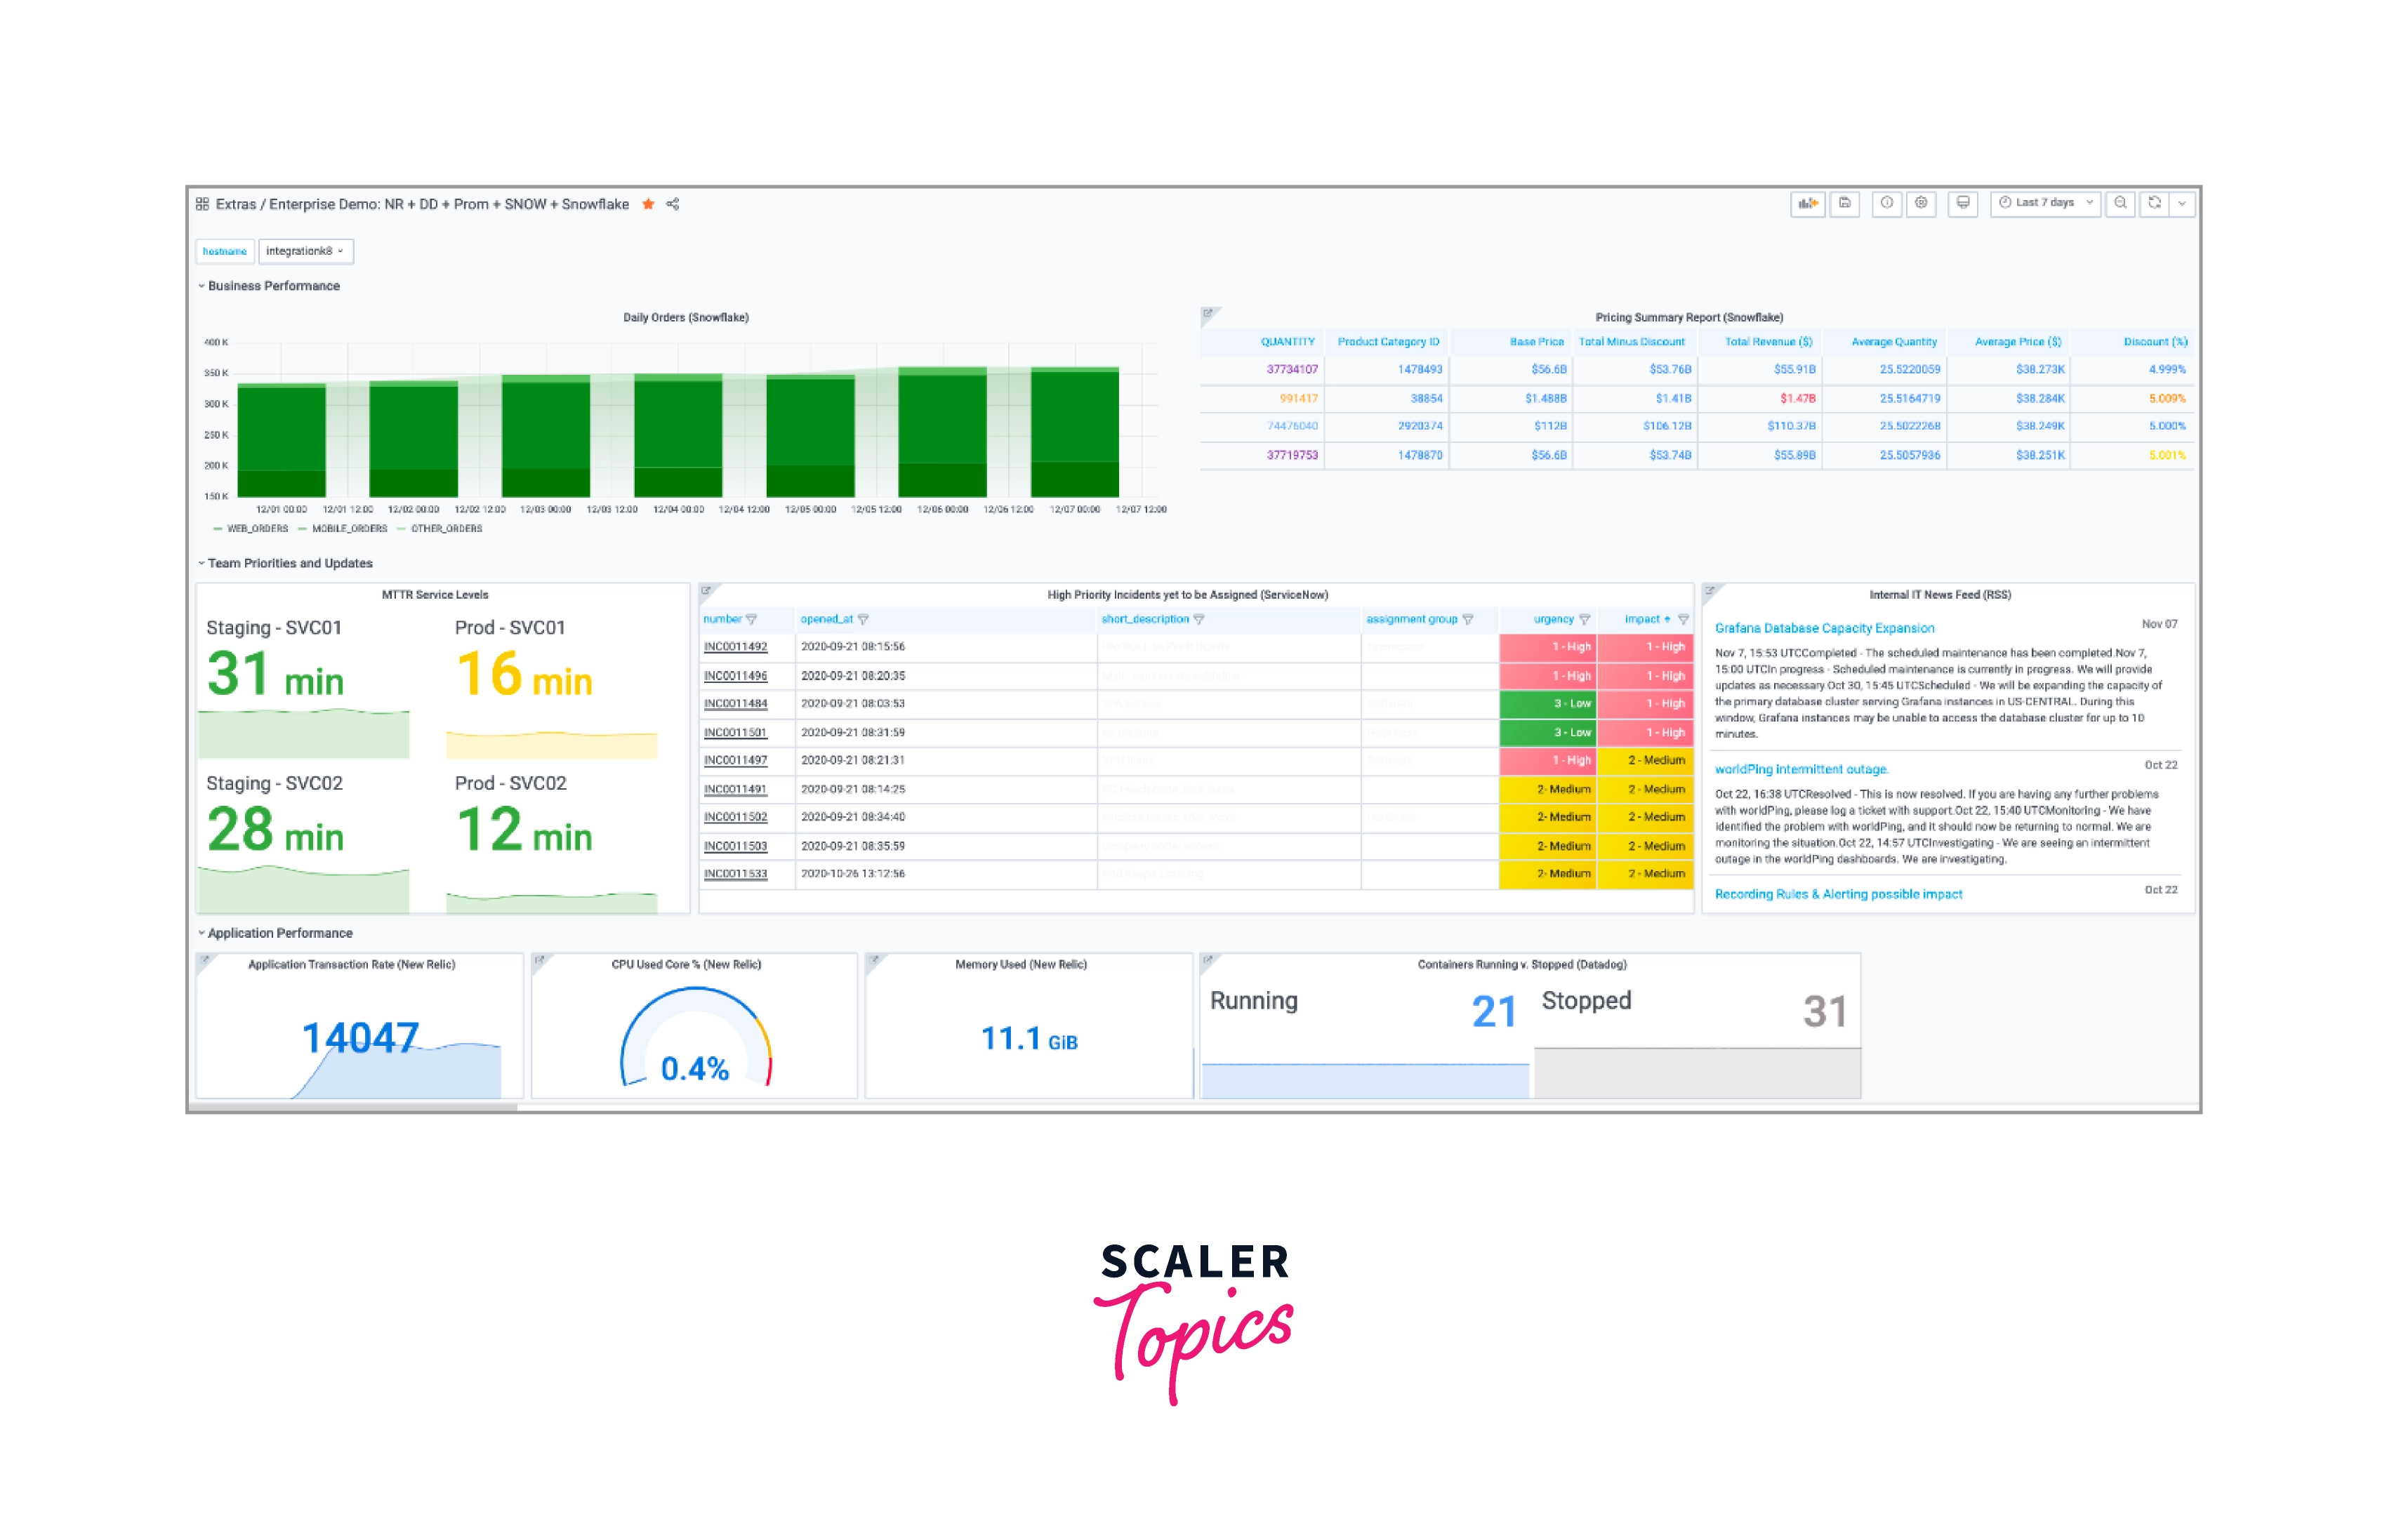
A: Grafana is an open-source analytic and interactive web application that runs on several platforms. When linked to supported data sources, it generates charts, graphs, and alarms for the web. Grafana Enterprise, a licensed version with enhanced functionality, is now available as a self-hosted deployment or as an account on the Grafana Labs cloud service. It may be expanded via a plug-in system. Using interactive query builders, end users may develop complicated monitoring dashboards. Upgrade one or more workspaces if desired; each upgraded workspace will have access to Enterprise plugins. Data from AppDynamics, Atlassian Jira, Datadog, Dynatrace, Gitlab, Honeycomb, MongoDB, New Relic, Oracle Database, Salesforce, SAP HANA, ServiceNow, VMware Tanzu Observability by Wavefront, and Snowflake may be queried and visualized.
Q: What is an AWS Grafana Workspace?
A: A workspace is a Grafana server that is logically separated. After you've built a workspace, you may connect it to sources of data and search and display metrics from those sources. You may build numerous Grafana workspace per Region and per account, allowing you to monitor both Prod and Dev workloads independently.
Q: How can You give access to your AWS sources of data across many accounts and regions?
A: AWS Grafana works using AWS Organization to locate Aws services and assets inside your Organizational Units. AWS Grafana will immediately construct the IAM rules required to give read-only access to the AWS Services data for the account and Region you specify using AWS CloudFormation StackSets. You may quickly add or delete accounts, Organizations, and Regions from any Grafana workspace by the AWS Grafana console.
Q: When will I require a Grafana Enterprise license?
A: AWS Grafana gives customers access to OSS Grafana functionality as well as improved features like SAML and AWS SSO, audit reporting, and workgroup sync. If users require access to the Grafana Labs Enterprise source of data plugin, they must acquire a Grafana-based Enterprise license from Amazon web services. This involves a single-click operation that may be accomplished using the AWS Grafana interface.
Q: How can I make the switch to Grafana Enterprise?
A: You may migrate to Grafana Enterprises by selecting the workspaces in the AWS Grafana interface.
Q: Can AWS Grafana Workspace be created using CloudFormation?
Ans: This one is presently not enabled.
Q: Will API requests be charged?
A: When interacting with an Amazon Managed Grafana workspace, there are three sorts of API calls. The first category consists of Amazon Managed Grafana APIs, which are used to create, update, and remove workspaces. These are free of charge. Grafana API keys, which are used to control workspace resources like dashboards, alerts, and data sources, are invoiced per API user license and can be granted Administrator, Editor, or Viewer capabilities. Amazon Managed Grafana data queries to other AWS Services and third-party ISVs that may charge fees for utilizing their APIs are the third category. These API fees are levied by the relevant AWS service or third-party ISV, not by Amazon Managed Grafana.
Q: How can I go from Amazon Managed Grafana to Grafana Enterprise?
A: You may upgrade to Grafana Enterprise straight from the AWS Console, which gives you access to Enterprise plugins that connect to a wide range of third-party ISVs as well as support and training from Grafana Labs. By upgrading to Grafana Enterprise, you may keep using your existing Amazon Managed Grafana workspaces while receiving extra functionality in the upgraded workspace, all of which are entirely managed by Amazon Managed Grafana.
Q: What are Amazon Managed Grafana teams, and why should I utilize them?
A: Teams in Amazon Managed Grafana provide a grouping technique for organizing users. Individual users can be grouped into entities that have access to common resources such as dashboards, data sources, and alerts by using teams. Teams can also be assigned to LDAP groups.
Q: How much does Amazon Managed Grafana cost?
A: The entire number of active users that have signed in to each Grafana workspace is invoiced monthly, with a minimum of one Editor user license per workspace per month. There are two types of users: Editors who can be assigned Administrator or Editor responsibilities, and Viewers who can only be assigned a Viewer role.
Q: What exactly is an active user?
A: An "Active user" is someone who has signed in to an Amazon Managed Grafana workspace or performed an API call at least once during the monthly payment cycle. Users who have been granted access to Grafana workspaces but have not utilized the service at least once during the monthly payment cycle will not be billed. If no users log into a workspace for a month, you will be charged for a minimum of one Editor user license per workspace every month.
Q: Can I set up more than one workspace?
A: Yes, several workplaces are possible. Users are charged monthly based on the number of workspaces they use. For example, if User A is a member of both Workspace 1 and Workspace 2, he or she will be charged for using Workspace 1 and separately for using Workspace 2.
Q: How will I be invoiced if I have both Amazon Managed Grafana and Grafana Enterprise?
A: You will get a single charge for your Amazon Managed Grafana use, based on active Editor and active Viewer users per workspace every month. If you upgrade your Amazon Managed Grafana workspace(s) to Grafana Enterprise, you will notice Grafana Enterprise costs on your AWS Marketplace subscription. Grafana Enterprise's cost is in addition to Amazon Managed Grafana's per Editor and per Viewer pricing.
Q: Can I use Terraform to create, amend, and delete the dashboard for AWS Grafana Workspace?
A: Yes, AWS Grafana works with Terraform to administer dashboards.
Conclusion
- AWS Grafana is a managed service and highly secure visualization service that enables users to rapidly query, correlate, and display operational data, log, and trace from numerous sources.
- AWS Grafana makes it simple to install, administer, and grow Grafana, a widely used visualizing tool known for its flexible supporting data.
- You may use Amazon Managed Grafana to establish logically separated Grafana servers known as workspaces.
- Every month, you will be charged a single fee for your Amazon Managed Grafana usage based on the number of active Editor and Viewer users in your workspace.
- Grafana allows users to easily share dashboards among groups of people and provide them with access to data sources.
- Amazon Grafana safely and easily integrates with AWS services such as AWS Prometheus, enabling users to explore AWS data across many accounts and regions via a single user interface.
- Terraform plugins are available for practically all AWS services, enabling controlled changes to cloud architecture.
- With multi-AZ replication, Amazon Managed Grafana workspaces are extremely available. Amazon Managed Grafana also continually monitors the health of your Grafana workspaces and replaces unhealthy nodes without interfering with your Grafana workspace access.
- Grafana dashboards are big JSON documents that might be challenging to manage. Building such a dashboard is very challenging since you must account for multiple template attributes, functions, time period options, and so on.