AWS Prometheus
Overview
Prometheus is an open-source monitoring and alerting technology that is popular among DevOps engineers. AWS Prometheus is a Prometheus-compatible service that scales monitoring and alerting on containerized apps and infrastructure. The service is integrated with AWS EKS, ECS, and Distro for OpenTelemetry.
Transform Your Career
Choose from our industry-leading programs designed for career success
Modern Software and AI Engineering Program
Master full-stack development with AI integration

Modern Data Science and ML with specialisation in AI
Advanced data science techniques with AI specialization
Advanced AIML with Specialisation in Agentic AI
Deep dive into AIML with focus on Agentic systems
DevOps, Cloud & AI Platform Engineering
Build and manage AI-powered cloud infrastructure
AI Engineering Advanced Certification by IIT-Roorkee
Premier AI engineering certification from IIT-Roorkee
What is AWS Prometheus?

Prometheus enables real-time alerts and monitoring. It provides a flexible query language for aggregating metrics across a high volume of labels. Those are value pairs such as regions equal US East-1, environment equal production, and equal e-commerce. Some unique features of Prometheus include its instrumentation libraries, supported in languages such as GO, Java, and C#, and its ability to pull metrics at scale from over 150 plus exporters including JMX, Redis, and Nginx all maintained by the open source community.
Amazon Prometheus is a managed monitor and alert service that delivers information and real-time insights for large-scale container deployments. You may gather and retrieve operation and performance information from container applications on AWS as well as on using Amazon Prometheus.
Amazon Prometheus managed service, automates Prometheus installation and configuration, and automates most of the regular maintenance and operations allowing you to save time maintaining your monitoring system and even more for creating the apps.
Amazon Prometheus scales with the container's workload to give price-effective performance measurements and reliable query reaction times. To gather and analyze data using AWS container services like AWS EKS, AWS ECS, and AWS Fargate, users may utilize Amazon Prometheus.
- Filtering, aggregating, ingestion, and querying thousands of pivotal moment series metrics across the self-managed Kubernetes cluster user can utilize the Prometheus query language.
- Scale dynamically as the ingest and query requirements expands, while maintaining constant reaction speeds with massive container installations.
- Integration with AWS security services to satisfy the organization's compliance and safety needs.
- Lower the operating expenses of solitary Prometheus server configuration, upgrade, and scalability.
How AWS Prometheus Works?
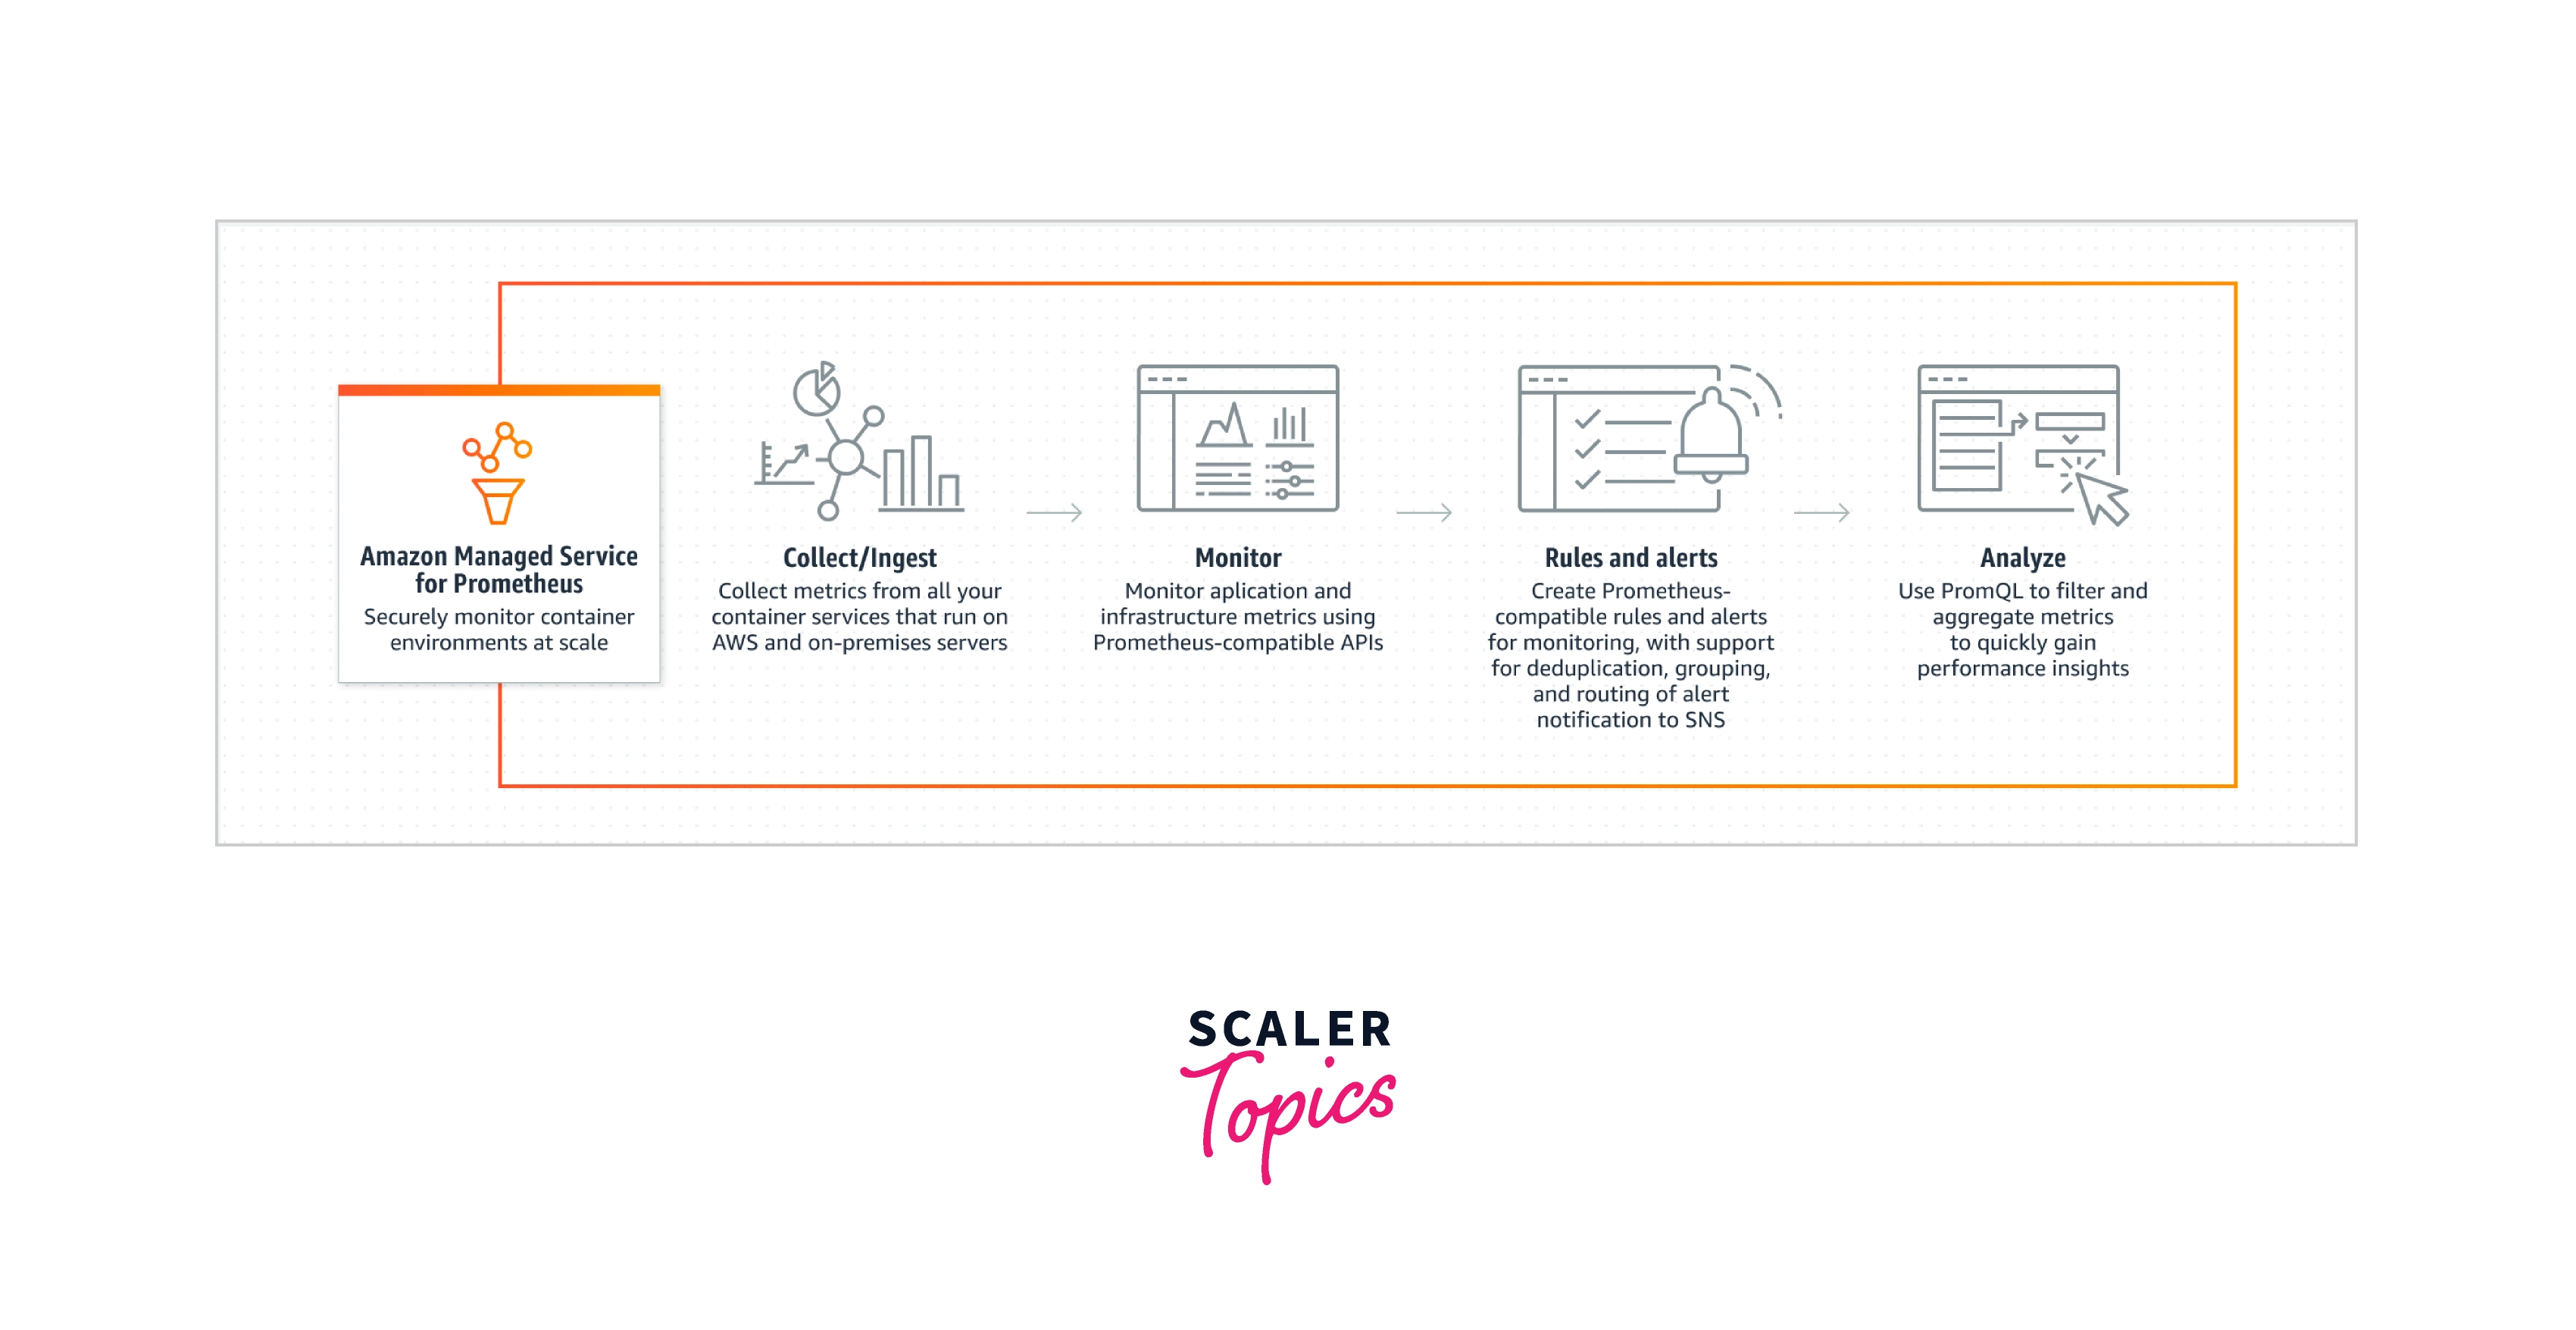
Amazon Managed Service for Prometheus supports container clusters running on Amazon Elastic Kubernetes Service as well as self-managed Kubernetes deployments.
The same open-source Prometheus data schema and PromQL query language that you use with Prometheus are used with Amazon Managed Service for Prometheus. Engineering teams may utilize PromQL to filter, aggregate, and alert on metrics to acquire performance information rapidly and without modifying code. Amazon Managed Service for Prometheus enables customizable query capabilities while reducing operating costs and complexity.
Metrics entered into a workspace are kept for 150 days before being automatically erased.


Use Cases of AWS Prometheus
- Integrated Application Monitoring
Monitor AWS container and heterogeneous systems, and interact with AWS Grafana to monitor alarms, and dashboard insights.
- Diagnosis and Root Cause Assessment
With notifications, you can watch container efficiency and system health, detect issues, and minimize the median time to resolve them.
- Monitor the Workload and Metric of the Application
Utilizing AWS Distro on OpenTelemetry, gather measurements from any location and transmit them to Amazon Prometheus by open-source exporters.
- Monitor the Higher Cardinalities Metric
Monitor and notify on high-cardinality information, such as streaming video, networking technologies, and Internet of things time series information.
Scaler Placement Report and Statistics
Scaler learners achieved 2.5x salary growth with average post-Scaler CTC reaching ₹23L.
AWS Prometheus Ecosystem and Architecture
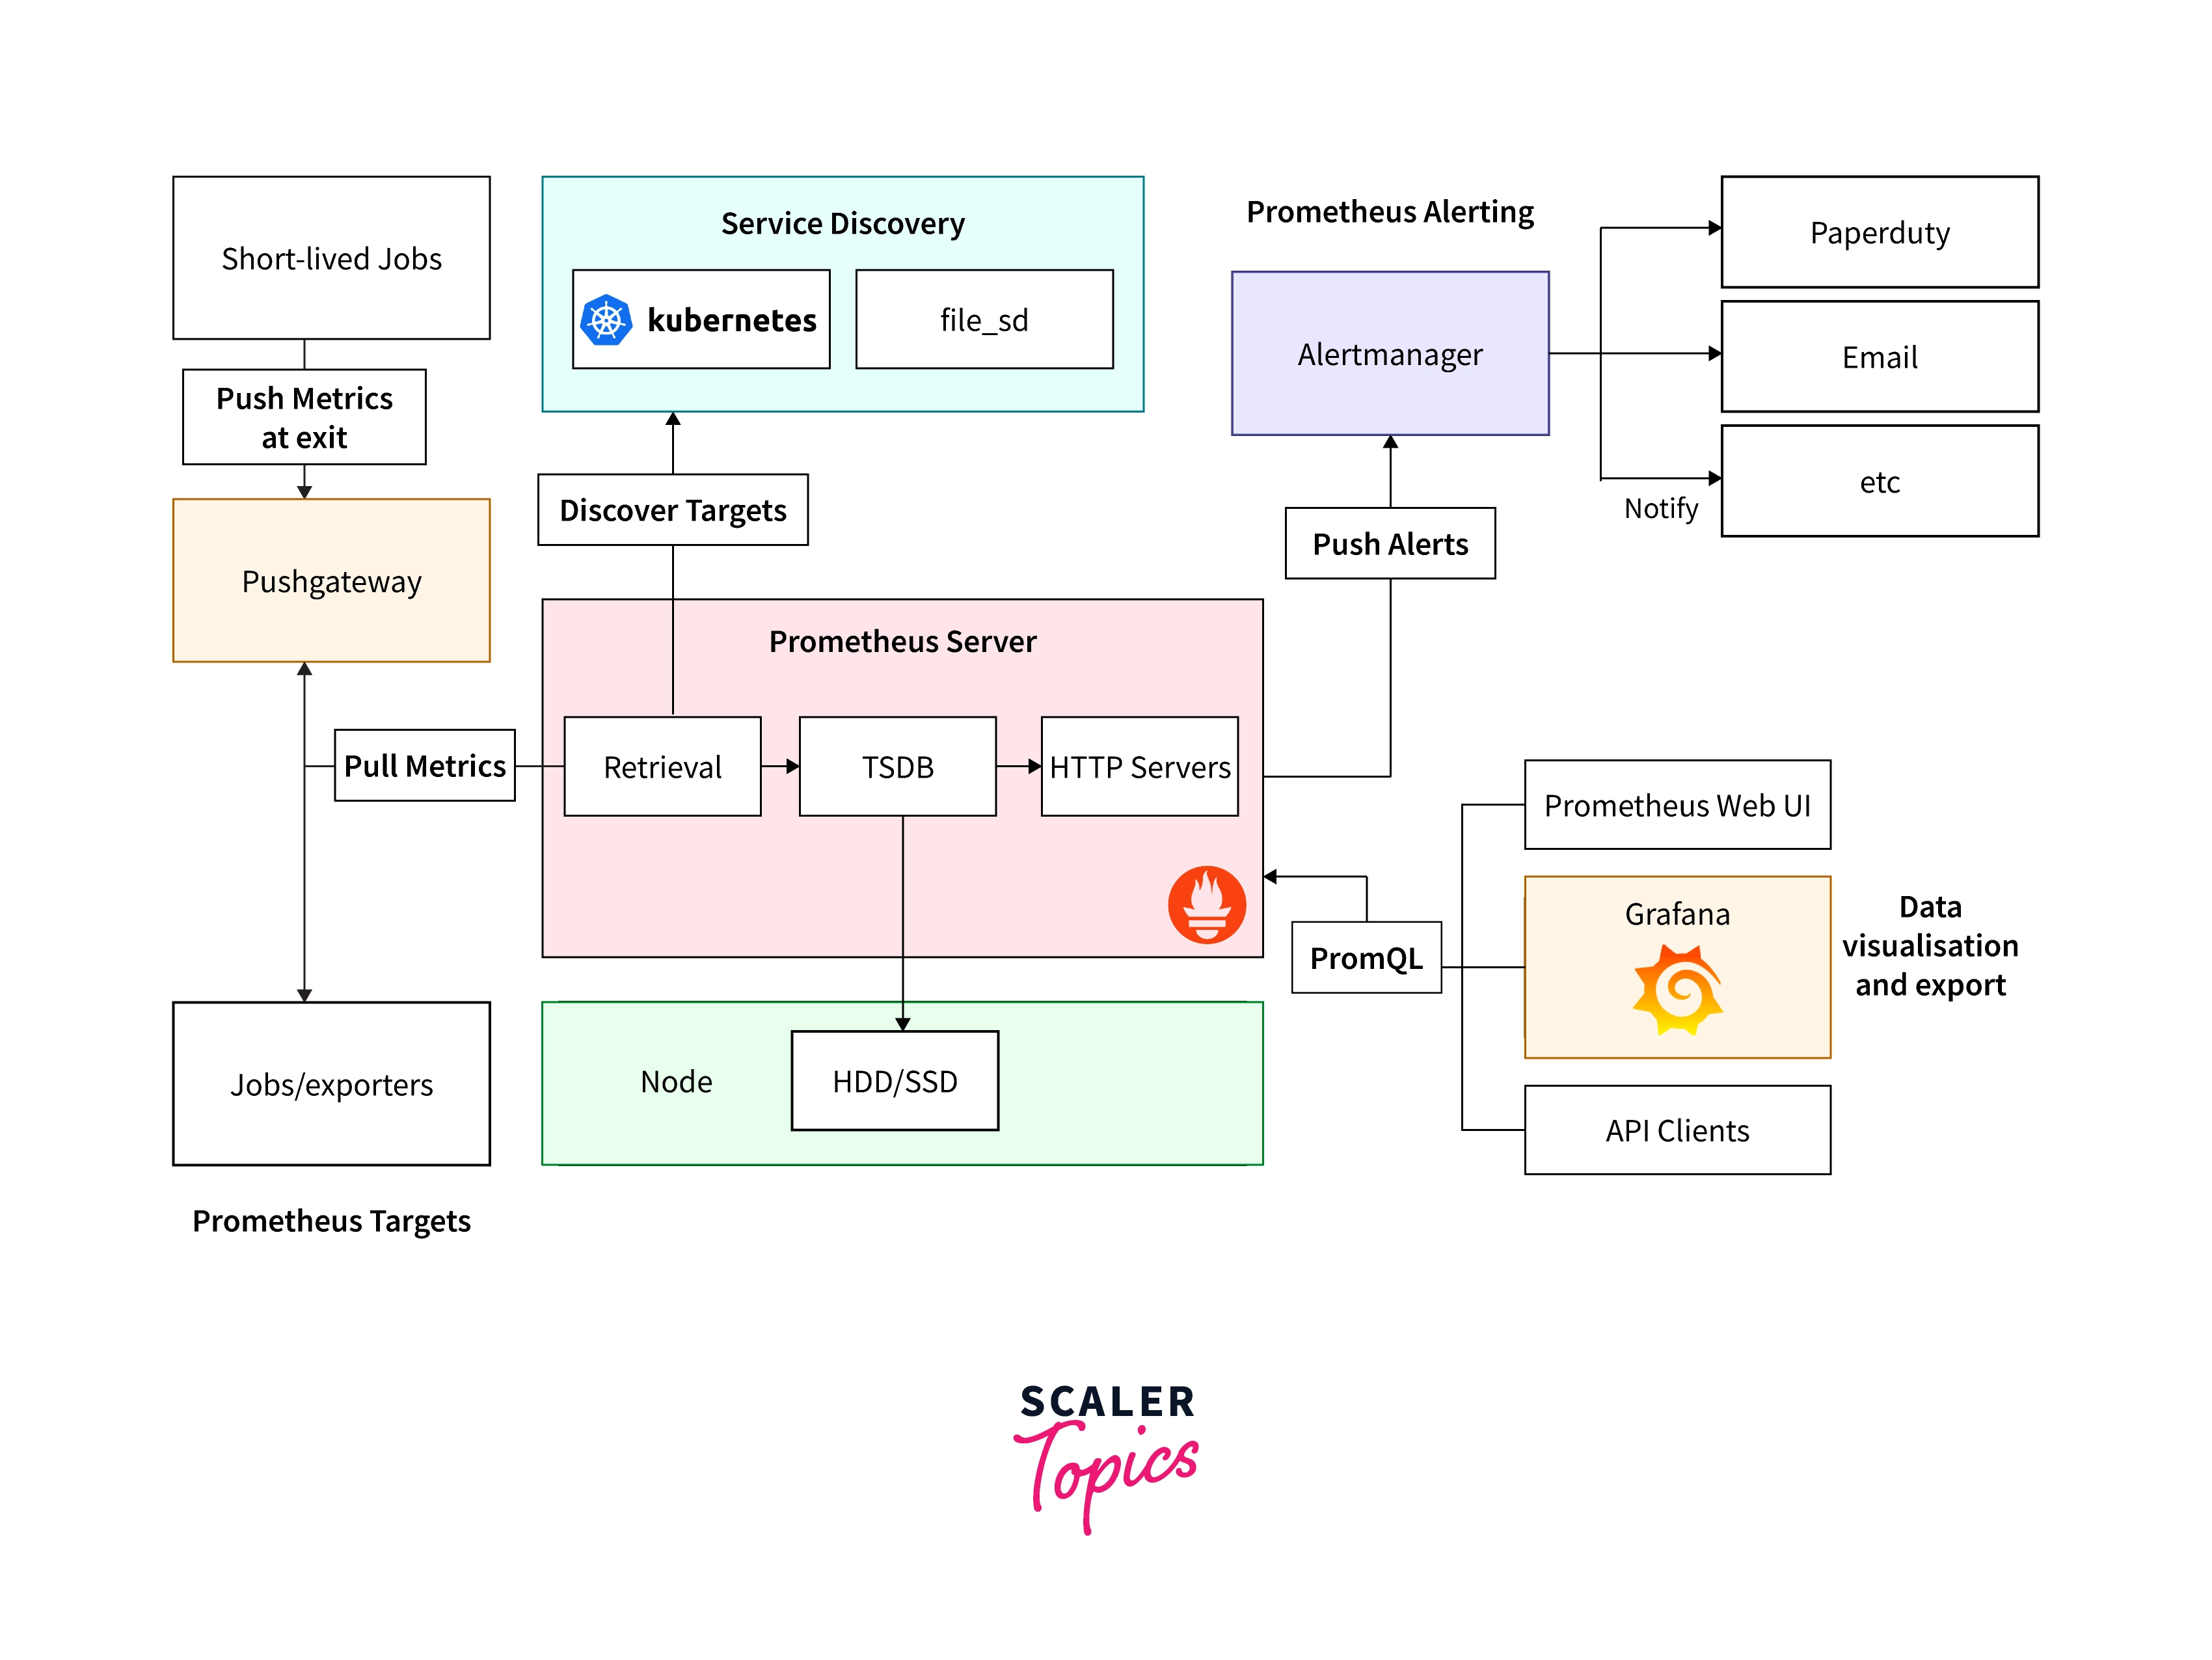
Prometheus is an open-source monitoring system comprised of the following elements:
- Prometheus Server : collects and stores time series data from programs like web applications for local study. The push gateways, which are typically HTTP endpoints, are used by the Prometheus server to extract metrics data from a variety of applications and systems. The data is kept local as time-serialized data metrics after being collected on the Prometheus server so that it may later be used for evaluation and additional monitoring using the alert management.
- Prometheus Client Libraries : The monitoring of application code is possible thanks to Prometheus client libraries. To link their applications to Prometheus and provide statistics, programmers may utilize such libraries, which are available in several languages like Go, C#, Ruby, Java, Python, and many others.
- Send Gateway : Acts as a channel for batch jobs and ephemeral jobs to transmit information during their brief processes.
- Exporters : Libraries that enable the exporting of measurements from other platforms as Prometheus observations.
- Alert Manager : Gives the user the ability to manage alerts via push notifications.
Prometheus is intended to be a reliable, independent engine with no reliance on extraneous parts. When one of the major portions of an app or the infrastructure management fails, it can be utilized for various app troubleshooting and diagnosis.
The multi-dimensional data set used by Prometheus frequently maintains data as time series information with time stamp results for every parameter. Every time series has a unique "metric name" identifier and tags, which are optionally key-value pairs.
For real-time analysis of the time series information it saves, Prometheus also comes with PromQL, which stands for Prometheus Query Language. The Prometheus server's HTTP API may be used to import the outcomes of such queries into external applications or show them as tables or maps.
Prometheus allows storing and analysis of temporarily generated time-series information produced by various PromQL inquiries that also have labels in addition to time-series information.
Capabilities of AWS Managed Prometheus
-
AWS Prometheus is a monitor and alert system for Prometheus. Users of AWS able to scale up the monitoring of container orchestration, like those running on Kubernetes.
-
The self-fully managed Prometheus installations on AWS Prometheus help the users by managing the installations of the Prometheus components into the various computation platforms such as AWS EC2 instances and the Kubernetes services.
-
With Amazon Prometheus clients can use the Prometheus monitor services, which also expand naturally as the requirements of the monitoring ecosystem develop, without having to do the laborious work of manual process scaling the Prometheus ecosystem. Users gain from reduced setup costs and a quicker launch time.
-
Additionally interoperability with the compliance and security tools is this Prometheus solution from AWS. AWS Distro for OpenTelemetry or native Prometheus collection drivers may be used to quickly gather Prometheus metrics from AWS EC2, ECS, and EKS setups. Clients have even more choices and freedom with AWS Prometheus because of API capabilities.
-
PromQL language is also available through this AWS Prometheus application for query, filter, aggregation, and alerts on every Prometheus-supported category. Now with self-managed alternatives still available, Prometheus clients can similarly utilize AWS Prometheus. Due to the connection with AWS IAM and the federation policy control provided by the AWS Organisations interface, clients can additionally profit from using AWS native identification for access and security.
-
To ensure an adequate supply, it inherently split over many AWS AZs and regions. The minimal latency, and increased throughput backbone connection provided by AWS, which offers the best performance of the network to various AWS customers, is likewise advantageous to Amazon Prometheus.
-
Customers of the Prometheus system for visual analytics of the data stored as well as clients of the Amazon Prometheus have accessibility to the identical Grafana interface. There is no requirement to deploy their Grafana servers because the Grafana Prometheus multiple data connectors can be quickly provisioned to lookup data from the Amazon Prometheus provider.
-
Amazon Managed Service for Prometheus scales up and down with your container workloads to give cost-effective performance measurements and consistent query response times. To gather and query metrics from AWS container services such as Amazon's Elastic Kubernetes Service (EKS), Amazon's Elastic Container Service (ECS), and AWS Fargate, you may utilize Amazon Managed Service for Prometheus.
Turn Learning into Career Growth
Pricing and Availability of AWS Prometheus
There are no obligations or up-front costs while using Amazon Prometheus. Based on metrics that are ingested, queried, and saved, clients, pay for what they utilize. There at end of each month, customers will be billed for their consumption. The price chart below will be used to determine what customers will pay.
Pricing
| Samples of metrics consumed | Cost ($/10M samples) |
| For the first 2 billion | $0.90 |
| For the Next 250 billion | $0.35 |
| After over 252 billion | $0.16 |
| Cost | |
| Metrics kept | $0.03/GB-Mo |
| QSP | $0.10/B |
-
Each metric sample that is fed to the protected Prometheus-compatible endpoint is counted by the Amazon Managed Service for Prometheus. Additionally, the saved metric samples and metric metadata are measured in gigabytes (GB), where 1GB equals 230 bytes.
-
The Prometheus metrics samples (usually 1 or 2 bytes) and metadata are what determine the storage fee. The size of the Prometheus metric information varies according to the metric's name and the labels (key/value pairs) that go along with it.
-
Only when measurements are sent to Amazon Managed Service for Prometheus are fees for metrics ingested and stored, calculated using gigabyte-month, billed prorated by the hour (GB-Mo).
AWS Free Tier Anyone may start using Amazon Prometheus for free as a part of the AWS Free Tier. Clients on the Free Tier receive:
| Samples of metrics consumed | 40 M |
| processed samples of queries | 200 B |
| metrics kept | 10 GB |
During writing this article, only a few AWS Regions offered Amazon Prometheus. The whole listing of AWS Regions offerings is available here, as it is listed below.
Amazon Managed Service for Prometheus currently supports the following Regions:
- US East (Ohio)
- US East (N. Virginia)
- US West (Oregon)
- Asia Pacific (Singapore)
- Asia Pacific (Sydney)
- Asia Pacific (Tokyo)
- Europe (Frankfurt)
- Europe (Ireland)
- Europe (London)
- Europe (Stockholm)
FAQs
- Q: What is Amazon Managed Service for Prometheus?
A: You may more easily and safely monitor and get alerts in container environments with the help of Amazon Prometheus, a serverless monitor solution for analytics that is interoperable with open-source Prometheus. Built on the well-known open-source Prometheus initiative from the CNCF, the Amazon Prometheus is a solution to monitor the containers.
- Q: Why should I use Amazon Managed Service for Prometheus?
A: Whether clients have chosen an open-source monitoring approach, already have implemented or intend to deploy Prometheus for container monitoring, and want a managed service environment wherein AWS offers security improvements, flexibility, and reliability, users choose Amazon Prometheus. The monitored data produced by container-based apps have a high number of clusters, and Amazon Prometheus is particularly designed to handle this.
- Q: What is a Prometheus metric label?
A: Every time series in the Prometheus data structure has a title and an infinite amount of labels, which are key-value combinations. The features of what is being monitored may be distinguished using labels like "region=us-west-,2" "environment=development", and "app=shopi." Labels are comparable to AWS tags assigned to assets or Dimensions given to metrics from AWS CloudWatch.
- Q: What is the relationship between Amazon Managed Service for Prometheus and Amazon CloudWatch? Which should I choose?
A: Amazon CloudWatch is an AWS service that enables end-to-end observability for applications operating on EC2, AWS container services (EKS, ECS), Lambda, and other AWS services through logs, metrics, and traces. Amazon CloudWatch can detect and collect Prometheus metrics as CloudWatch metrics in order to give our clients alternatives for querying and alerting on Prometheus metrics. Amazon CloudWatch includes a comprehensive set of agents and libraries, custom and automatic dashboards, alarms, synthetic monitoring, and a service map view that allows logs, metrics, and traces to be cross-correlated. If you need a comprehensive observability service that includes logs, metrics, tracing, dashboarding, and alerting, Amazon CloudWatch is the way to go.
- Q: How does this service relate to/work with other AWS services?
A: Amazon Prometheus offers fully maintained AWS services that are connected with the other Aws resources, despite its dependence on the open-source Prometheus project. The AWS Dashboard, API, and CLI are used to configure and operate Amazon Prometheus. IAM manages permission, AWS Organisations manages policies, and AWS CloudTrail logs Callbacks.
- Q: Can I get a history of Amazon Managed Service for Prometheus API calls made on my account for security analysis and operational troubleshooting purposes?
A: Yes. Activate on CloudTrail inside the AWS Administration Console to get a record of every Amazon Prometheus API to call performed on the accounts. Remote write, search, query range, label, tag, serial, and meta API calls for ingesting and requesting information in Amazon Prometheus isn't saved and sent.
- Q: How does Amazon Managed Service for Prometheus integrate with Amazon Managed Grafana?
A: Both services utilize AWS security mechanisms including activities audit logs and perfectly alright security systems. Prometheus data may be alerted on using Amazon Managed Grafana's alert features. You may build a dashboard and alerting using Grafana from a variety of sources, including Amazon Prometheus, CloudWatch, X-Ray, and Elasticsearch.
- Q: What is the relationship between Amazon Managed Service for Prometheus and other prominent open-source observability and monitoring projects?
A: Amazon Managed Service for Prometheus is based on the popular Cloud Native Computing Foundation (CNCF) Prometheus project and is powered by Cortex, another open-source CNCF project that adds horizontal scalability to Prometheus metrics intake, store, query, and alarm. Amazon Managed Service for Prometheus is dedicated to continued open-source contributions and is working with the community to increase the scalability and dependability of this and other open-source projects. AWS Distro for OpenTelemetry is also used as a collection agent for Prometheus metrics by Amazon Managed Service for Prometheus.
- Q: What guarantees does your Amazon Managed Service for Prometheus Service Level Agreement provide?
A: For Amazon Managed Service for Prometheus within a Region, our SLA ensures a Monthly Uptime Percentage of at least 99.9%.
- Q: How can I find out whether I'm eligible for an SLA Service Credit?
A: If the Region in which you operate has a Monthly Uptime Percentage of less than 99.9% during any monthly billing cycle, you are eligible for an SLA credit for Amazon Managed Service for Prometheus.
Conclusion
- AWS Prometheus is a fully self-managed flexible solution that is compatible with Prometheus and accessible on the Cloud environment as a secure and scalable, high-availability installation that AWS clients may easily use without the requirement for the infrastructure required.
- Clients must be informed that the AWS Prometheus does have operational quirks and maintenance restrictions in specific AWS locations.
- Clients can prevent them by explicitly adjusting the Prometheus ecosystem to suit their particular requirements and implementing native Prometheus applications on AWS EC2 instances, EKS, etc.
- Users that install native Prometheus may also leverage Clouds Volumes ONTAP, the best enterprise-level data-managed solution from NetApp.
- Due to data storage efficiency solutions and optimizations, DevOps teams using Amazon Prometheus may achieve high availability, potential storage cost discounts of approximately 70%, and an improvement in querying rate of up to 66%.