AWS X-Ray
Overview
With recent developments in cloud computing technologies, companies prefer to build modern applications for better performance and operational excellence. When we say modern applications, they are essentially service-oriented architectures. This means that each service in the application is capable of functioning independently of the other services. One of the challenges that come with modern applications is how developers understand the impact of issues and errors and how they troubleshoot them. To solve those challenges for developers, Amazon introduced AWS X-rays in the year 2016. **AWS X-Rays** help developers analyze and debugthetraces of their applications` with some important additional features.
Transform Your Career
Choose from our industry-leading programs designed for career success
Modern Software and AI Engineering Program
Master full-stack development with AI integration

Modern Data Science and ML with specialisation in AI
Advanced data science techniques with AI specialization
Advanced AIML with Specialisation in Agentic AI
Deep dive into AIML with focus on Agentic systems
DevOps, Cloud & AI Platform Engineering
Build and manage AI-powered cloud infrastructure
AI Engineering Advanced Certification by IIT-Roorkee
Premier AI engineering certification from IIT-Roorkee
What is AWS X-Ray and Why do We Need It?
Modern applications deployed on AWS usually use many AWS services such as EC2, S3, lambda, API Gateway, ECS, DynamoDB, etc.
Typically, one request initiated by an application deployed in an EC2 instance will go to the lambda service, then the lambda service invokes another service like S3 and so on. This is how modern applications are architected and built by leveraging multiple AWS services.
AWS X-Ray is used to `trace end-user (or) client requests through our application while meeting security and compliance objectives across AWS Services.
It helps identify bottlenecks and provides suggestions to improve performance for their application by pinpointing where the issue is occurring and what service is causing the issue.
It also helps developers debug serverless applications in real-time by using log group insights where trace ID is used for every request made by AWS serverless services such as Lambda, API Gateway, etc.
AWS X-ray is cloud agnostic, which means it will work on other cloud service providers, on-premises, and developer desktops also.
Why do we need it ?
Before AWS X-Ray, we have lots of logs, such as network logs, application logs, and monitor logs. We need to correlate these logs and do the debugging. The problem is that it will take a long time to find the root cause among those logs.
- By using an X-ray, we can easily identify which part of our application is causing the issue.
- We can see details about the request being made to the application, such as latency, HTTP response status, number of errors, and downstream calls to other services.
- X-ray provides a visual map of the application's architecture, which helps us quickly see where the errors are occurring
- X-rays make it easy to analyze apps running on EC2 or containers by the EC2 container services.
- With preview lambda support, we can see how much lambda takes to execute our code from the time and event source triggered to lambda begins to execute our code, and finally, the function terminates
Benefits of AWS X-Ray
- X-ray is built for modern applications, and it enables us to quickly analyze and debug issues.
- X-rays give an end-to-end view of individual services as well as overall transactions.
- It helps us to identify the customer/user and business impact
- The AWS X-ray is cloud agnostic. So, we can run it on-premise, colocation, desktop, or any other cloud service provider as well.
- There are six languages supported by AWS X-rays. They are Dotnet and Dotnet Core, Nodejs, Ruby, Python, Go, and Java.
- The X-ray also provides analytics capabilities that let us, deep dive, into the data insights.


AWS X-Ray in Serverless
When we talk about serverless services, one of the benefits is that we don’t have to manage anything as we are just focused on our code, our application logic, or our business logic.
- Specific to Lambda, we can use X-Ray to identify lambda retries, lambda timeouts, and lambda cold starts. However, if we use lambda to run our code, we should first instrument X-ray SDKs into our code.
- We can also look at the API gateway and figure out the custom OAuth that the developers have written.
- For API Gateway and Lambda services, we can enable an X-ray by selecting one check box on their service page.
Scaler Placement Report and Statistics
Scaler learners achieved 2.5x salary growth with average post-Scaler CTC reaching ₹23L.
AWS X-Ray in Containers
- X-rays help developers to find issues in specific containers
- AWS X-rays support all of the container services in AWS, such as Elastic Container Services (ECS), Elastic Kubernetes Services (EKS), and AWS Fargate.
- For AWS ECS or Fargate services, we should mention the below JSON code in the task definition for enabling X-rays. we should run the X-rays pod as a daemon set in AWS Elastic Kubernetes Service (EKS).
Example Task definition for X-ray daemon
AWS X-Ray Features
Security
AWS X-Ray is integrated with AWS Identity and Access Management (IAM) so that we can `delegate the permissions of users and resources to access the traces.
Simple setup
AWS X-Ray can be used for applications running on Amazon Elastic Compute Cloud (EC2), Amazon Elastic Container Service (Amazon ECS), AWS Lambda, and AWS Elastic Beanstalk. All we need to do is the instrument the X-Ray SDK into our application and install the X-Ray agent.
Note: The X-Ray agent is pre-installed on Elastic Beanstalk.
Console and programmatic access
AWS X-Ray is accessible with the AWS Management Console, AWS CLI, and AWS SDKs.
We can access the AWS service programmatically, allowing us to simply export trace data or ingest it into our internal tools and custom analytics dashboards.
Service Map
In AWS X-ray, the Service Map view displays the link between the AWS services in our application as well as aggregated data for each AWS service with metrics such as average latency, failure rates, and so on.
We can also develop dependency trees, identify cross-availability or region calls, and many other things.
End-to-end tracing
In the HTTP request, AWS X-Ray will add a trace id as one of the headers, and using that trace iD, AWS X-ray will capture the flow. It also adds metadata for requests made to AWS RDS, AWS SQS, and AWS serverless services as well.
Data annotation and filtering
Using AWS X-Ray, we can add annotations to data emitted from specific services in our applications.
It also provides options to view and filter trace data with parameters such as average latencies, HTTP response status, timestamp, database table used, annotation value, and more.
Server and client-side latency detection
AWS X-Ray allows us to `visually detect the node and edge latency distribution of applications directly from the service map. To understand performance issues impacting our application and end users. We can also quickly isolate outliers, graph patterns, and trends, and drill into traces. Then, we create a filter using built-in keys and custom annotations.
Turn Learning into Career Growth
How does AWS X-Ray Work?
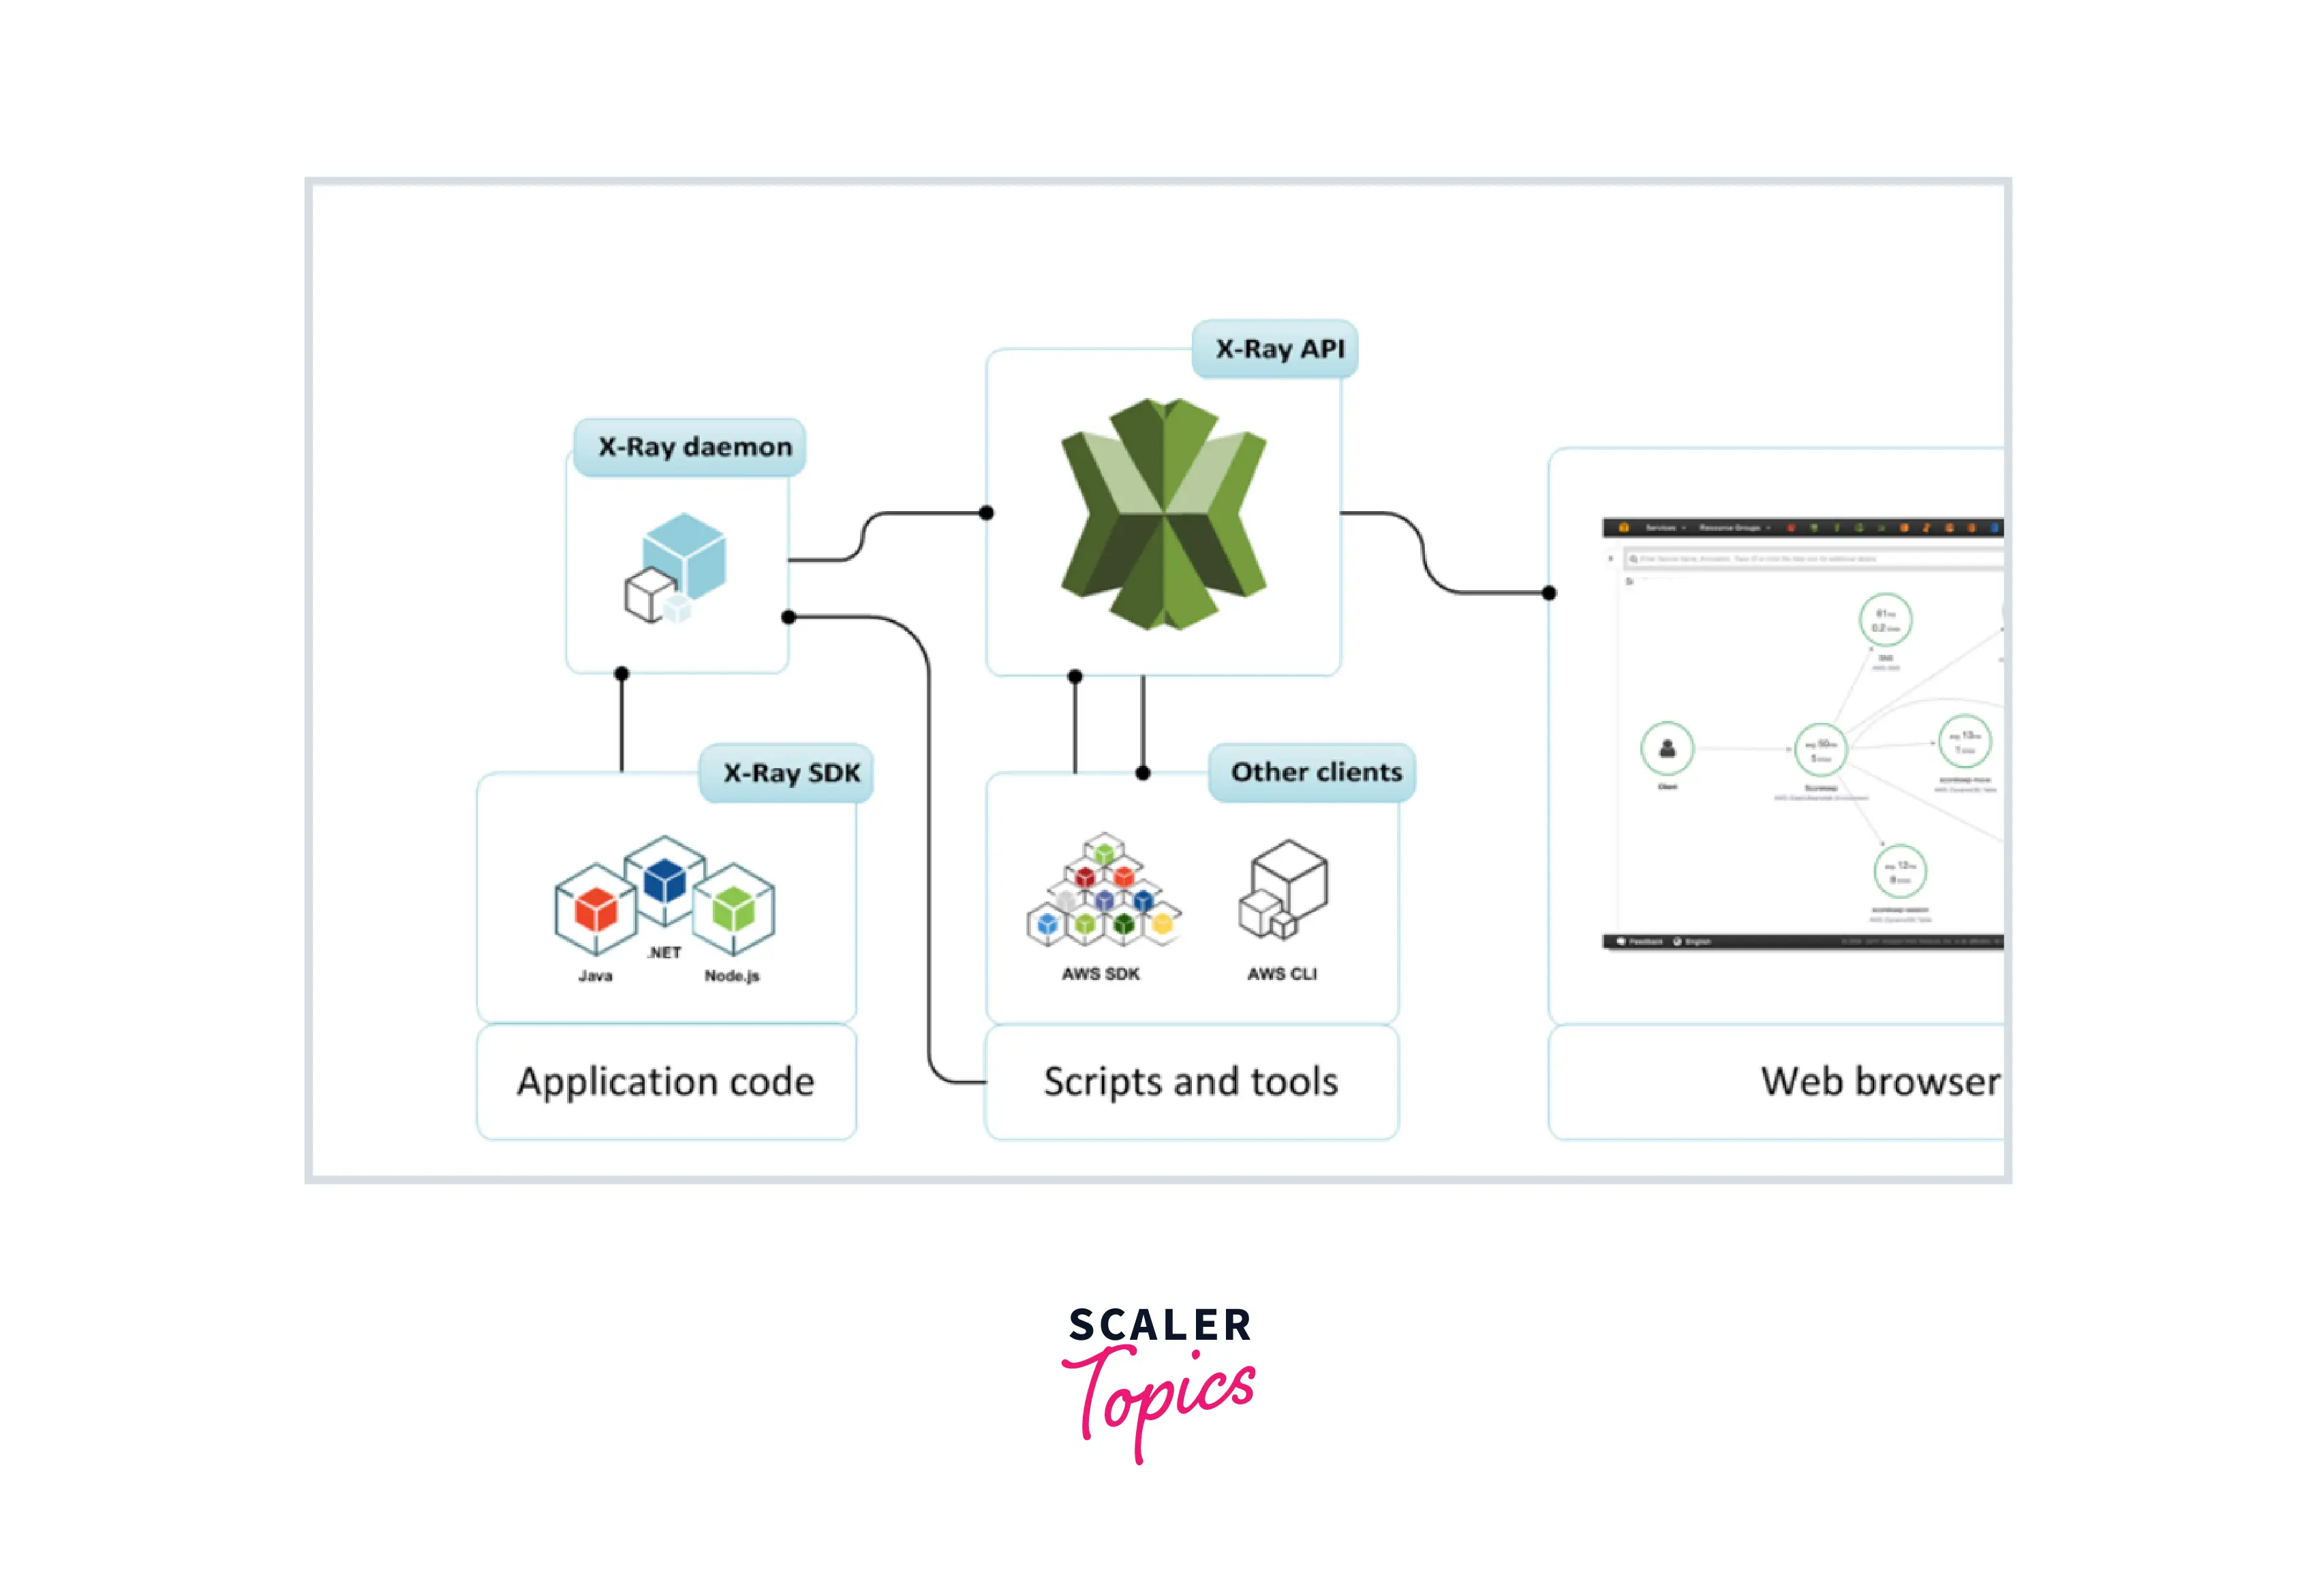
The way X-rays work essentially is that we integrate an X-Ray SDK into our application for different languages, and X-rays use language-specific semantics.
First Part: Application Instrumentation
The AWS X-Ray SDK should be used by developers to integrate the X-ray code snippets into their application code.
For example,
- If we have a Java application, we pull some dependencies from our build file or Maven, and essentially we auto-instrument from that point forward
- If we are using Node.js, we import a package and we essentially write a few lines of code that initialize AWS X-Ray in the middleware. i.e., our request payload is sent to AWS X-Ray, then AWS X-Ray will add a trace ID to the request payload and send it to the destination endpoint.
Once application instrumentation is finished, the application will send a request to the services, and then the AWS X-ray will put a trace ID on the request.
Second part: Collecting traces
For instance, a daemon or agent collects the data from our SDK or SDK emitting from our application and ships the data over to the X-ray back-end.
Third part: Recording traces
The X-ray backend then records these traces using trace-ID. The traces include different segments as they come from different services. We can consider them as disparate log items. X-rays use trace ID to stitch all of this together. X-rays collect all this data, such as disparate log segments, and then put them together in a singular form or single unit called a trace.
Fourth Part: View Service Map
Once a trace is recorded, we can create an aggregate view of the trace, which will be done by the AWS service map. Finally, X-ray provides analytics capabilities that allow us to delve deeply into the data generated by the Service Map.
AWS X-Ray Pricing
There are no up-front costs or commitments with AWS X-Ray. Based on the quantity of traces that are recorded, retrieved, and scanned, we only pay for what we use.
Free Tier
-
The first 100,000 traces recorded each month are free.
-
The first 1,000,000 traces retrieved or scanned each month are free.
| Mumbai Region | cost per million trace | cost per trace |
|---|---|---|
| Traces recorded | $5.00 | $0.000005 per trace |
| Traces retrieved | $0.50 | $0.000005 per trace |
| Traces scanned | $0.50 | $0.000005 per trace |
X-Ray Insights
0.000001 per trace).
To check pricing for all the other regions, Kindly refer below link
Conclusion
- AWS X-rays help developers reduce the average time to diagnose an issue from a `couple of hours to minutes.
- It will identify the bottlenecks and root causes of issues in real time.
- X-ray instrument annotations to represent different business components in an application.
- It also helps reduce costs by providing the best architectural design suggestions.