Amazon QuickSight
Overview
Amazon QuickSight is a Business Intelligence tool provided by Amazon Web Services. It converts the tons of data generated daily to a structured format. This structured data is utilized for business insights anywhere and anytime. It's easy to use and aided with several user management tools such as a dashboard, email reports, and data visualization for analytics.
What is Amazon QuickSight?
Amazon QuickSight is a Business Intelligence tool by AWS. Before understanding Amazon Quicksight, let's first decode the term business intelligence.
Suppose you visit a library and you want to read a particular book. It took almost 2 hours to find a single book as the books were not organized in the library. But the next time you visit the library, you will find that the library contains books divided into various sections and categories. All horror books are in one place, the comedy ones in another area. Also, the books have a label. This time you can find the book within 5-10 minutes.
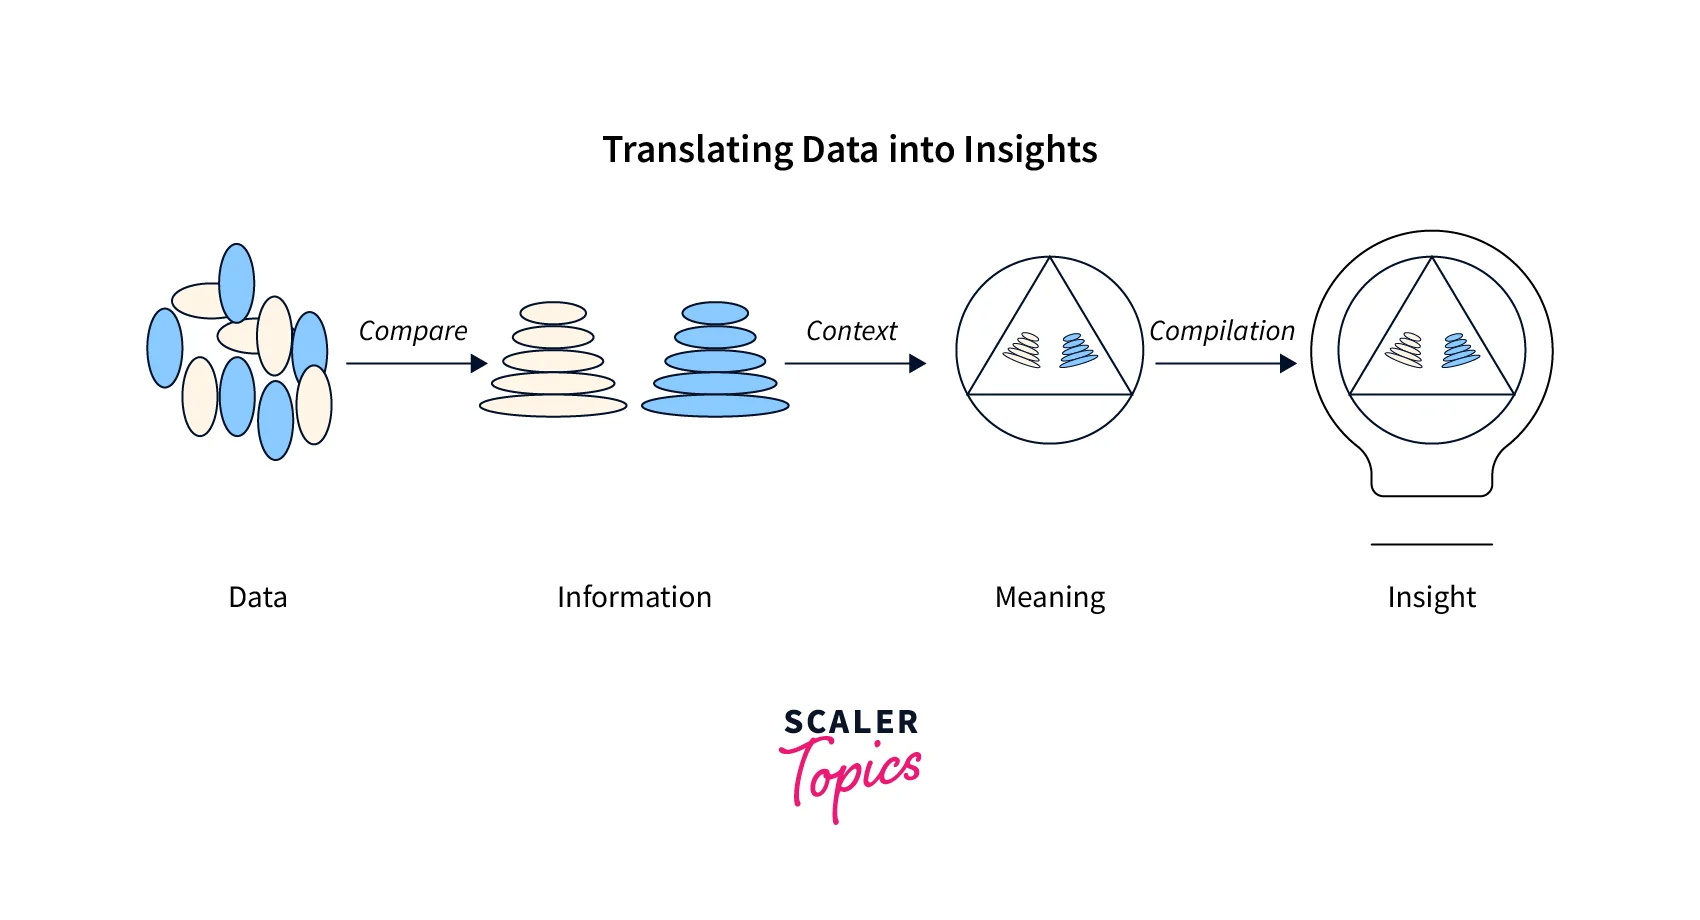
Similarly, a business intelligence tool takes in a lot of data and structures them in a meaningful and actionable way.
Amazon Quicksight collects data from various sources and runs queries against these data to generate reports. It allows us to create different dashboards and visualize the analysis reports. When the data is presented in a way a business wants, it gets easier for business individuals to make decisions.
Why Amazon Quicksight
There are many other popular tools available in the market for business intelligence. Then why should we opt for Amazon Qucksight?
The answer to this, in simple words, is Amazon Quicksight provides the best features and is pocket-friendly.
- Amazon Quicksight can easily connect with other AWS services to provide the best outcome.
- AWS Quicksight is an affordable option without compromising on features.
- Amazon Quicksight is easy to set up, and you can get started with it with just a few clicks.
- Amazon QuickSight is serverless. It can scale to serve many users without needing to update the infrastructure.
How Does it Work?
Before understanding how AWS Quicksight works, let's understand a few terminologies first.
Terminologies
These terminologies would help us understand the working of Amazon Quicksight in a better way.
1. Data Preparation:
Data preparation is the process of preparing raw unstructured data for further use. It includes the following activities:
- Sorting out relevant data
- Renaming fields to make them readable
- Specifying data types for each field to ensure uniformity.
- Using SQL queries to filter data.
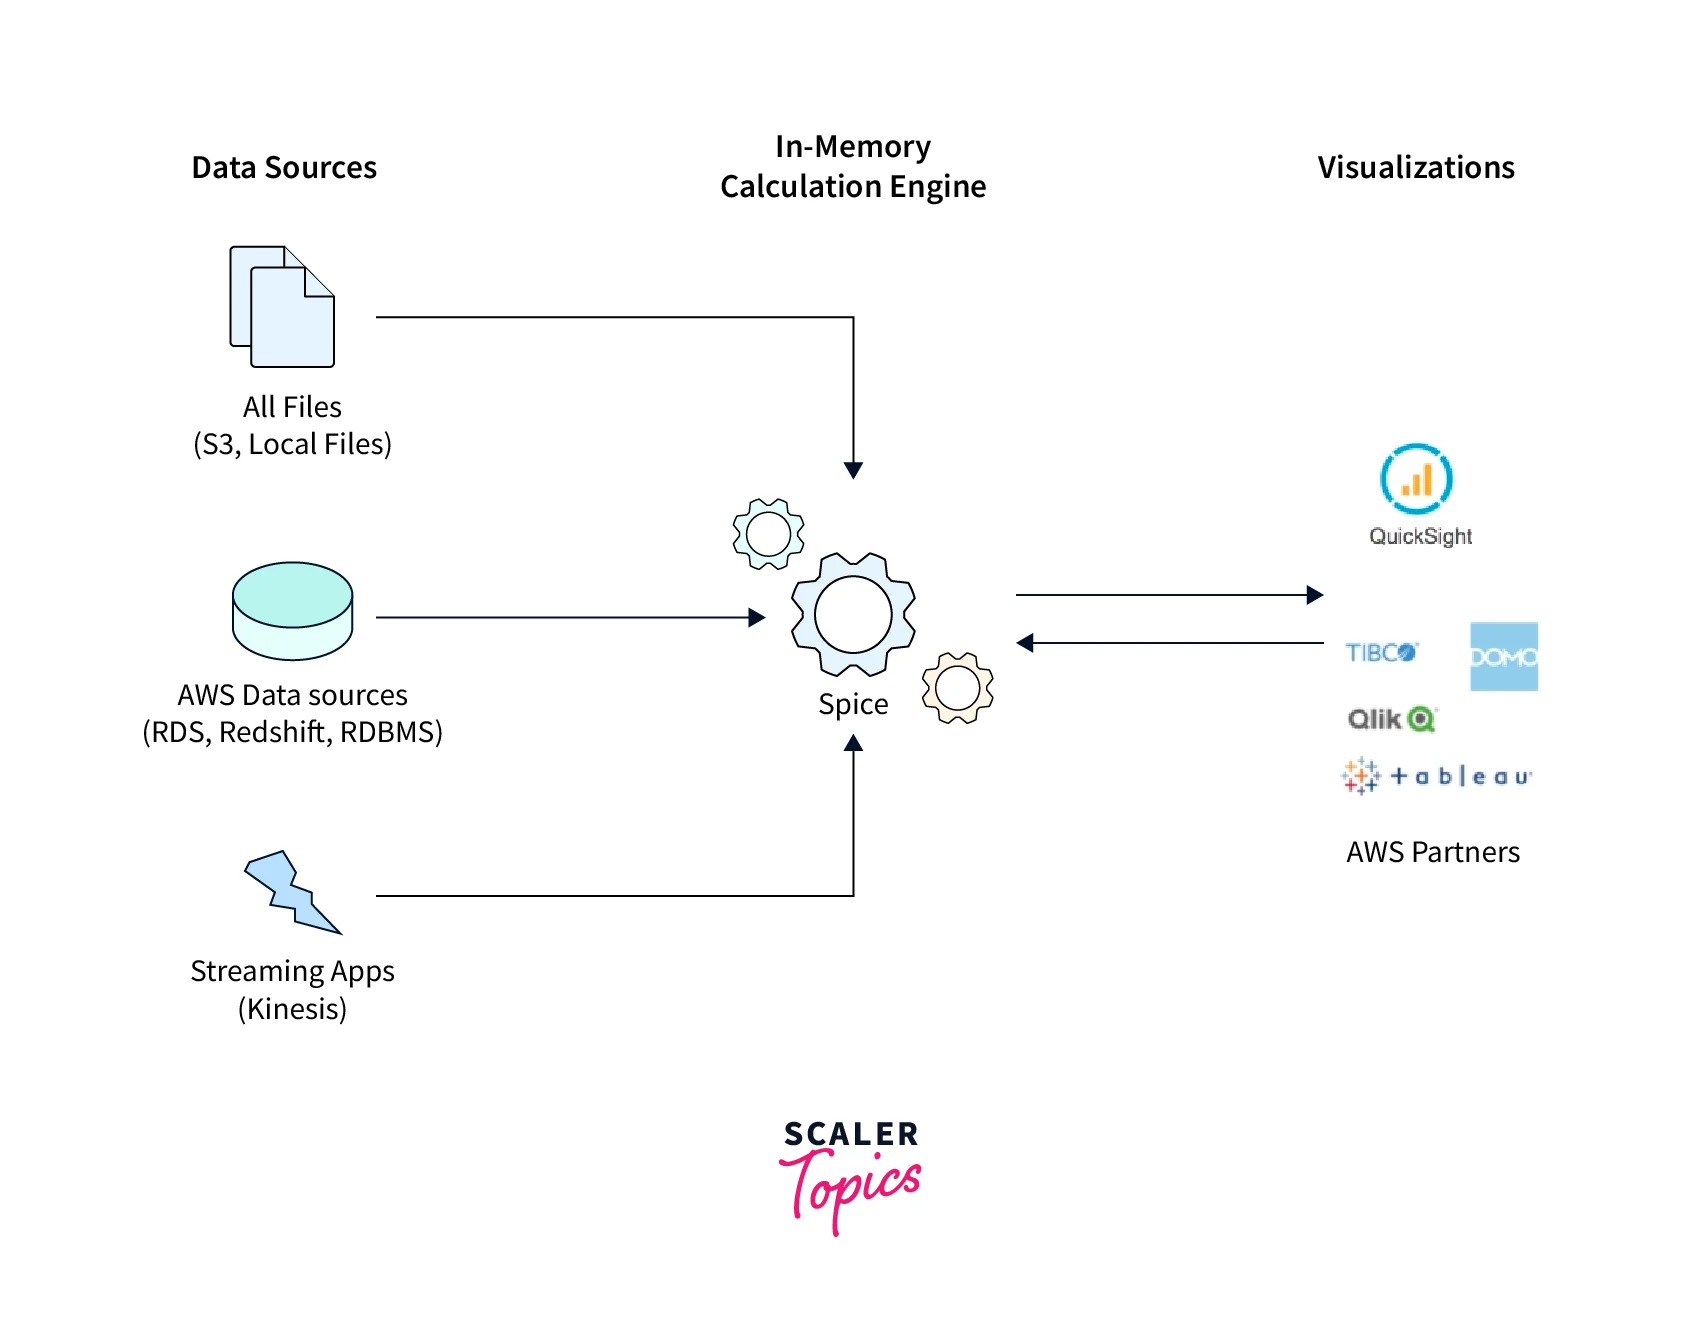
2. SPICE:
SPICE stands for Super-fast, Parallel, In-memory Calculation Engine. Amazon Quicksight uses this engine to perform speedy calculations on huge data. The storage and processing capacity of SPICE is extremely high, which speeds up the queries.
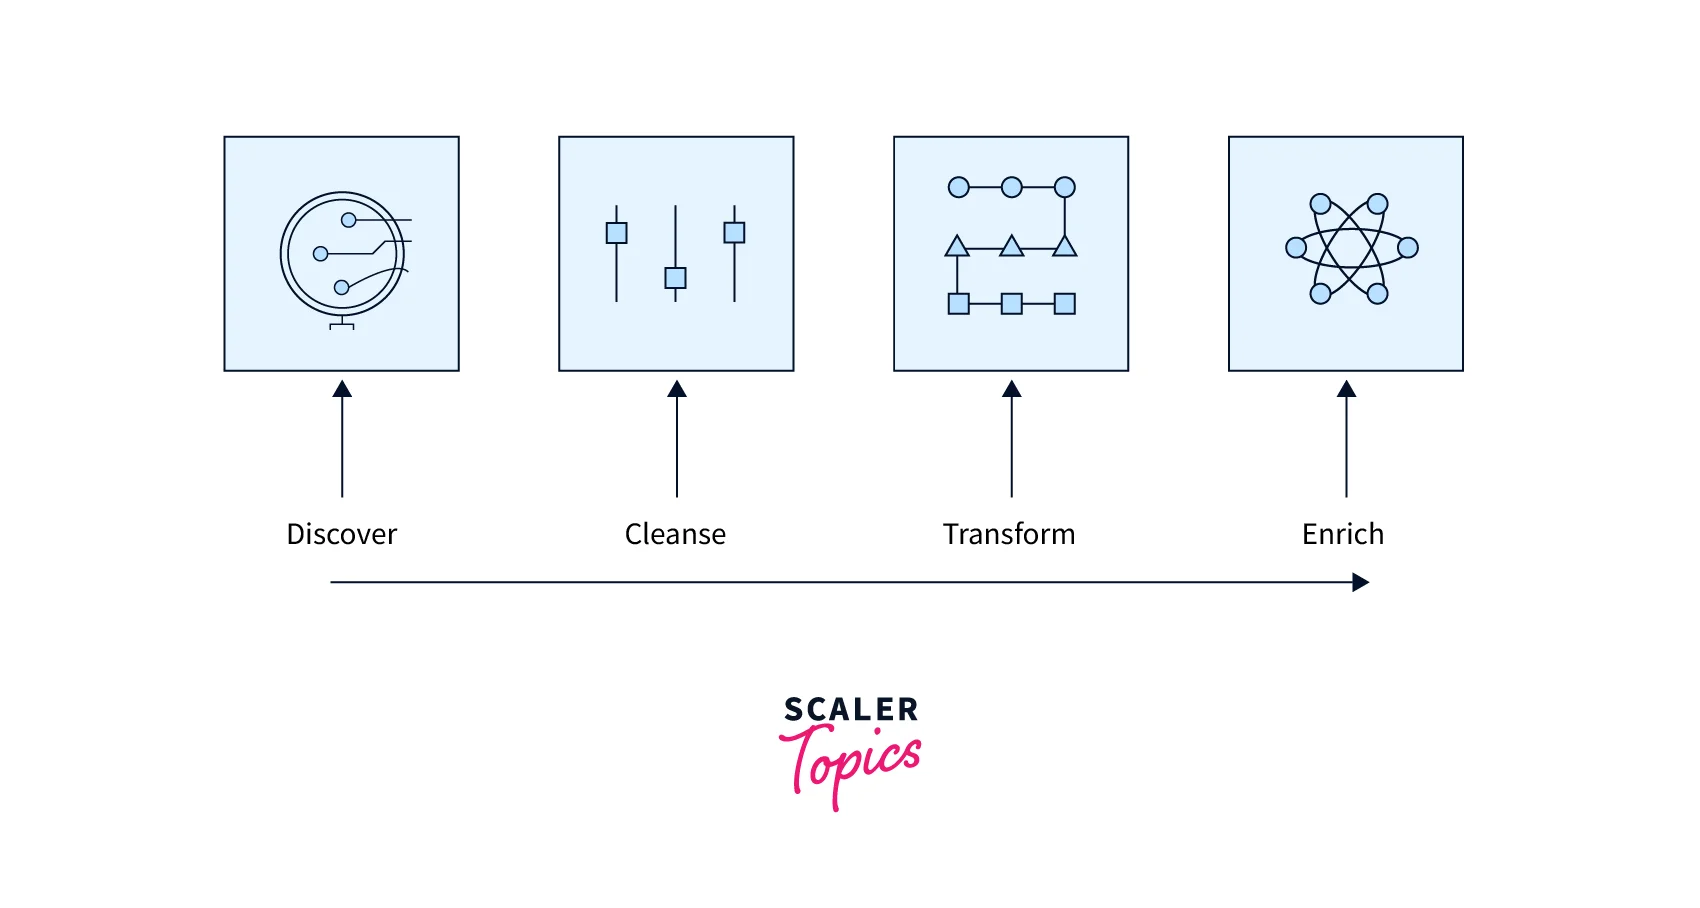
3. Data Analysis:
Under the data analysis process following things are taken care of to discover useful pieces of information and form conclusions:
- inspecting the data of its relevance
- cleaning the irrelevant data
- transforming the data into a suitable format
- modelling the data

4. Data Visualization:
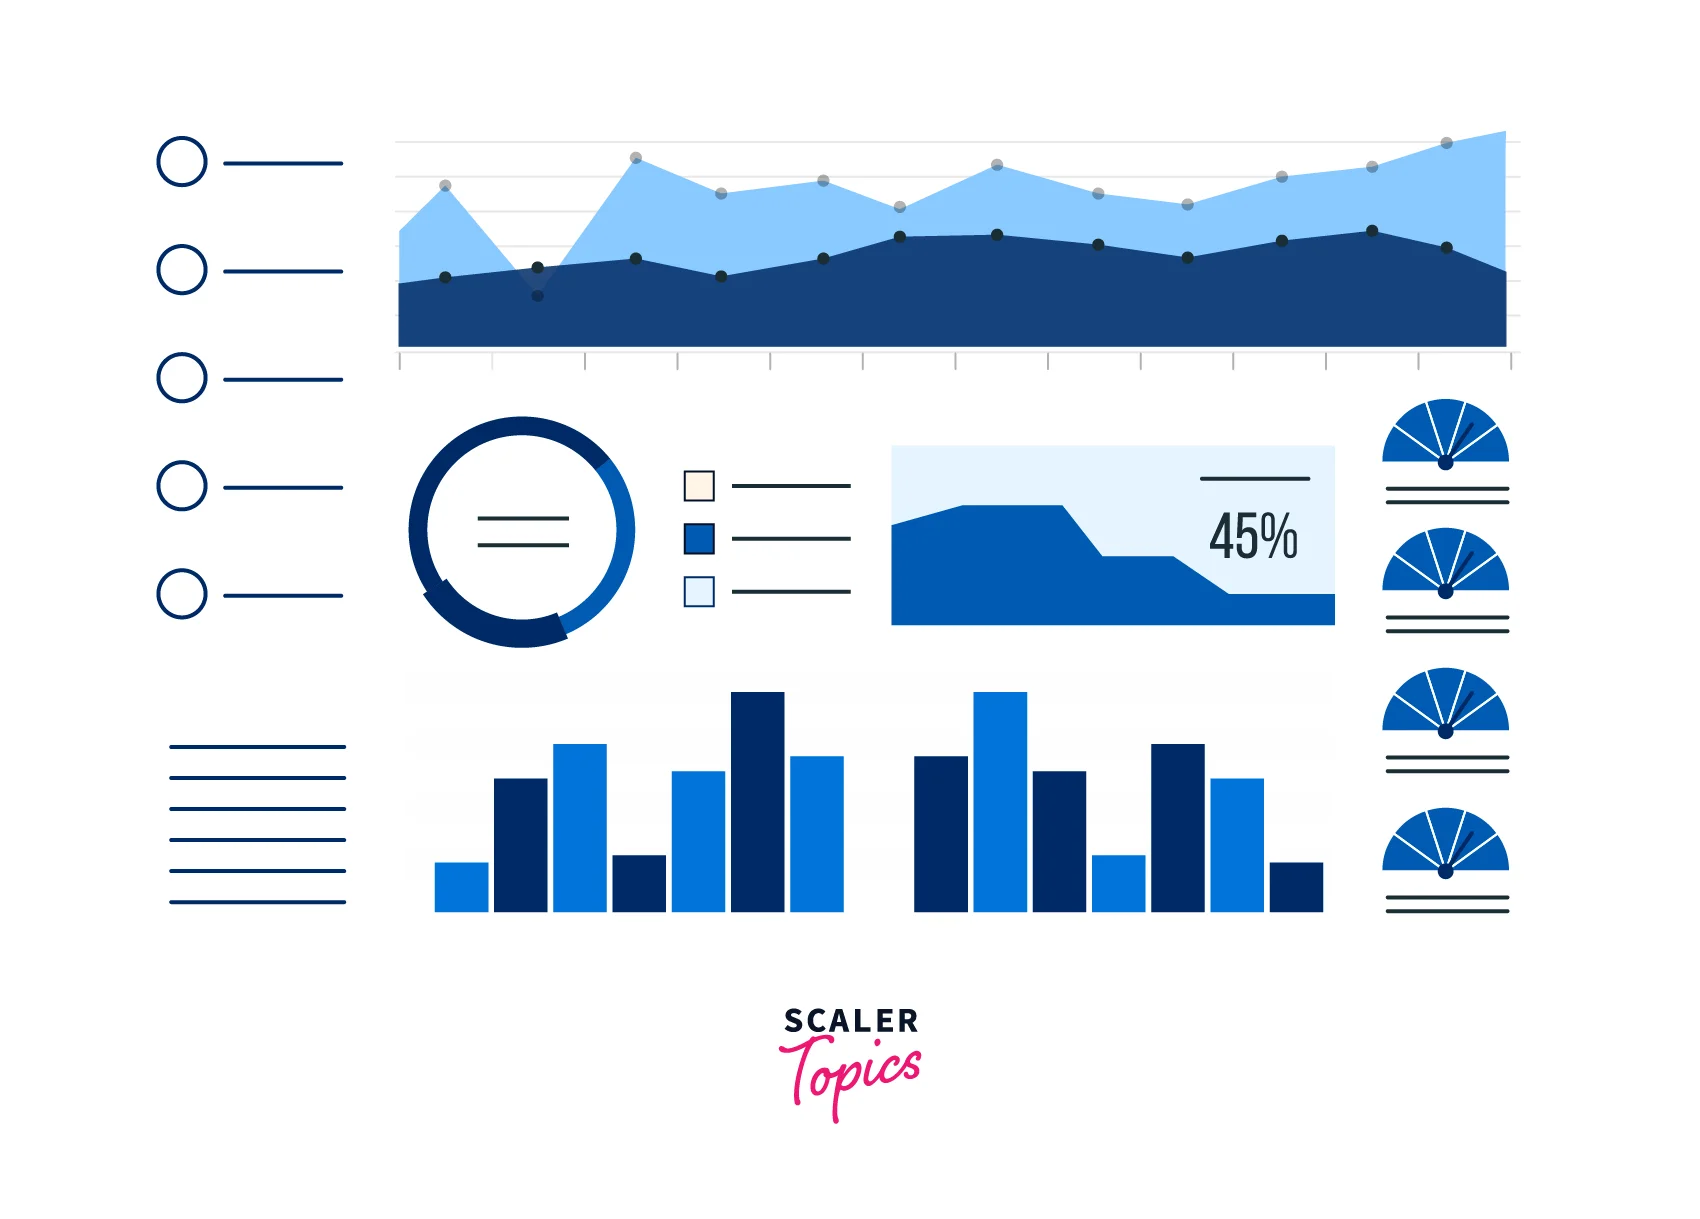
Data visualization, as the term represents, is the process in which data is visualized in the form of graphs, charts, or tables of any kind.
5. Machine Learning Insights:
Machine learning insights are some proposed conclusions based on data analysis.
6. Sheet:
A sheet represents a webpage that displays the machine learning insights and the visualization graphs or charts.
7. Dashboard:
An Amazon Quicksight dashboard behaves like an analysis that is published. You can share your dashboard with others expecting better decisions.
Scaler Placement Report and Statistics
Scaler learners achieved 2.5x salary growth with average post-Scaler CTC reaching ₹23L.
Working with AWS QuickSight
Having understood the terminologies, let's understand the working of Amazon.
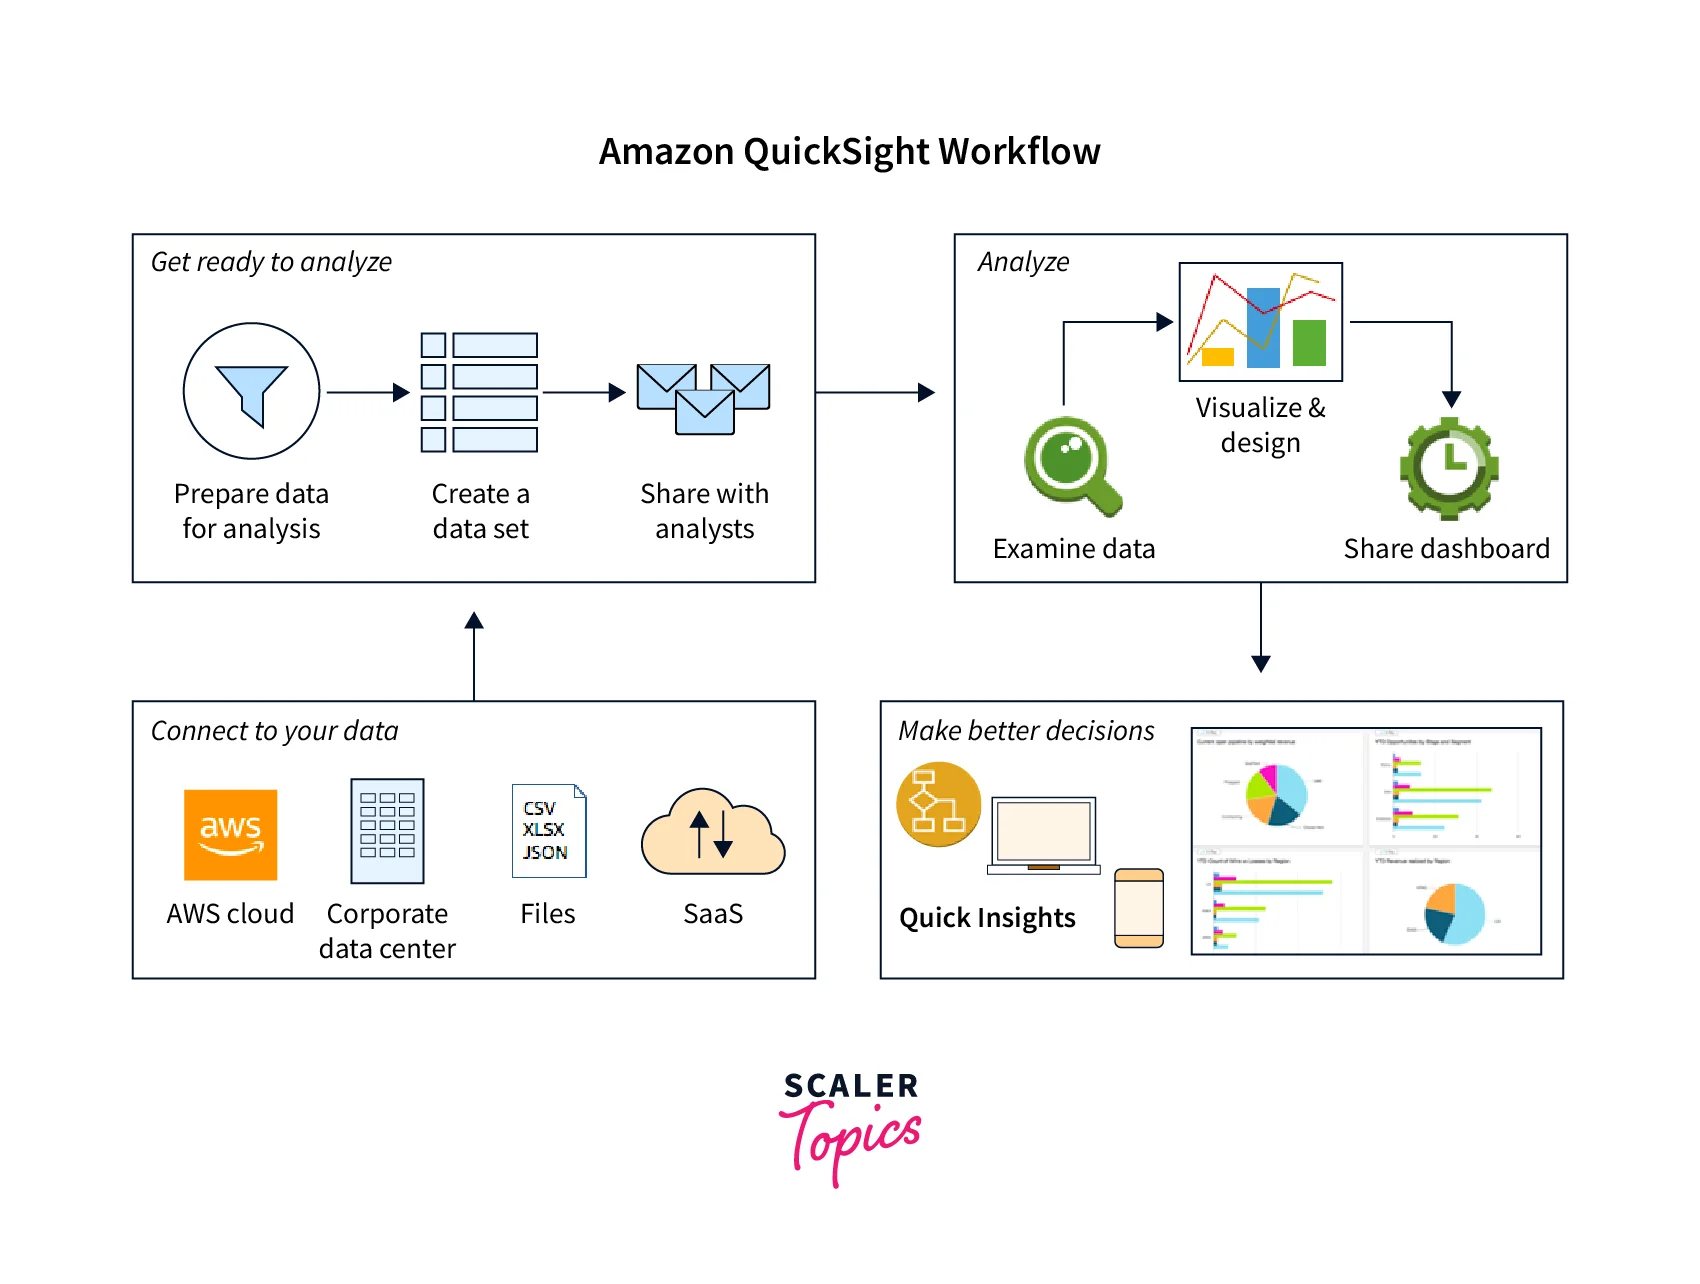
- The data is collected from various sources. Amazon Quicksight stores this data in SPICE memory or in the form of a direct query. You can use this data to carry out the data preparation process.
- A new analysis is created to carry out the Data Analysis stage. You can add datasets to this analysis.
- Amazon Quicksight automatically generates the best possible visualization for choosing the required fields.
- Once the analysis report is generated, we can publish the analysis to the Dashboard. This dashboard can be shared with other business individuals.
Key Features of AWS QuickSight
The following are the key features of AWS Quicksight:
- Data Connectivity: AWS Quicksight can import data from any cloud-based or on-premises resources.
- Integration: Amazon Quicksight can be integrated with other AWS resources or third-party resources like Salesforce, JIRA, etc., to yield better reports.
- Reporting: The reports generated using quick sight can be shared daily, weekly, or monthly with the users. You can subscribe to the email service to receive the reports.
- SPICE Engine: Quicksight uses the SPICE engine, which increases its processing speed and storage capacity, thus increasing its performance.
- Data Visualization: AWS quick sight provides a rich library of graphs, charts, and tables to choose from. Data visualization is made easier as quick sight automatically picks the best possible way to represent the data.
- Dashboards: Data dashboards can be created using multiple options for selecting charts and graphs. Not only this but the report layout can also be displayed in multiple ways.
- Language Support: It provides support for many local languages, which makes the report analysis easier. Quickly sight supports English, German, Italian, Portuguese, Japanese, Korean, Spanish, French, and Chinese.
- Serverless: Quicksight is a serverless service, so scaling it becomes easier. We don't need to worry about installing new infrastructure when the need for scaling arises.
- ML-based Insights: AWS Quicksight uses Machine learning (ML) and Natural Language Processing (NLP) to get deeper insights into data. Machine learning is used to understand data trends and patterns and for predictions.
How to Visualize Data with AWS QuickSight
As we learn more about AWS QuickSight, Let's try to Visualize Data with it. Amazon QuickSight gives us interactive dashboards to visualize and represent our data more easily.
To visualize any data, it follows some steps, they are:
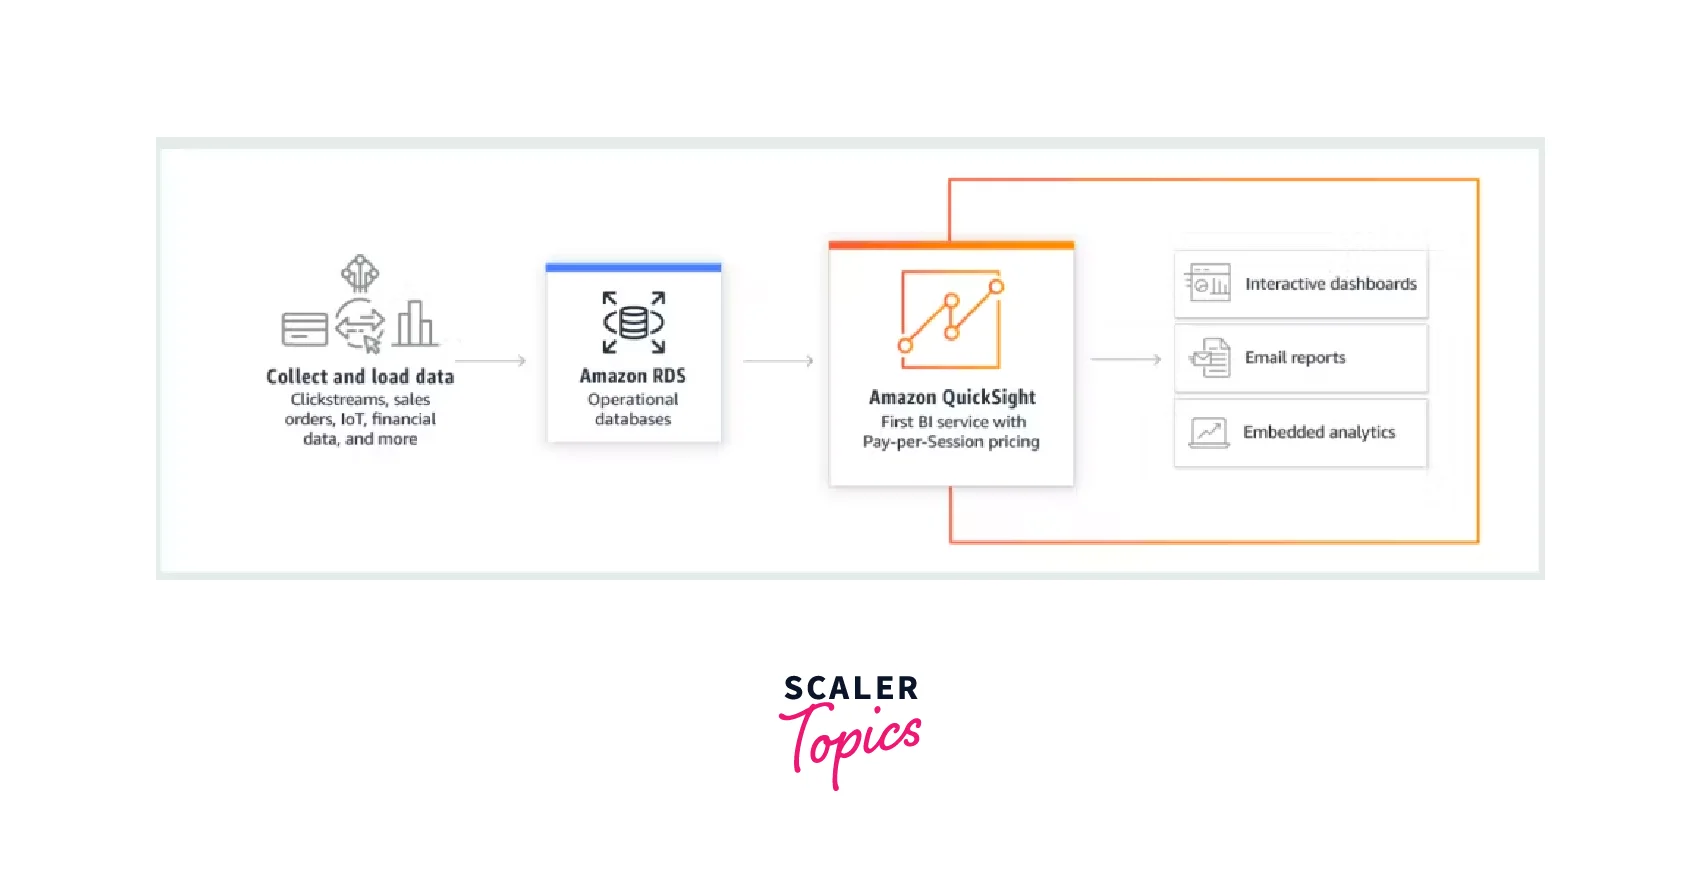
1. Collect and Load the Data
Amazon QuickSight gets the data from different sources. It can read the data from different utilities, including Aurora, Redshift, Athena, Amazon S3, and Elasticsearch Services. It also collects data from API-based data sources like Salesforce. Amazon QuickSight supports live-streaming databases from IoT devices, sales orders, etc. This way, it provides various methods to load the data to visualize.
Transform Your Career
Choose from our industry-leading programs designed for career success
Modern Software and AI Engineering Program
Master full-stack development with AI integration

Modern Data Science and ML with specialisation in AI
Advanced data science techniques with AI specialization
Advanced AIML with Specialisation in Agentic AI
Deep dive into AIML with focus on Agentic systems
DevOps, Cloud & AI Platform Engineering
Build and manage AI-powered cloud infrastructure
AI Engineering Advanced Certification by IIT-Roorkee
Premier AI engineering certification from IIT-Roorkee
2. Connect to Data
AWS QuickSight connects to the data from different locations like AWS cloud, the data centre of any company, third-party applications, CSV/XLSX/JSON files, etc. Before analysis of the data, it prepares the data by filtering it with its properties, like changing data types, adding calculated fields, etc. This process turns data into processed data so we can perform different queries on it and visualize it more accurately.
3. Analyze Data
Now, the following process is to Analyze the processed data. With the processed data Business Intelligence performs calculations and create graphs using Super-fast, Parallel, In-memory Calculation Engine (SPICE). This engine is built in such a way that it retrieves data every time an analysis is changed or visually updated.
4. Create Visualizations
Finally, after the data analysis, we create visualizations from the data. Amazon QuickSight creates visualizations users can arrange and customize. It provides different data visualisation options, like a bar chart and pivots tables. We can create interactive dashboards, email reports, and embedded analytics that users can access and take necessary actions per their needs.
Now as we understand how to analyze and visualize data let's try it with hand on practice in the next section.
Getting Started with AWS QuickSight
Let's start with AWS QuickSight and learn how to create a Visualization in Amazon QuickSight.
It involves the following steps:
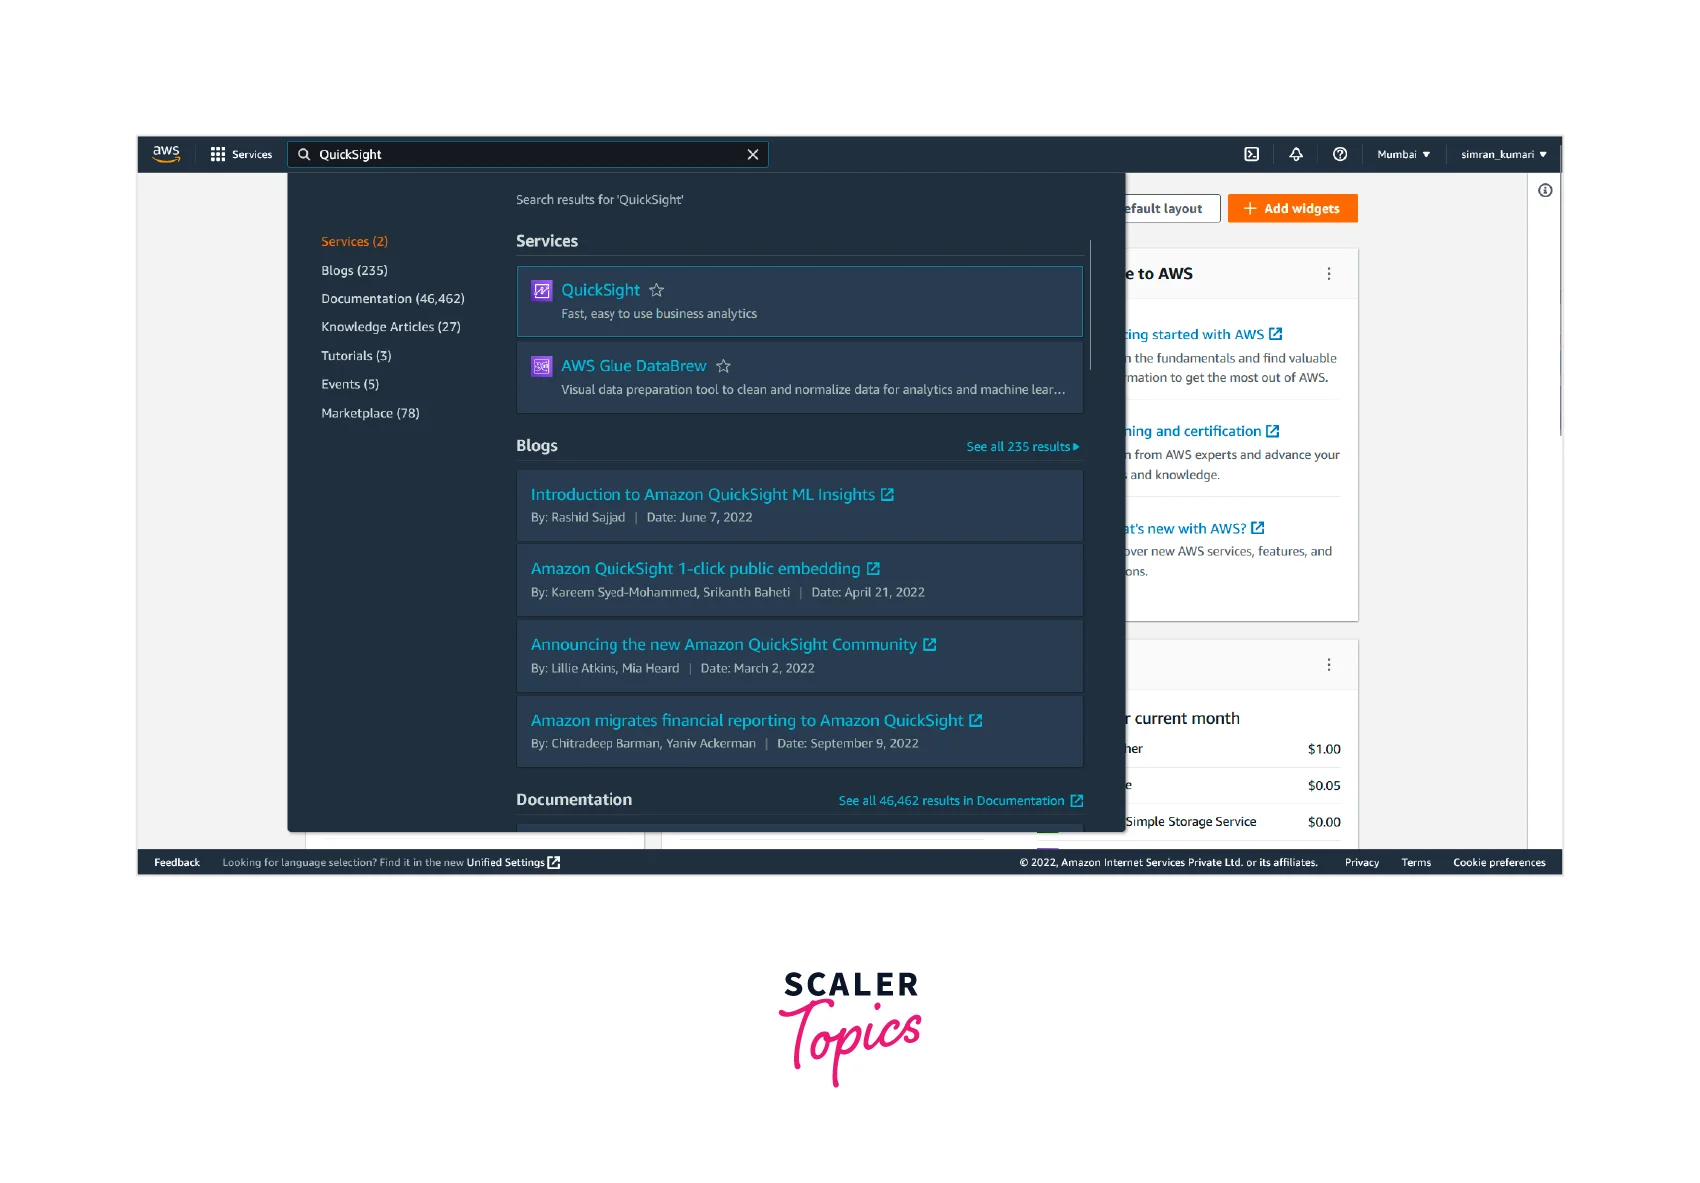
- Log in to the AWS account and search for QuickSight. Click on QuickSight.
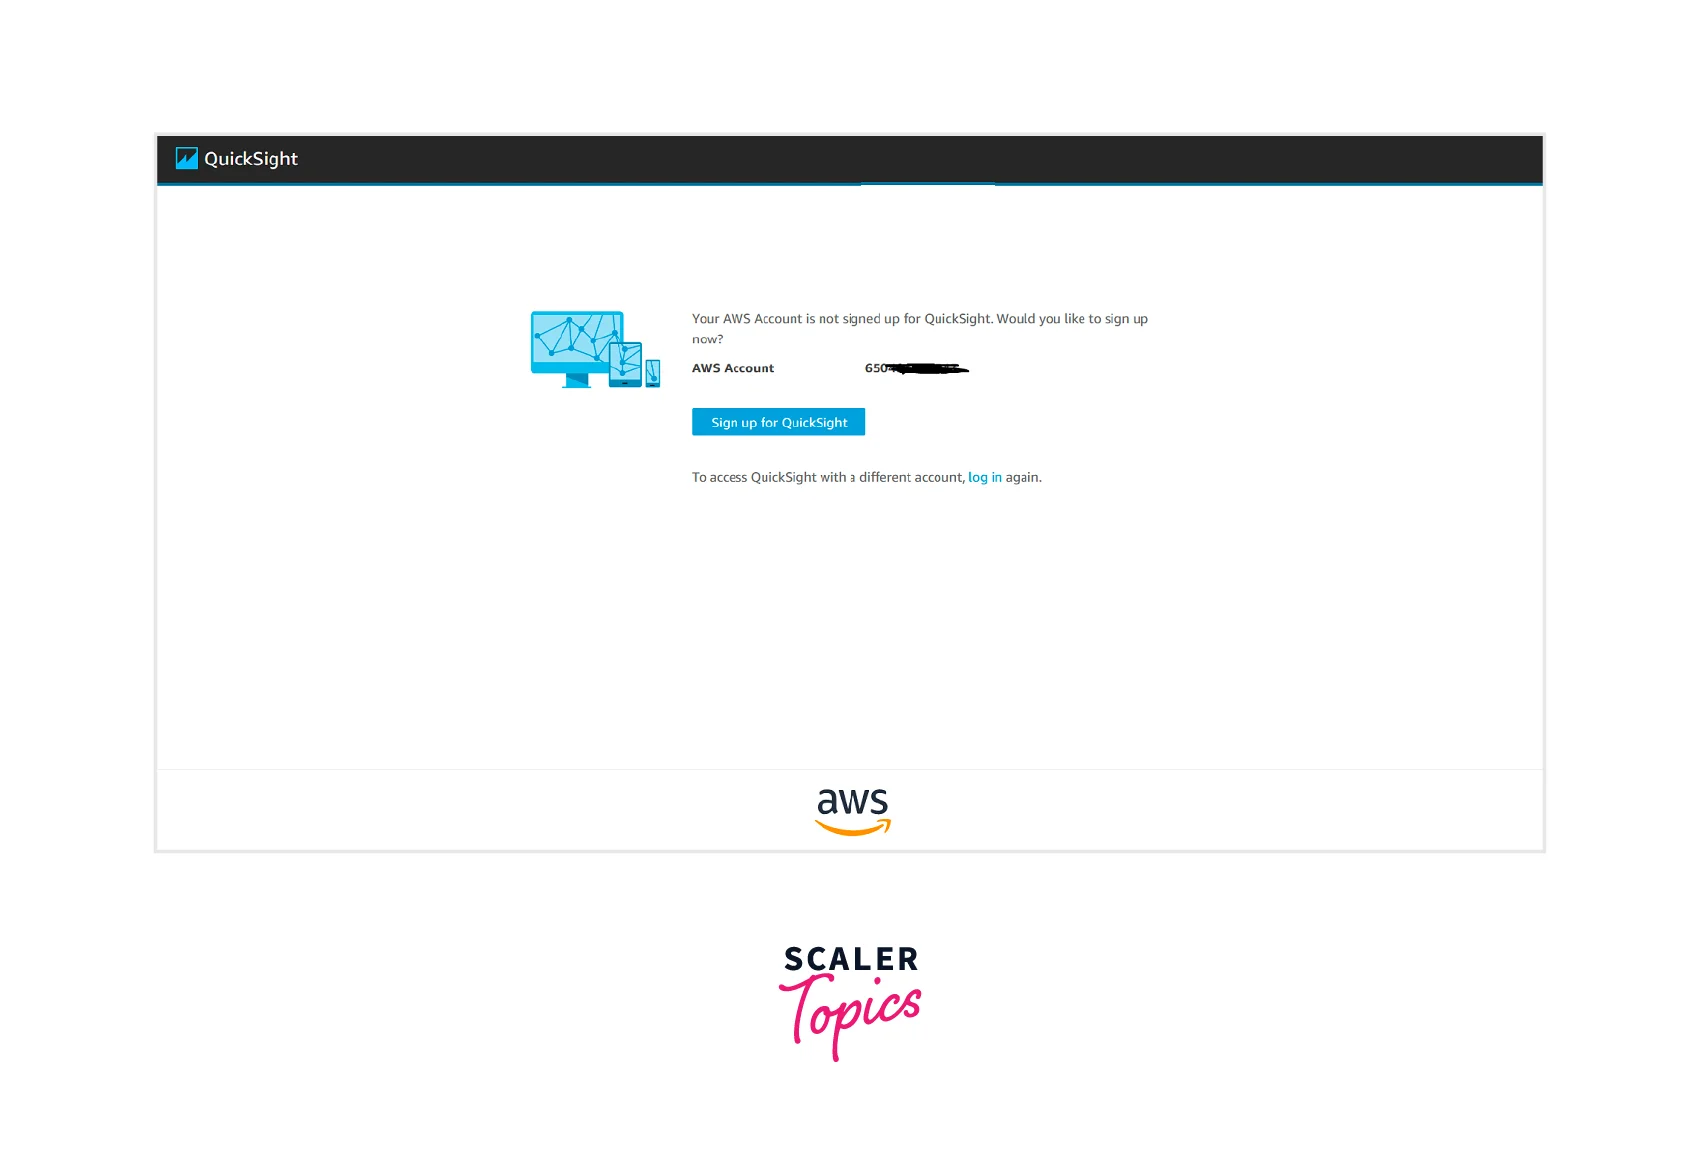
- It will open a QuickSight page asking you to Sign up for it if you are launching QuickSight for the first time. Click on Sign up for QuickSight.
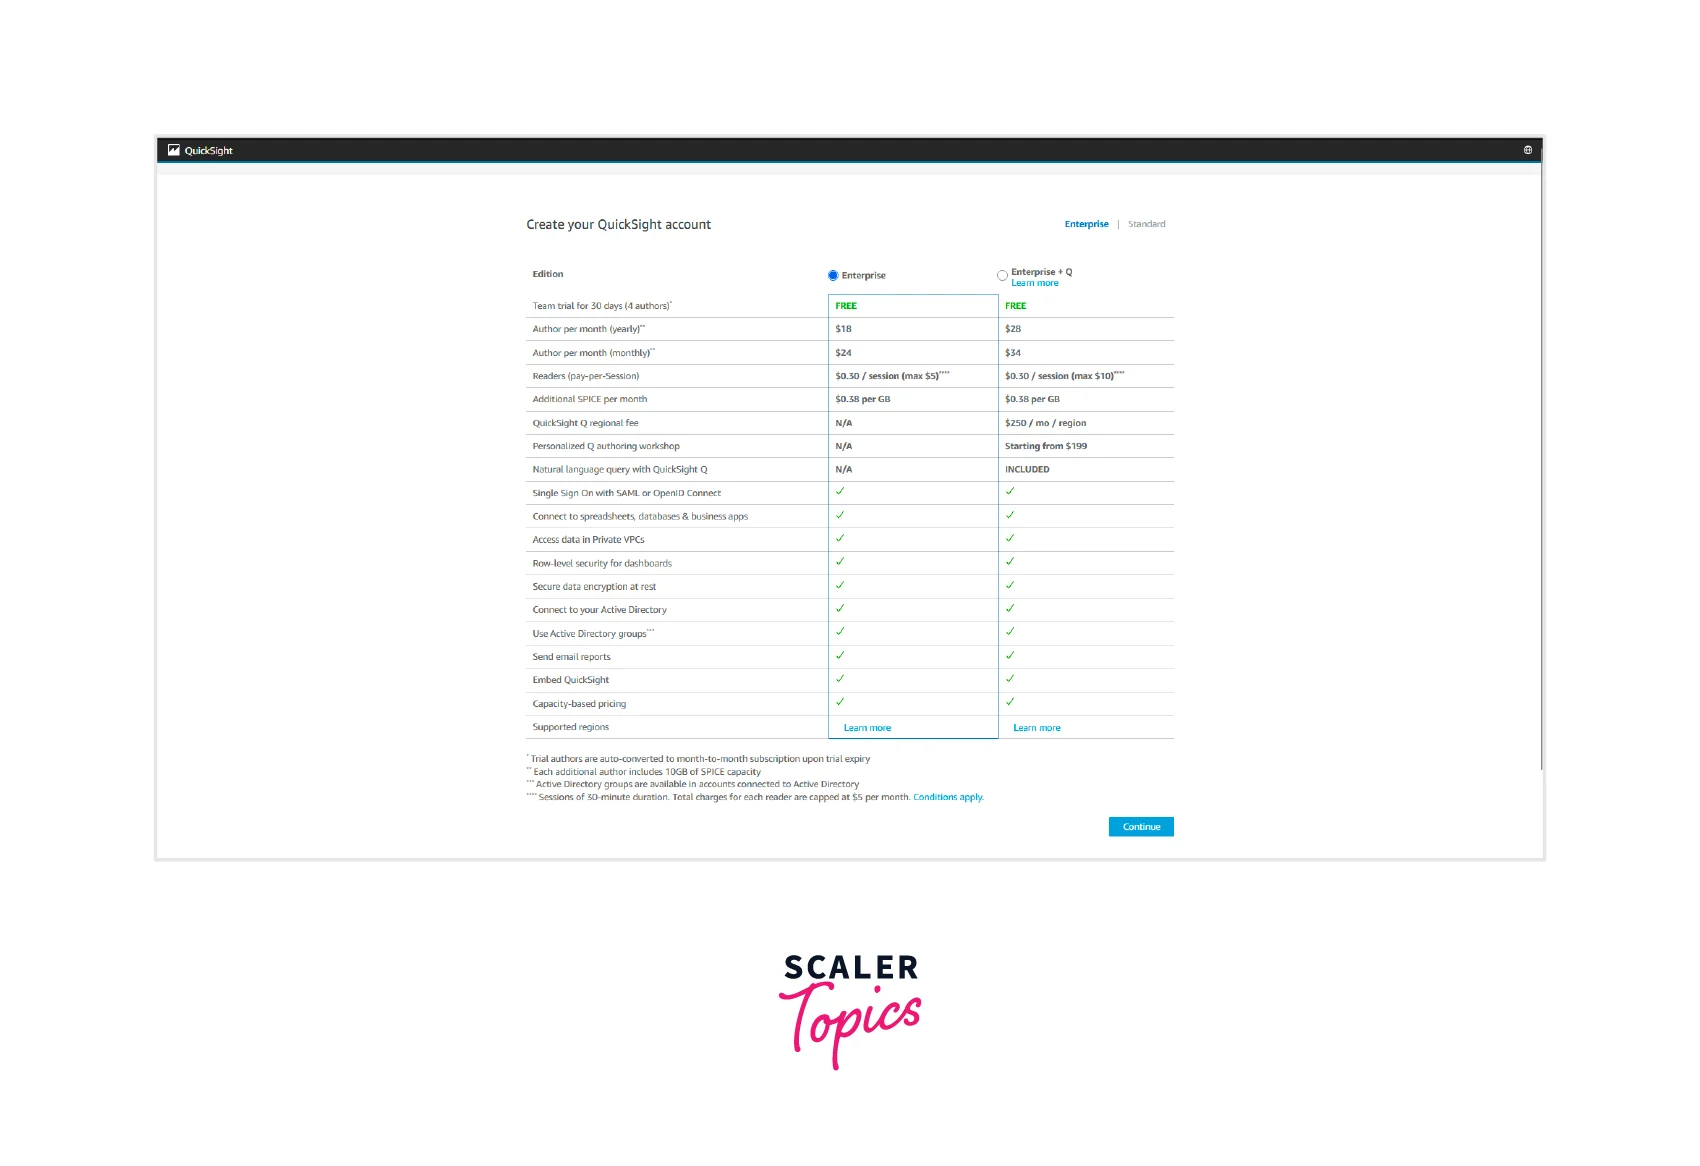
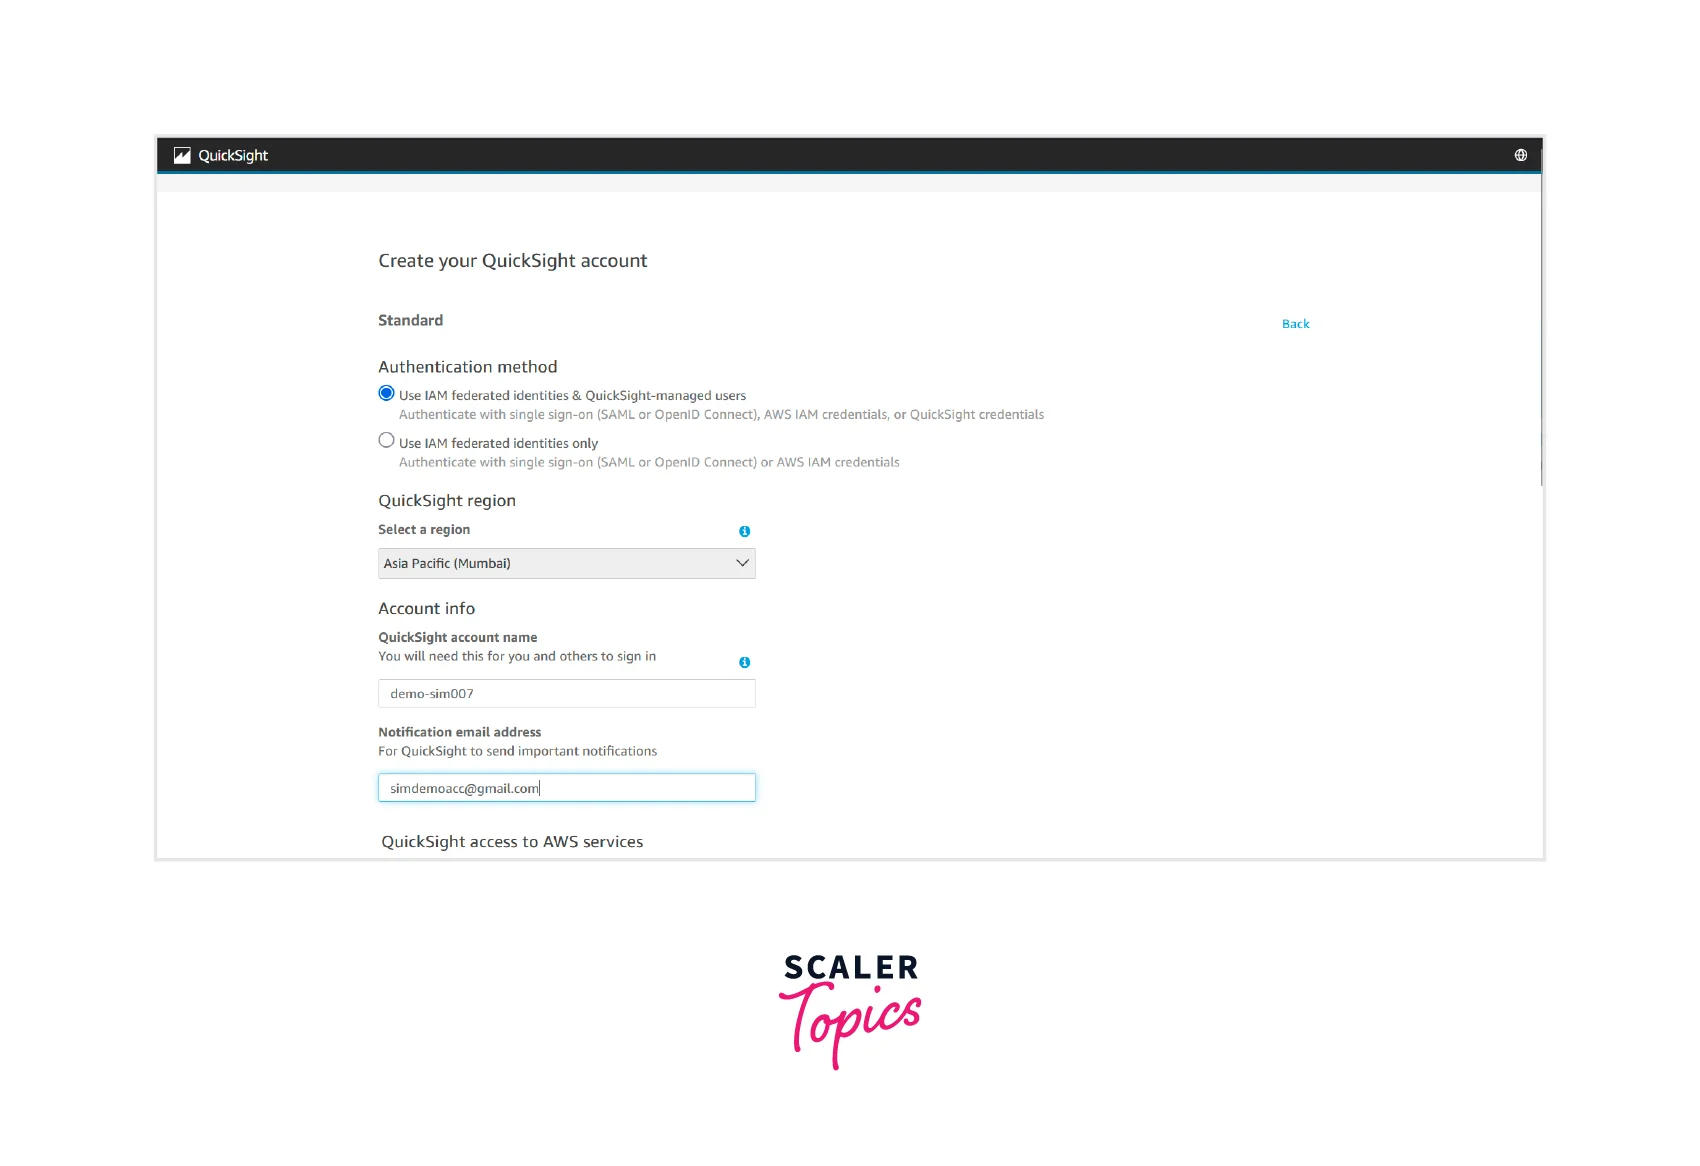
- After that, we must select the type of account we want to create on the next page. Click on Standard.
- On the next page, select Use IAM federated identities & QuickSight-managed users. We can also have an option of Use IAM federated identities only. Select a QuickSight region, set the QuickSight account name, and set an email notification email address. Leave all other fields as default. Click on Finish.
- Our sign-up process is done successfully, and clicks on Go to Amazon QuickSight.

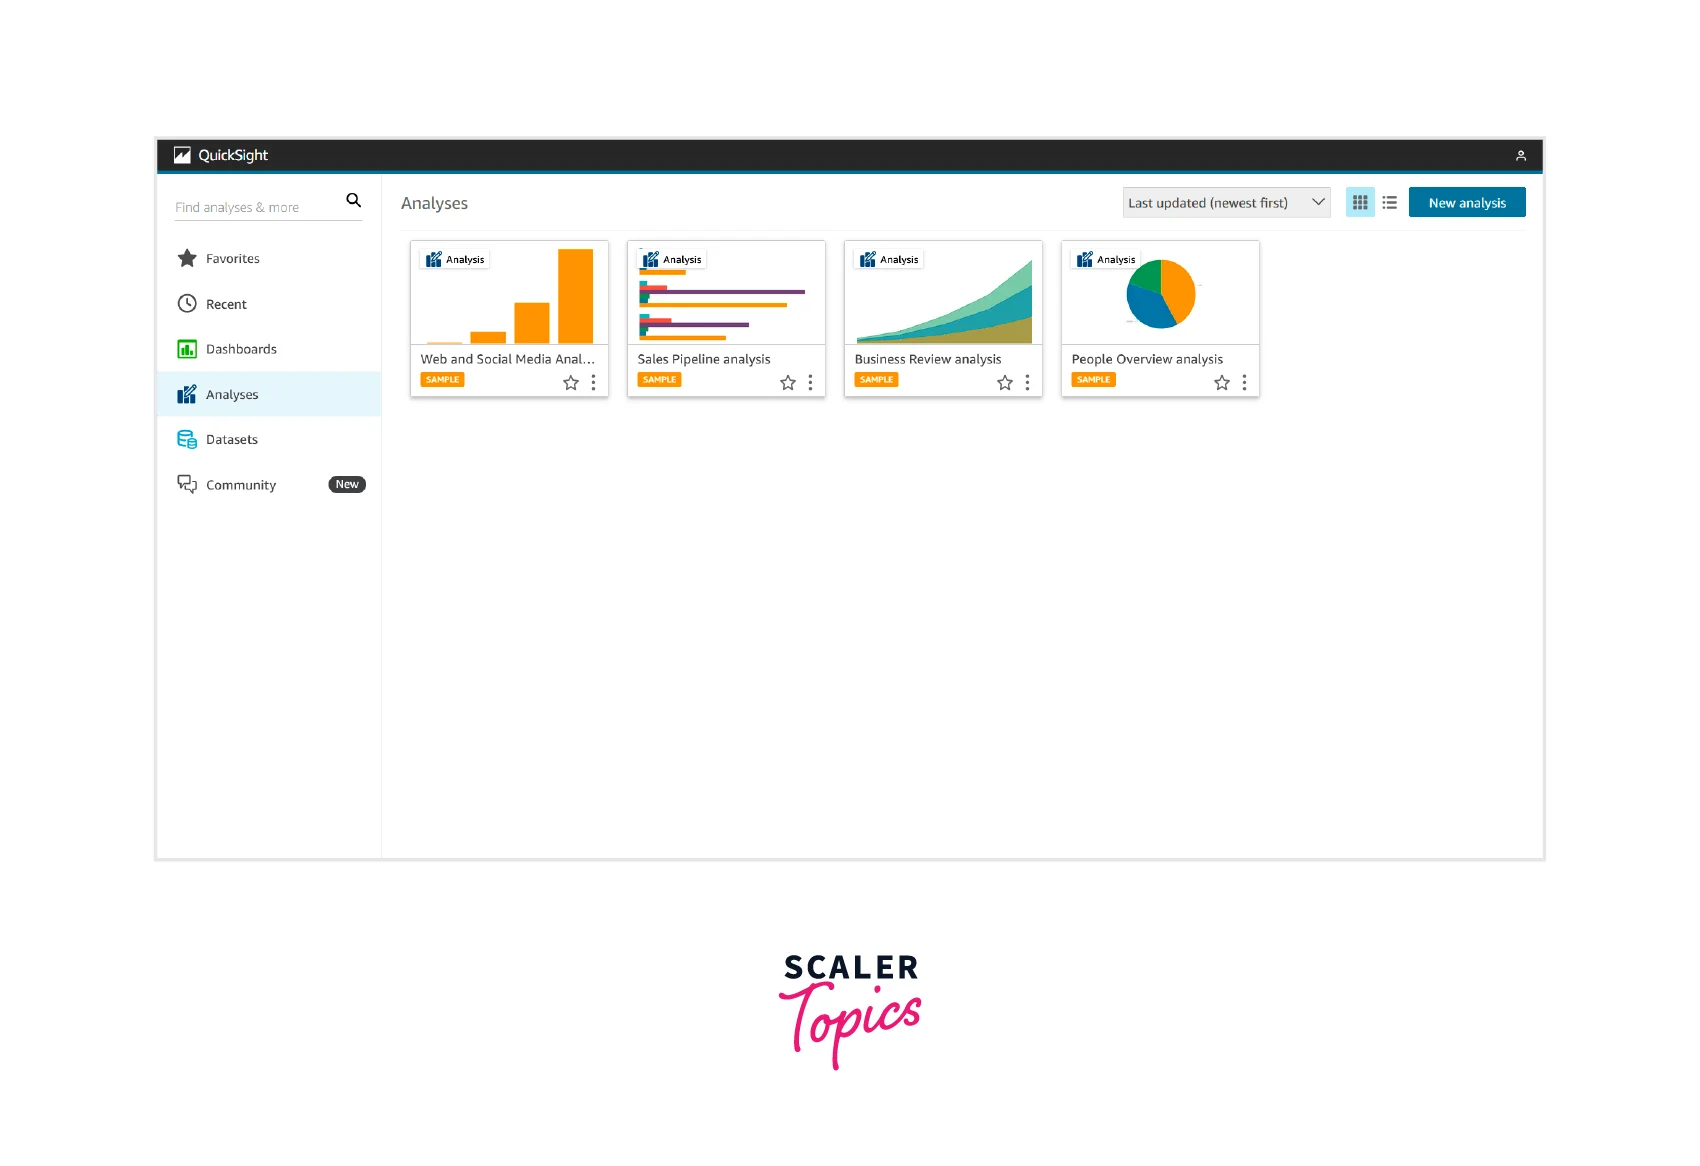
- On the next screen, click on Next 3 to 4 times and then click on Get started. We will land on the QuickSight Analyses page. Some sample analyses are present on this screen. We will use the Web and Social Media Analytics dataset that Amazon QuickSight provides. Click on this link to download the zip file of the dataset. Unzip this file and save it in your local system as web_and_social_media_database.csv. Now click on New analysis.
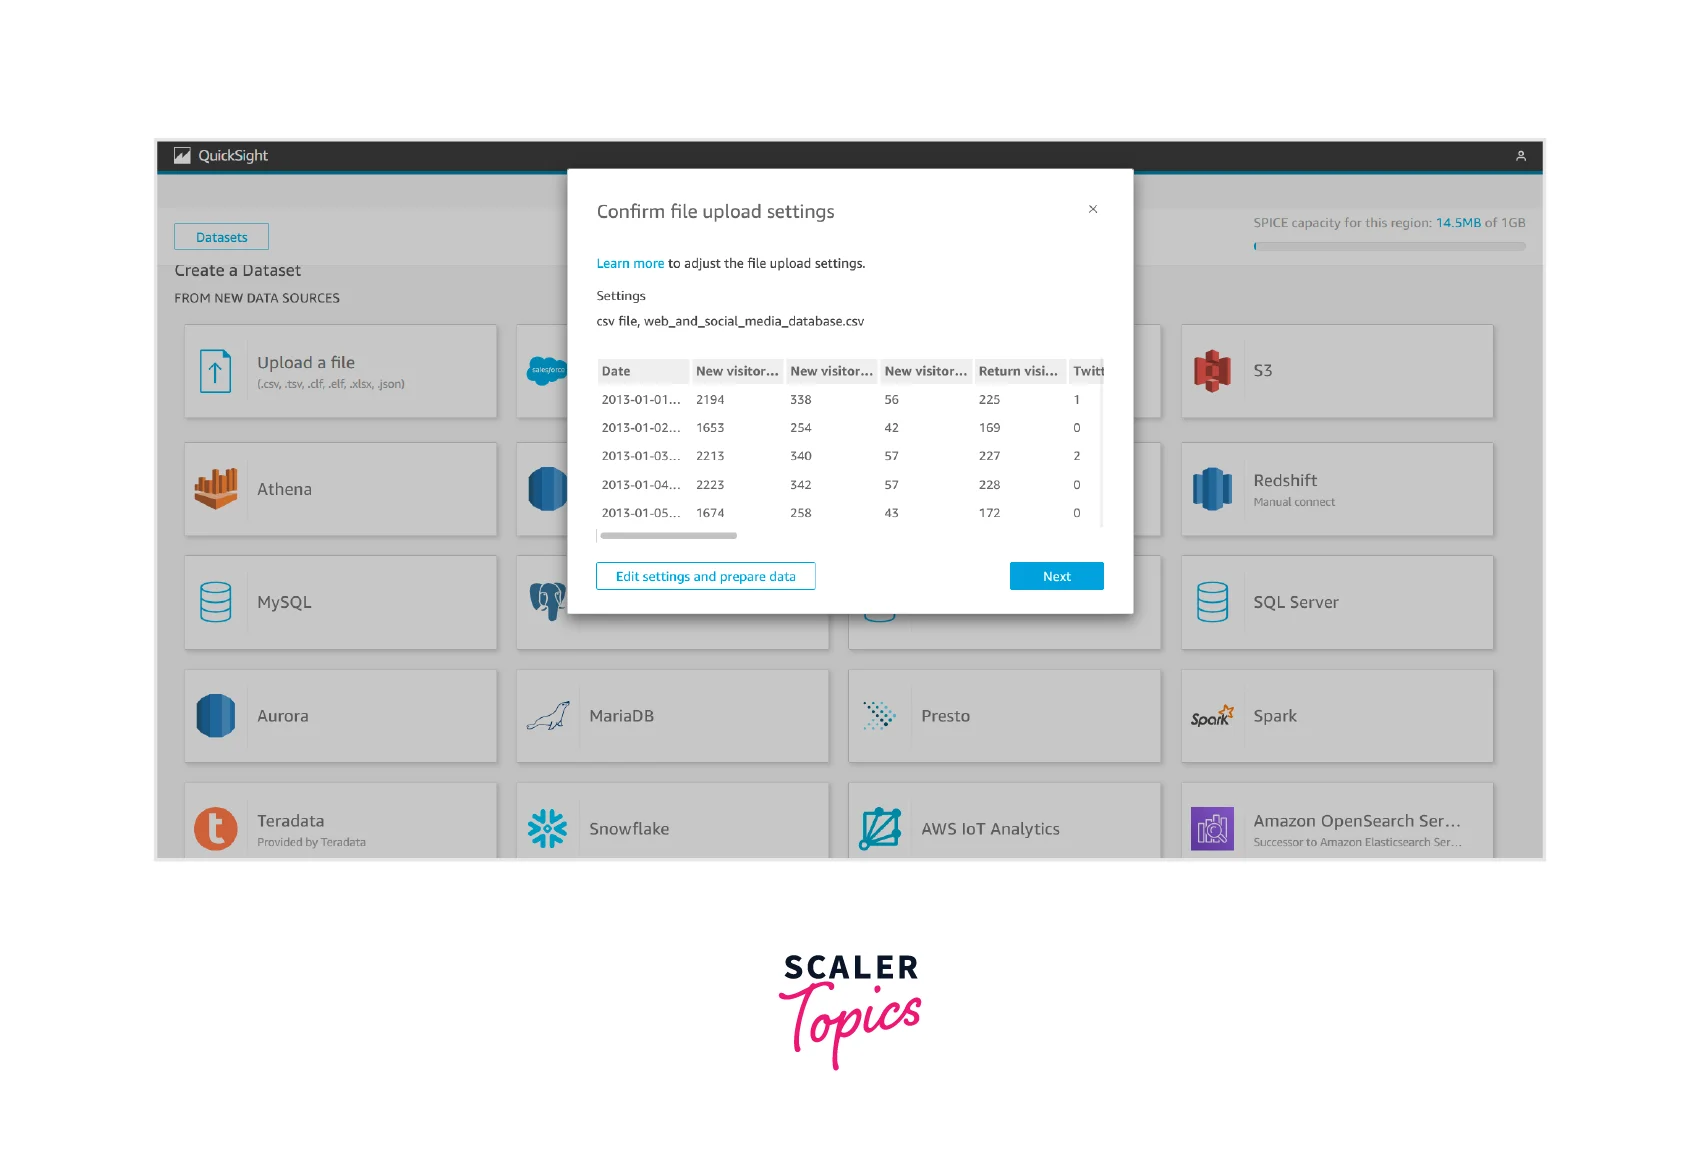
- Next, click on New dataset.

- Click on Upload a file. Choose the CSV file from the local system. Click on open. It will upload the CSV file. Click on Next on the Confirm file upload settings screen.
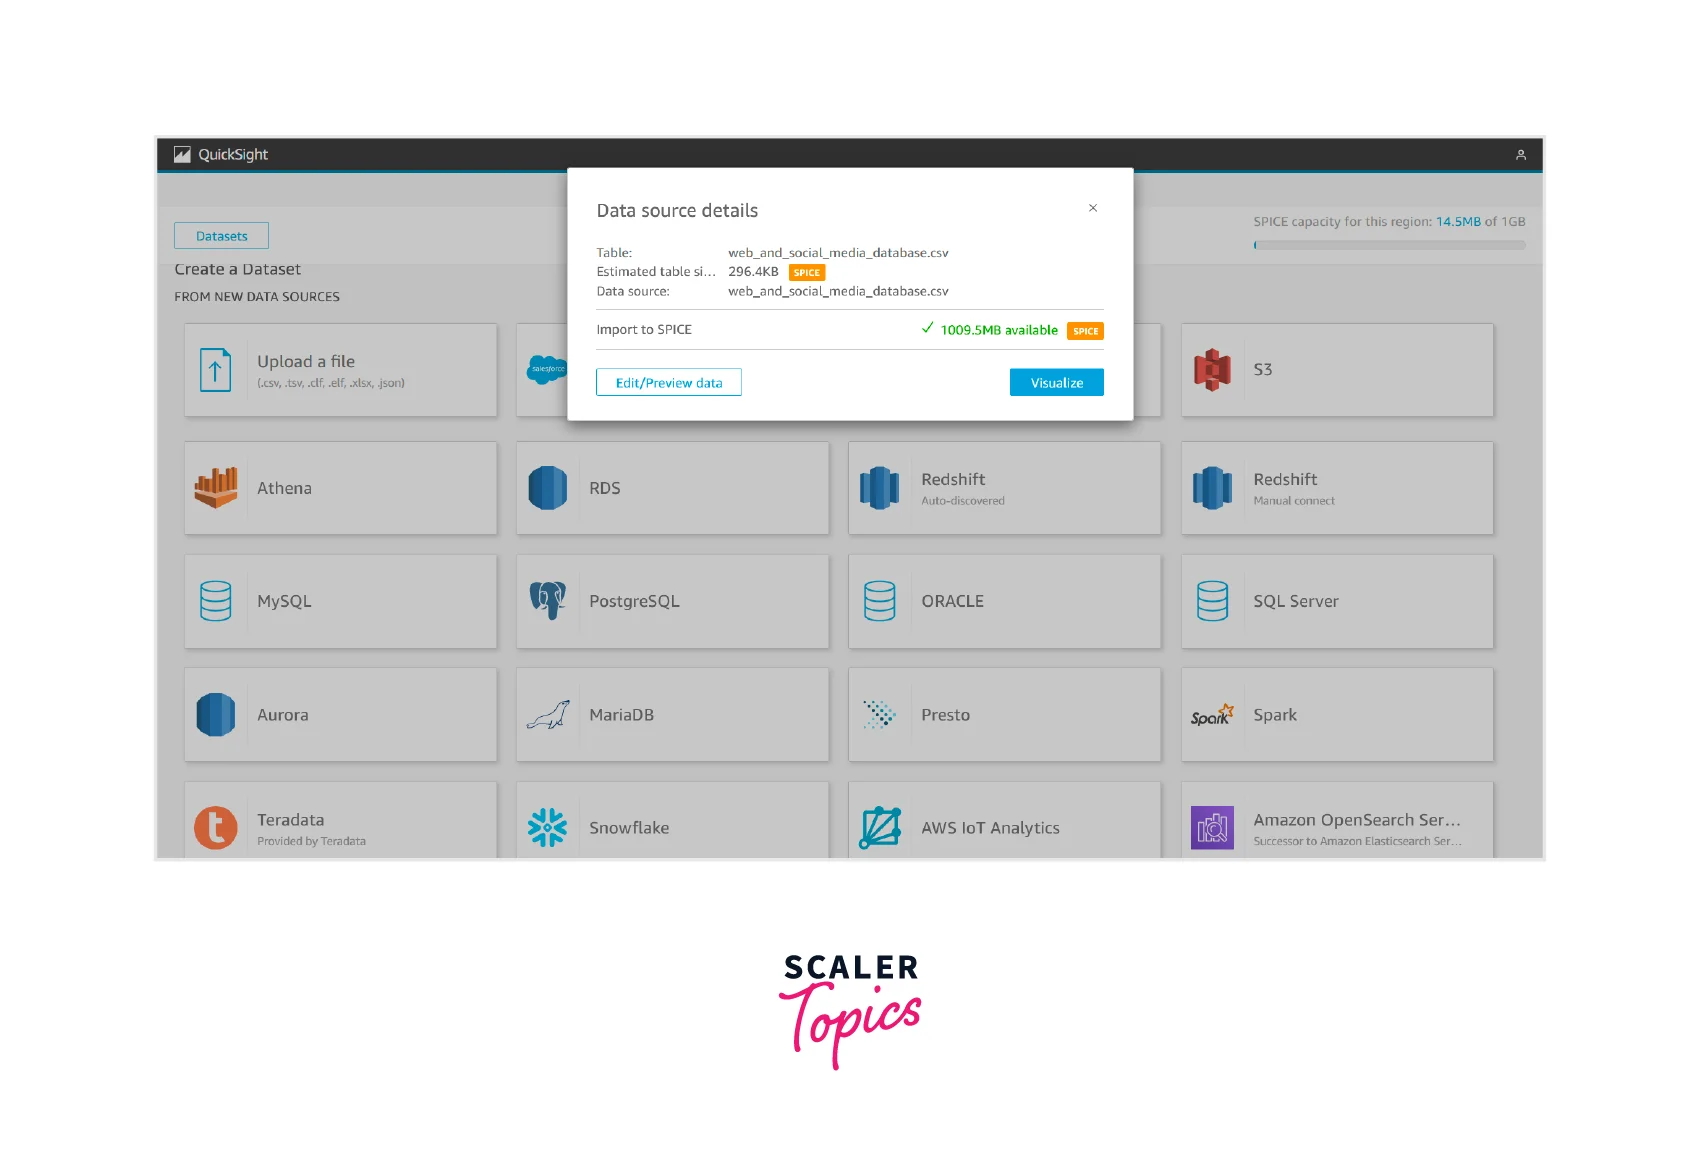
- Click on Visualize in the Data source details screen.
- Next, We will land on the web_and_social_media_database.csv analysis screen. Select Date and Mailing list add from the Fields list menu.

- We can expand the Field wells by clicking on them.

- Click on Date in the X axis, choose Aggregate, and then choose month.
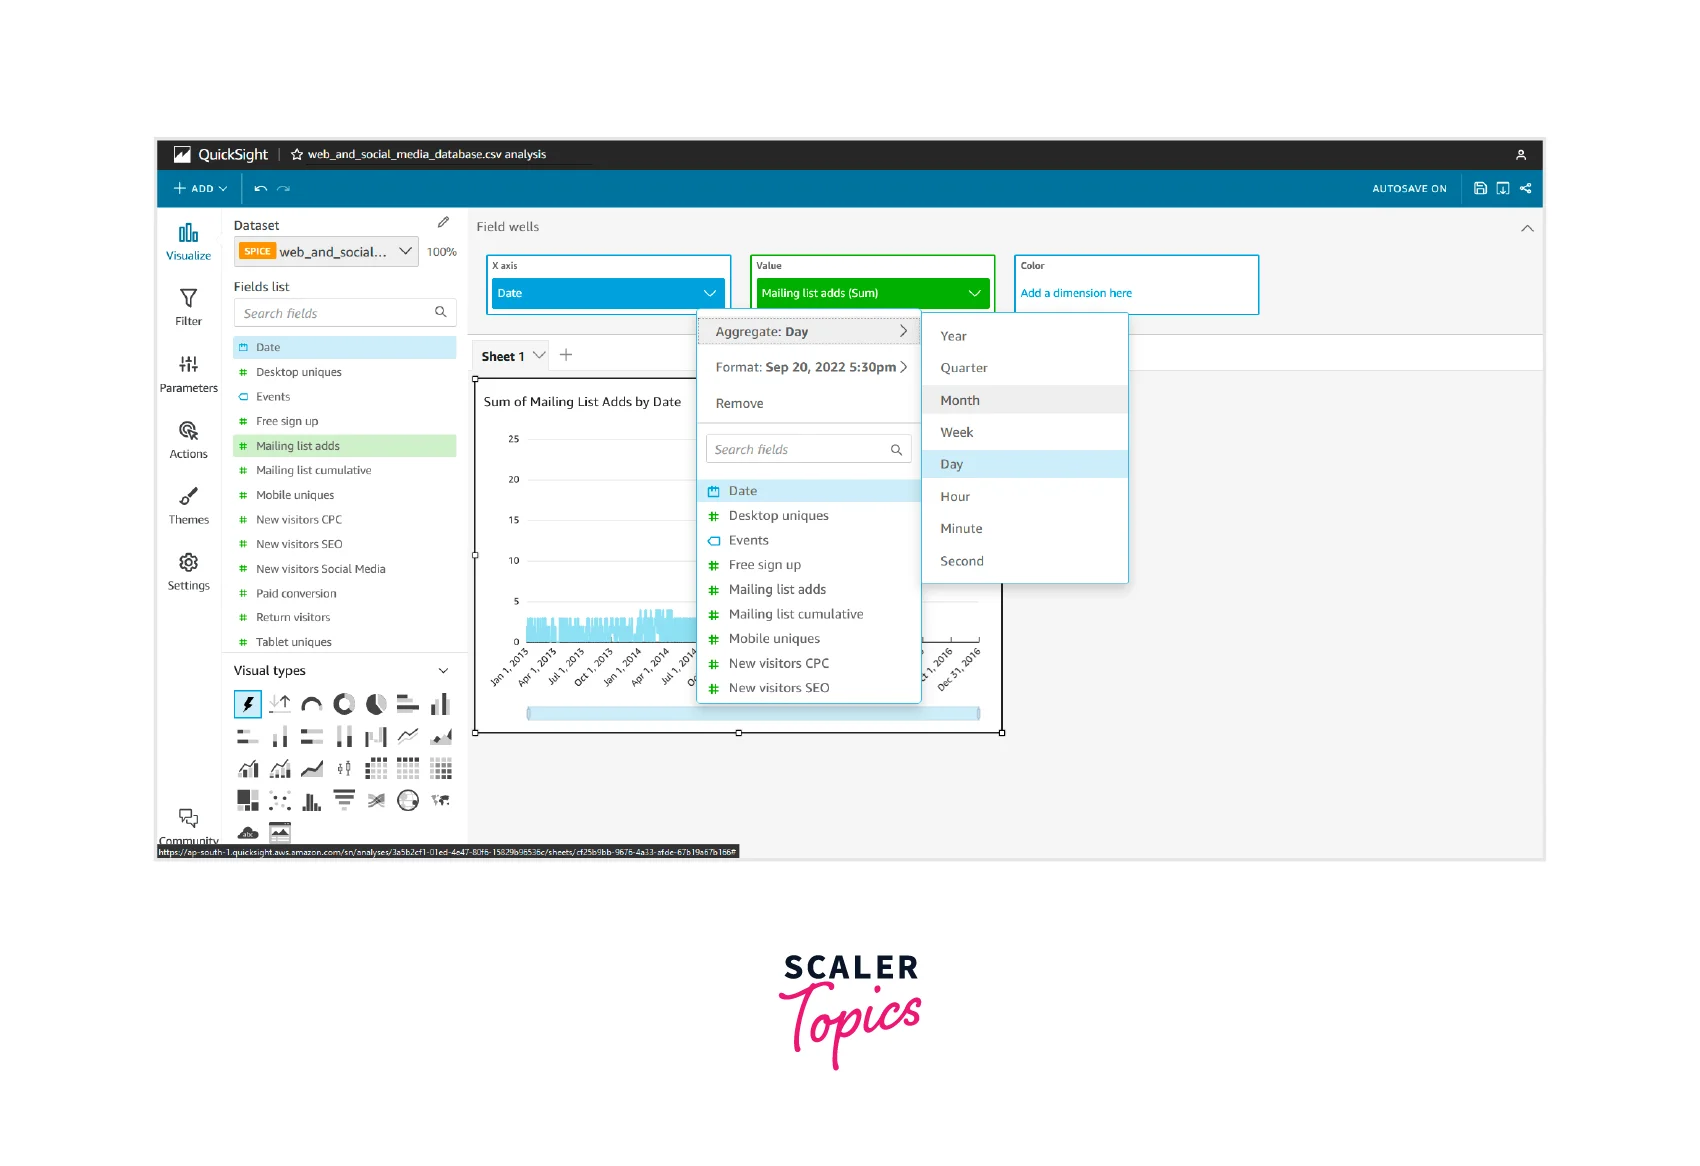
- The chart has been updated to show monthly mailing list adds.
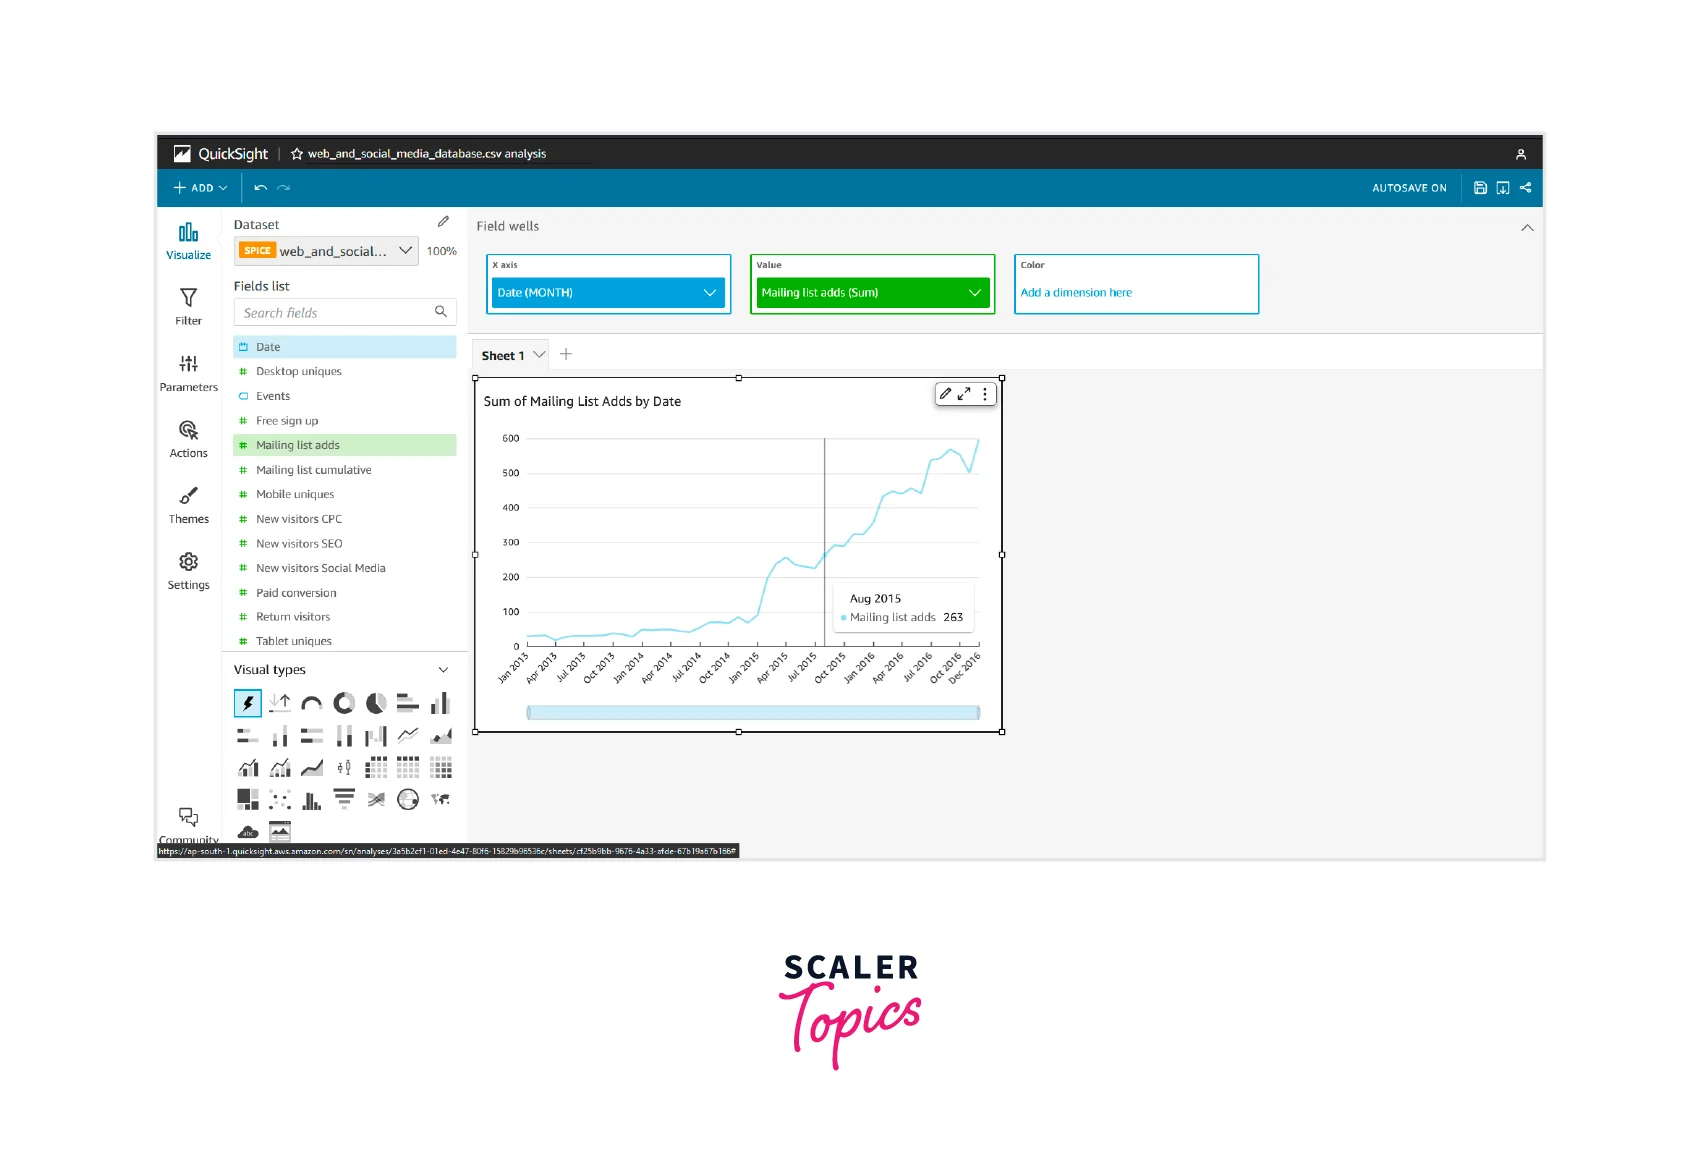
As mentioned above, these steps help us visualize the dataset in Amazon QuickSight.
For more tutorials on AWS Quicksight, you can visit here.
Use Cases of AWS QuickSight
Connecting to Amazon Relational Database Service
Amazon Quicksight can be used to import data from any source, including Amazon Relational Database Service.
Quicksight uses this data for the following:
- Create interactive dashboards
- Generate email reports
- Perform analytical operations
Connecting to Data Warehouses
- Amazon Quicksight works with Data warehouses in a similar way as with other relational databases.
- The difference between the two is the location to which data is sent. In the previous use case, data was sent to the Amazon Relation database service, where the data gets sent to data warehouses like Amazon Redshift.
- This data is sent to quick sight to create interactive dashboards, generate email reports, and perform analytical operations.
Connecting to AWS Data Lakes
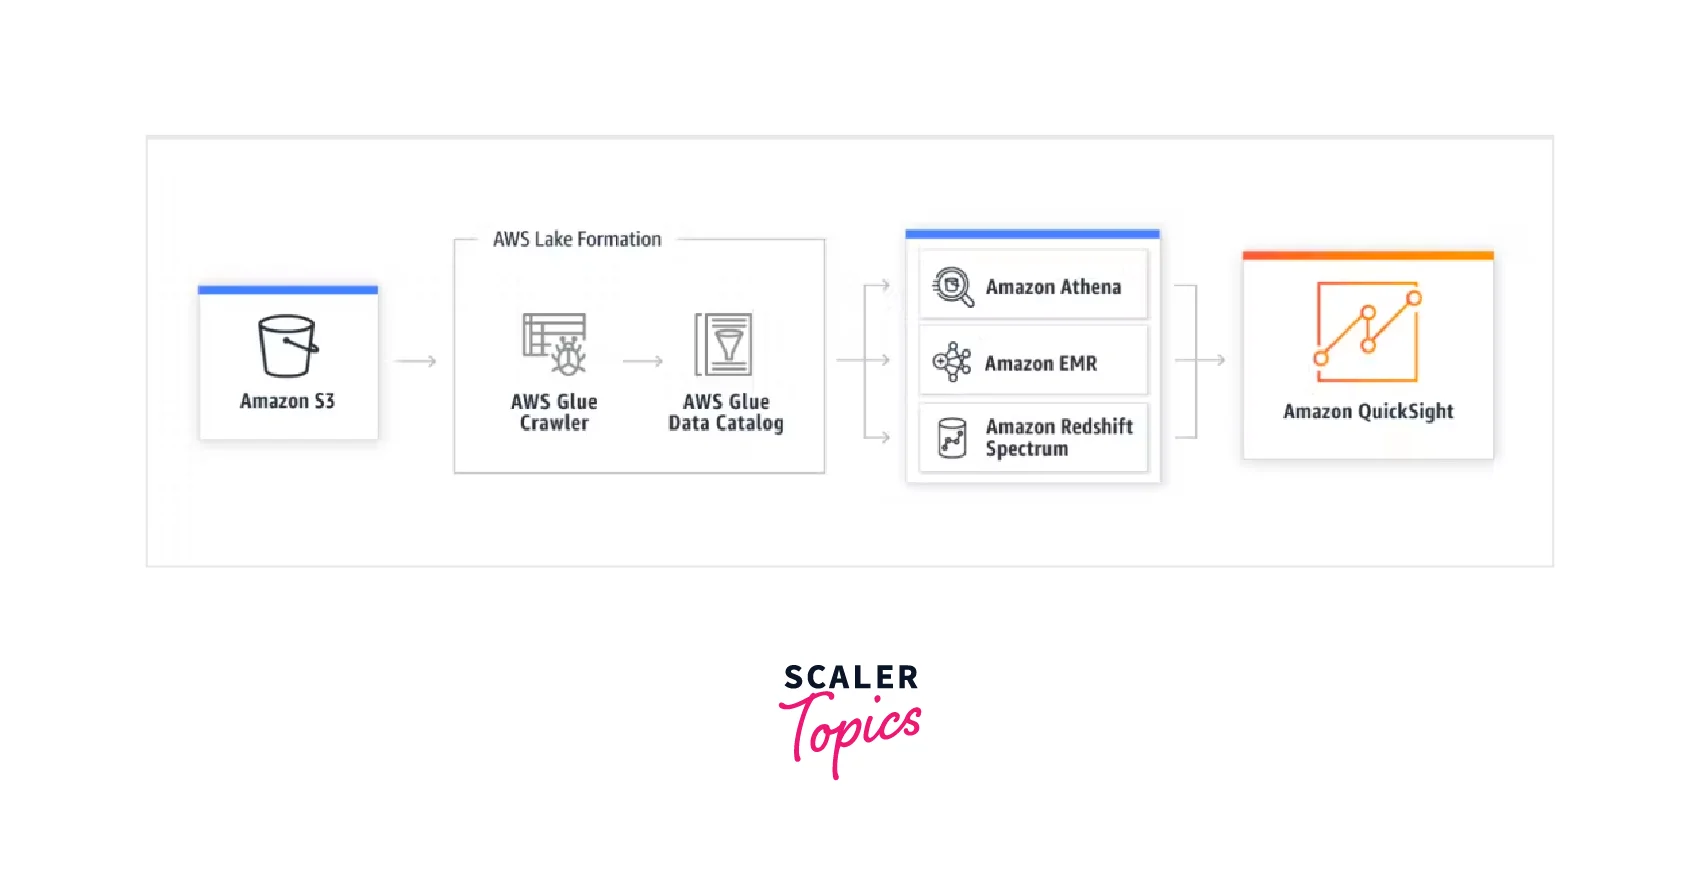
- Data is fetched from the AWS S3 bucket.
- This data gets loaded to the AWS Glue crawler and then transferred or loaded to the AWS Glue data catalogue.
- After this, the data is taken to the staging area, here Amazon Athena, Amazon EMR, or Amazon Redshift Spectrum.
- From here, the data is utilized by or sent to Amazon Quicksight for creating dashboards and generating reports.
Listed below are a few example use cases:
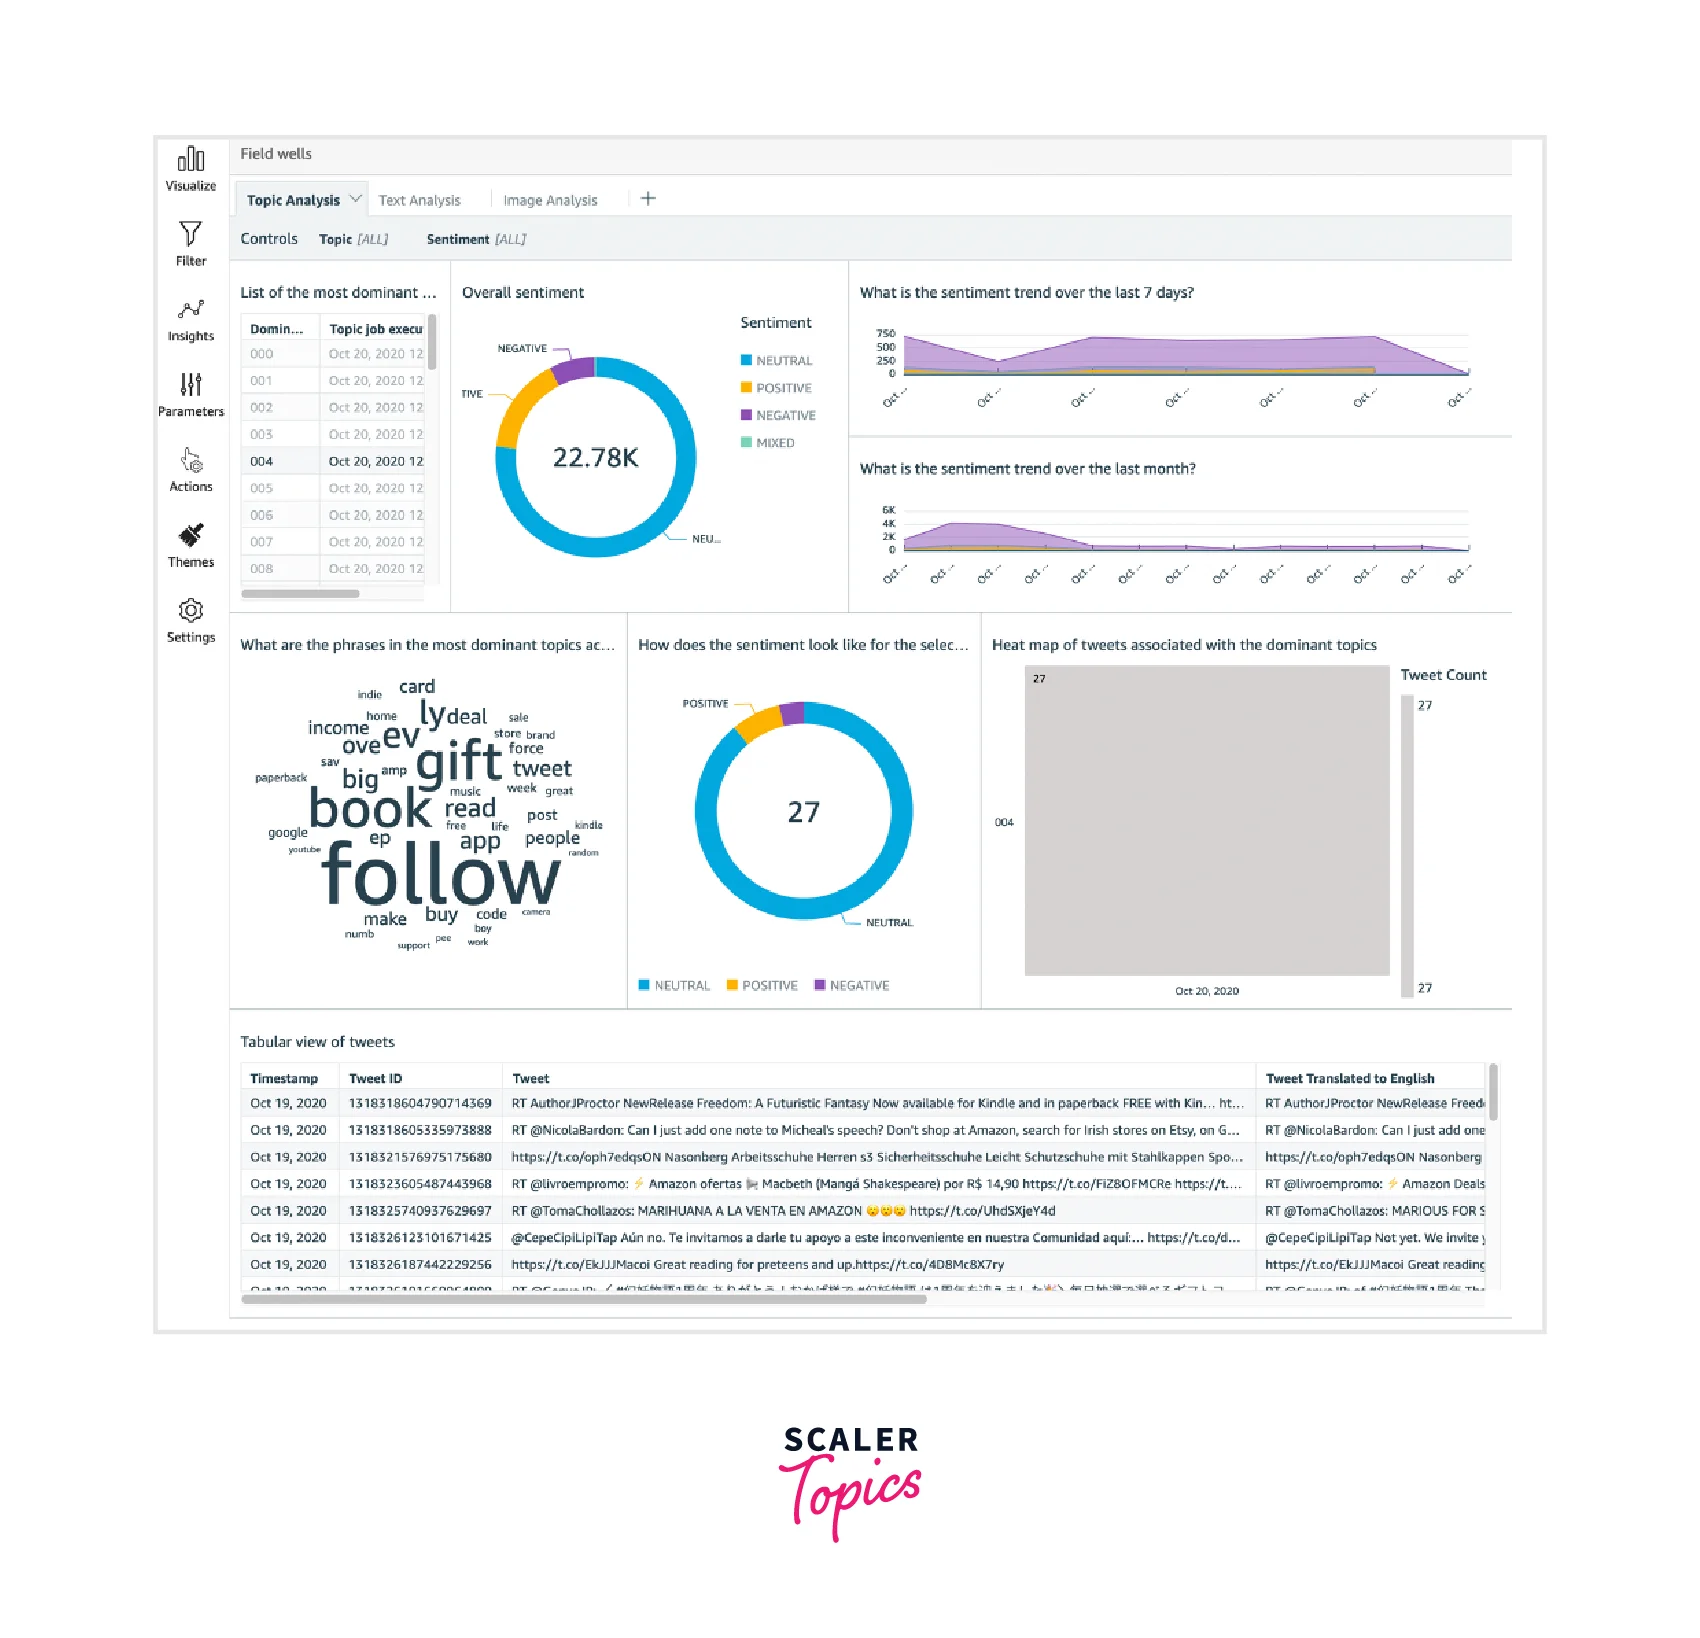
View and Analyze Tweets on a Topic
We can use Amazon Quicksight to analyze the sentiments of Trending tweets on a specific topic.
- Twitter is the source from which data is collected.
- Within the dashboard table you can select a specific topic which you want to analyze.
- The doughnut chart and heat map show the dominant topics on Twitter and related tweets.
Turn Learning into Career Growth
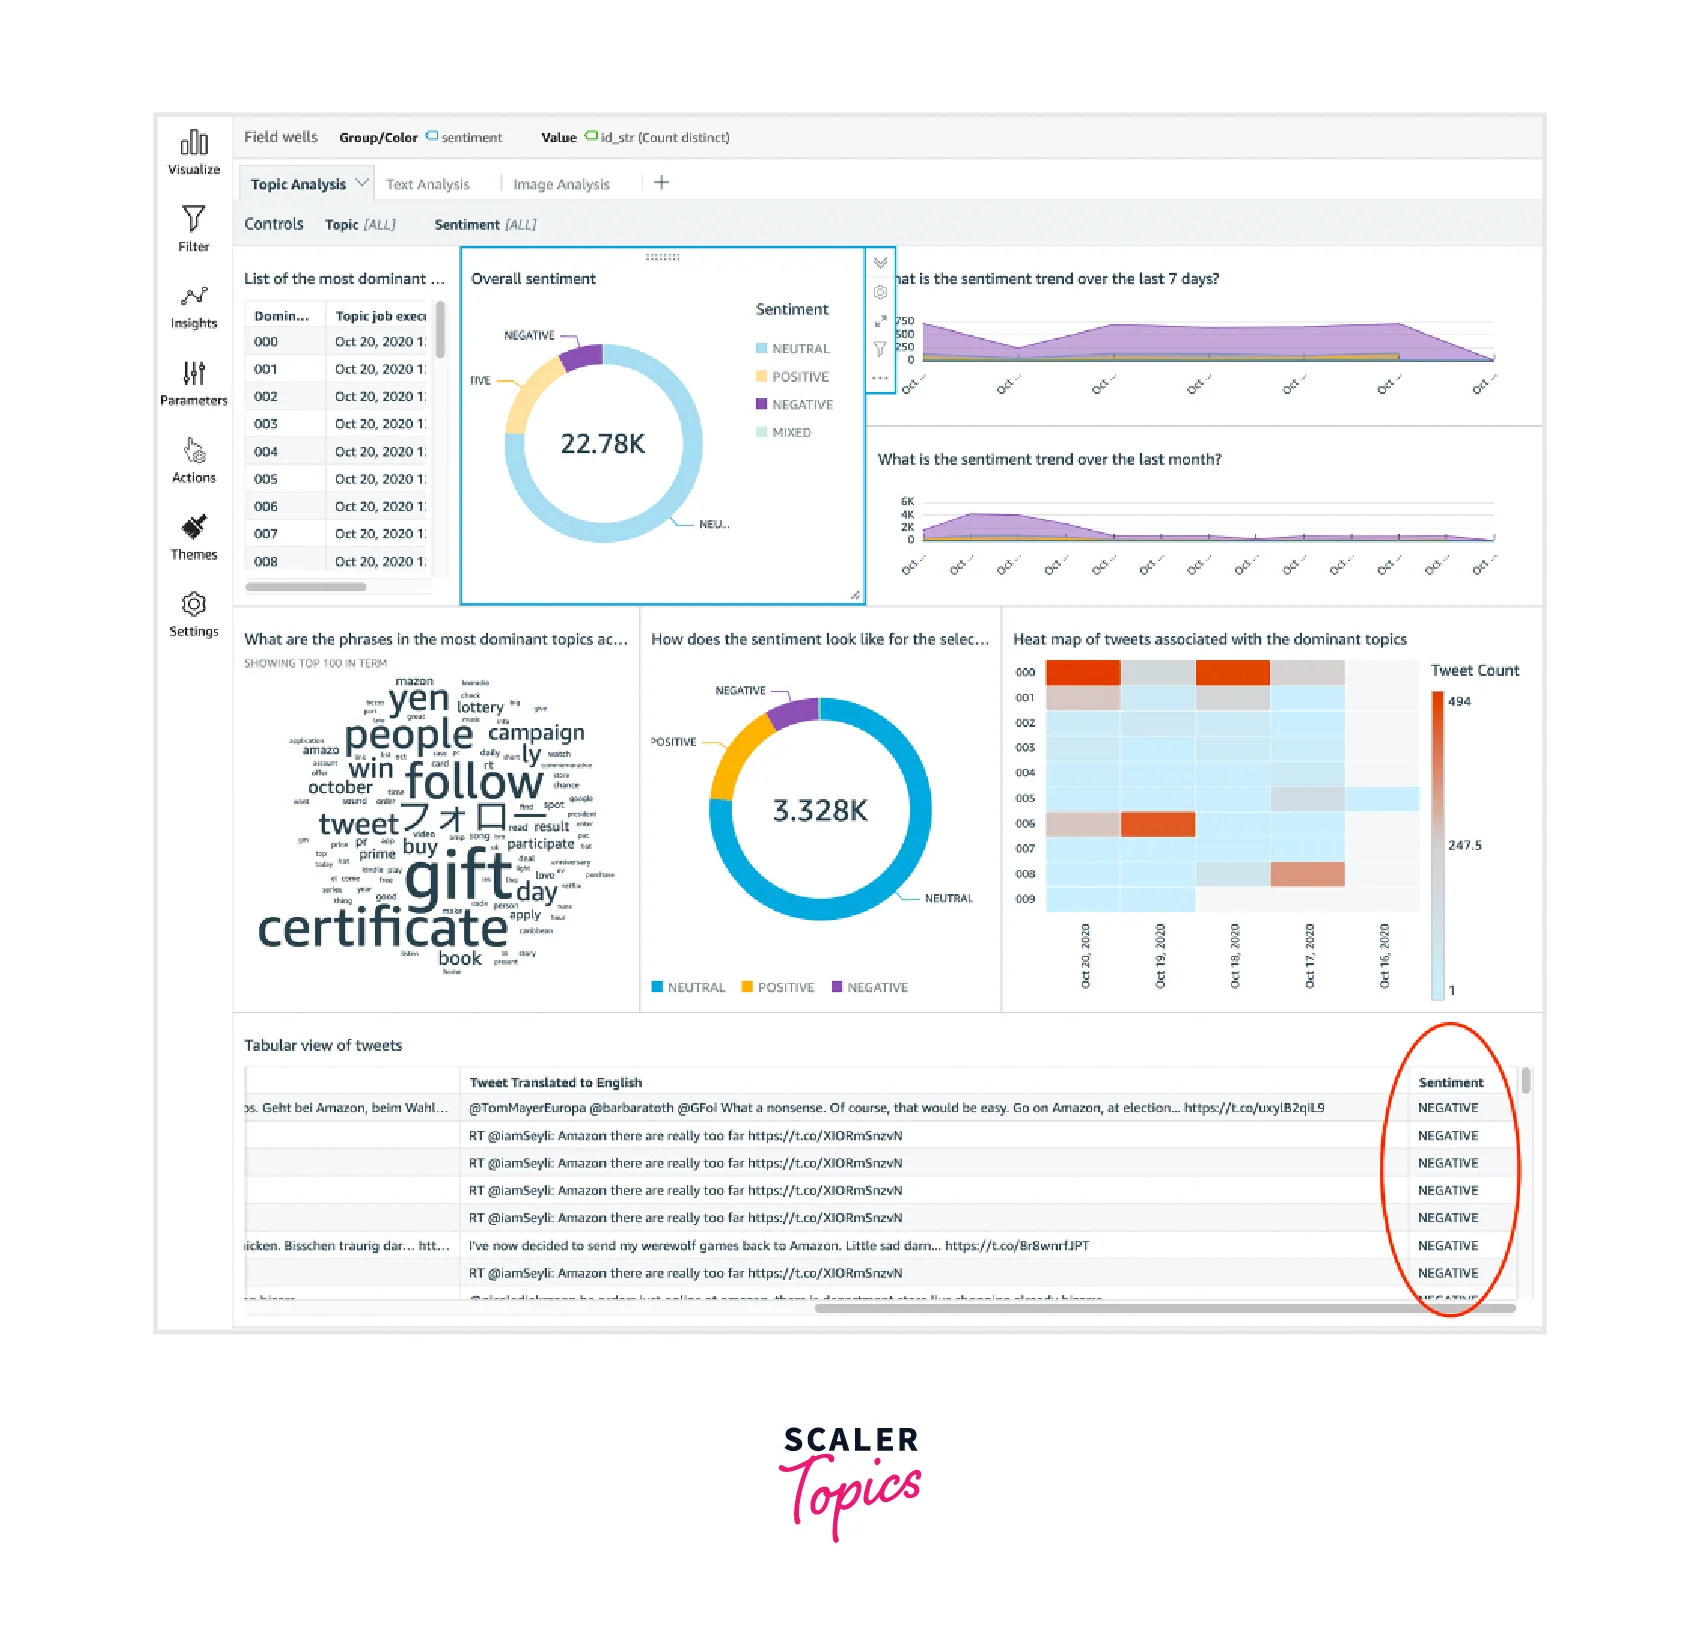
View Tweets with Negative Sentiments on Twitter
In this use case, we will use Amazon Quicksight to filter tweets which are having negative sentiments.
- Here also, we add Twitter as the source for collecting data.
- A dashboard is created by Amazon Quicksight. The dashboard has some tabs, select the Topic Analysis tab.
- Under the Topic Analysis tab you will get some options select Negative.
- You will see the third visual row gets updated and you get the desired result.
AWS QuickSight Pricing
The pricing of AWS Quicksight varies based on the edition:
Standard Edition
- For every user, $9 per month is charged if the annual plan is used.
- If you are paying monthly, then $12 is charged per user.
- Under these plans, 10 GB of SPICE capacity is provided for each user.
- If you want to increase SPICE capacity, then $0.25 is charged for each GB increase.
Scaler Placement Report and Statistics
Scaler learners achieved 2.5x salary growth with average post-Scaler CTC reaching ₹23L.
Enterprise Edition
Author:
- For every user, $18 per month is charged if the annual plan is used.
- If you are paying monthly, then $24 is charged per user.
Readers:
User Pricing
- Charges are applied every month.
- A fee of $0.30 is charged for each session up to a maximum of $5 per month.
Capacity Pricing
- Under this you can purchase reader sessions or Q questions in bulk.
- This structure is suitable for large-scale Business Intelligence deployments.
| Type | Capacity | Price |
|---|---|---|
| Monthly plan | 500/month | $250/month |
| Annual plan | 50,000/year | $20,000/year |
| Annual plan | 200,000/year | $57,600/year |
| Annual plan | 400,000/year | $96,000/year |
| Annual plan | 800,000/year | $162,000/year |
| Annual plan | 1,600,000/year | $258,000/year |
For capacity more than this, the business firm can contact the AWS support team directly.
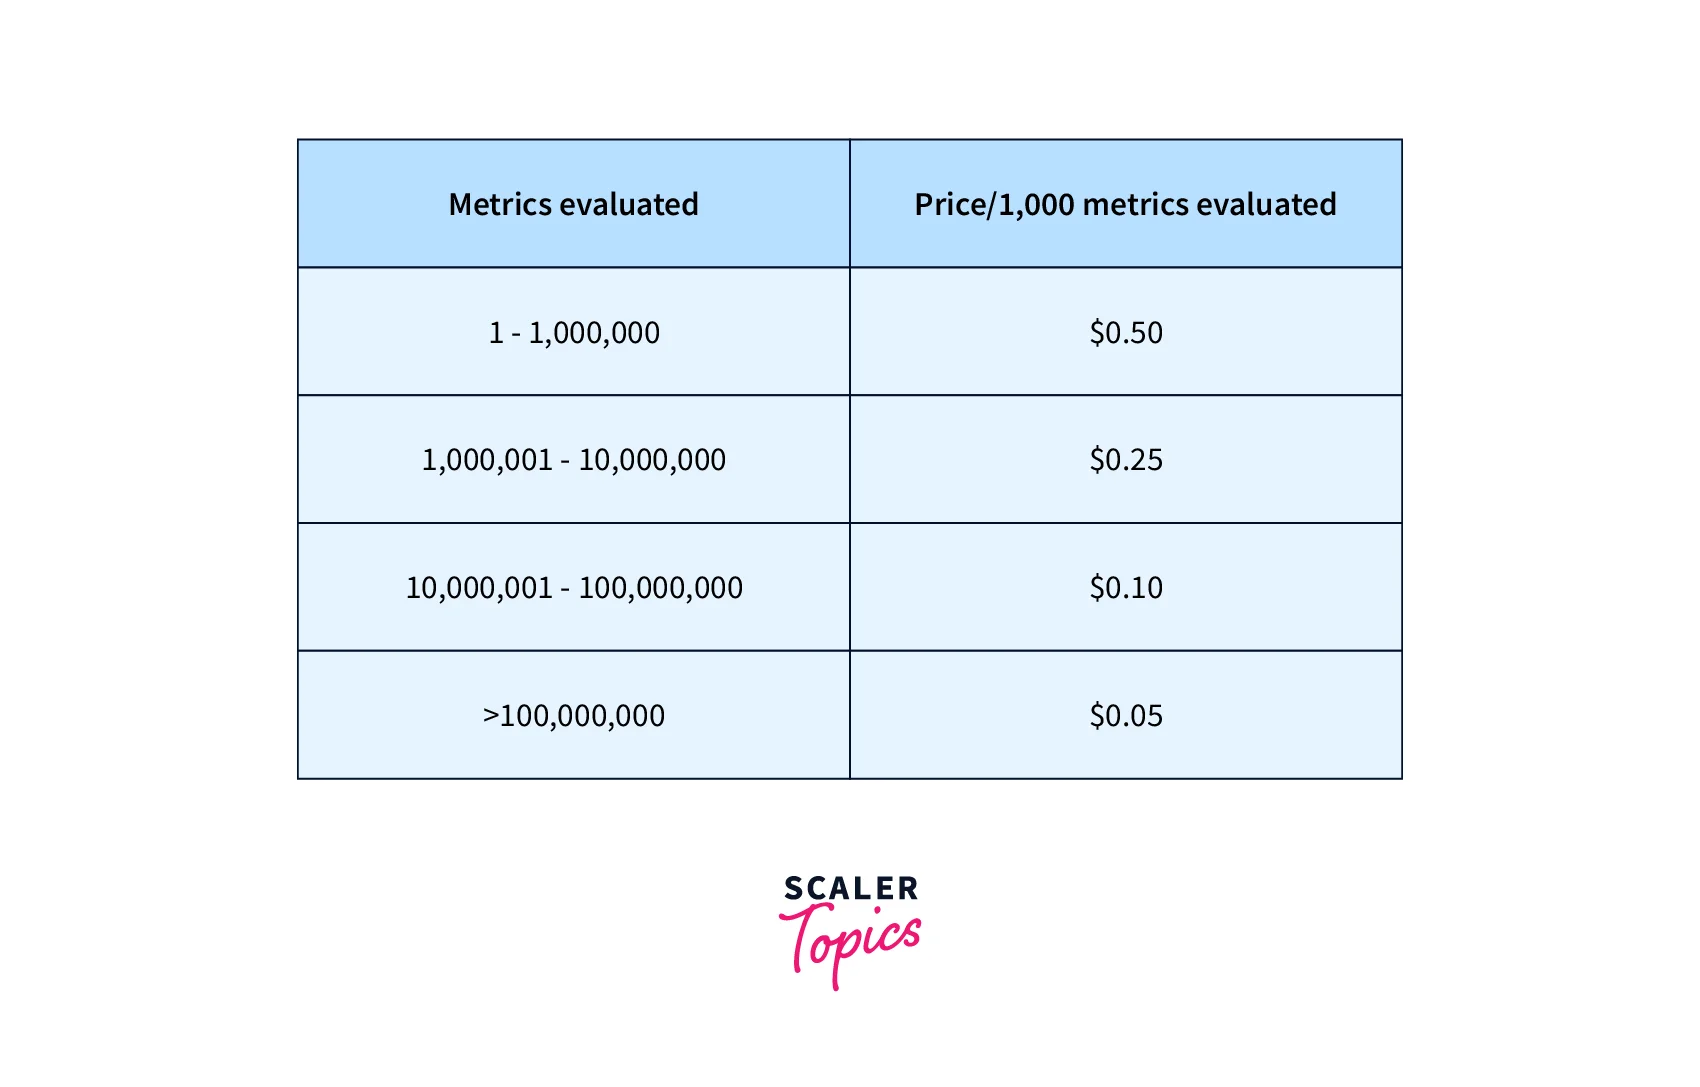
Alerts:
Extra charges are made for alerts and anomaly detection based on metrics. Metrics represent a value. The pricing corresponding to the metrics is shown in the image below.
SPICE:
SPICE engine is provided with a default storage of 10GB. This capacity can be increased or decreased at any time of the month. It costs $0.38 per GB each month.
Benefits and Limitations of AWS QuickSight
Benefits of AWS QuickSight
Amazon Quicksight has many advantages associated with its usage, some of which are discussed below:
1. Data Source Compatibility:
- Amazon Quicksight supports data in various formats and sources.
- The data files can be in CSV files, SaaS data sources, or other file sources.
- Files from relational data sources like Amazon Redshift and Amazon Athena are also supported.
- Other data sources are also supported by importing them with supported ones.
2. High-Performance SPICE Engine:
- SPICE engine is extremely fast, with high storage and processing capacity.
- Managing data using the SPICE engine is thus easier and results in high performance.
3. Portability:
- Amazon QuickSight can be accessed anytime and from anywhere.
- You can access it from any device, desktop, laptop, phone, tablet, etc., and any location by just using the authentication details.
4. Flexibility:
- It is a beginner-friendly and user-friendly tool.
- You do not need to understand behind the scene working on the data to create the visualization.
- You are simply provided with the dashboard where you can update the graphs or charts as per need with just a few clicks.
5. Interactive Visualizations:
- SPICE engines process tons of data at high speed, resulting in instant and accurate visualizations.
- Amazon QuickSight automatically shows a suitable graph, chart, or table depending on the fields selected.
6. Data Alerts:
- Amazon QuickSight provides data alert facilities.
- This allows us to check sudden increases or decreases in incoming data and monitor the health of our business.
7. Scalability:
- Amazon QuickSight can be scaled as per need to be used by thousands of users who can work simultaneously across the data sources.
- As AWS Quicksight uses the SPICE engine, the performance remains unaffected even after real-time parallel usage.
8. Low Cost:
- Amazon Quicksight provides the best services at of traditional business intelligence tools cost.
- It has proven to be pocket friendly based on the pay-per-session model.
- Amazon Quicksight charges you for the number of sessions used.
Limitations of AWS QuickSight
Listed below are a few limitations of Amazon QuickSight:
- Amazon Quicksight provides multiple features but is in its initial stage and still evolving.
- AWS Quicksight provides choices for visualizing data in various charts and graph forms, yet some important forms are missing, like Gantt charts, candlestick charts, and high and low close charts.
- It has yet to provide the feature for refreshing datasets stored in the SPICE engine.
AWS QuickSight VS Tableau
Tableau is an analysis platform. It is used for end-to-end data analysis.
Let's explore how AWS Quicksight is different from Tableau.
1. Cloud and On-premises
Amazon Quiskcsight is entirely cloud-based and does not provide on-premises service. It has many advanced cloud features which enhance its capabilities.
Tableau is an on-premises tool, it offers cloud-hosted solutions like Tableau Online and Tableau CRM, but all these cloud-hosted solutions rely on on-premises deployments.
2. Cost Effectiveness
Tableau is known for its expense. AWS Quicksight, on the other hand, offers similar features at a comparatively less price.
3. Popularity
When compared with Amazon Quicksight, Tableau is more popular in the community. Small-scale organizations mainly use Amazon Quicksight.
4. Ease of Use
Amazon Quicksight provides a beginner-friendly user interface.
Tableau provides a user-interactive platform. It is easy to learn to use Tableau. Amazon Quicksight has a learning curve. Although it's slightly hard to pick up, you can carry out the operations easily once you pick it up.
5. Integration
Amazon Quicksight can integrate with almost all the AWS services, directly and indirectly, and connect to all other services which can be integrated with AWS. Quicksight offers better integration capability when compared to Tableau.
Conclusion
- Amazon Quicksight is a Business Intelligence (BI) tool that is entirely cloud-based. It does not support on-premises setup.
- It can work with data and generate interactive dashboards and email reports based on the data gathered.
- Quicksight can integrate with other AWS or third-party services and tools to provide greater value.
- It uses the SPICE engine, which increases the storage and processing capacity and results in better performance.
- Small-scale businesses prefer Amazon Quicksight as it offers varied features at comparatively low costs.
- It provides numerous charts and graphs to choose from to create interactive dashboards.