Evaluation of IR in NLP
Overview
Retrieval effectiveness in NLP information retrieval methods is a measure of how well the documents retrieved by a system meet the needs of the users. The process of evaluating the effectiveness of the results under a given query made by the user is also called effectiveness evaluation of systems.
Introduction
Information Retrieval (IR) systems play an essential role in the modern information age where more and more data is available and freely accessible and distributed across different modes of communication. The exponential growth in freely available information means a greater and indispensable need to automate the process of information representation and retrieval.
We use Information Retrieval systems to take care of the information needs and narrow down the search process & there are many alternatives and models available in designing an IR system and naturally, questions arise as to:
- How do we know which of these techniques are effective in which applications?
- We will have to answer which methods work well in processing the data & designing the system - Should we use stop lists? Should we stem or lemmatize the text corpus? Should we use inverse document frequency weighting?
Hence the field of Information retrieval has developed as a highly empirical discipline requiring a careful and thorough evaluation to demonstrate the superior performance of novel techniques on the output of representative document collections.
What is the Goal of IR?
Information is organized into documents like web pages, books, journals, search engines, etc. Users have information needs or information gaps that need to be filled and they search the document collection or corpus in order to find the documents that fulfill this need.
From the point of view of the user, the main goal of information retrieval systems is to fulfill or partially match this information need and present with matching documents/items. In other words, the aim of IR systems is to provide the user with the best possible information from a database of data.
Ranked & Unranked IR
Let us look at metrics from the standpoint of ranking in the output and compare the differences.
UnRanked Evaluation Metrics in IR systems: UnRanked evaluation metrics considers that the set of relevant documents for a query is independent of the user and users' feedback.
- They are mainly used for evaluating the performance of machine learning classification problems and not a good measure for information retrieval systems.
- Even though not suitable, some unranked metrics like error rate, fallout, and miss rate are used in the field of speech recognition and information retrieval.
Ranked evaluation metrics in IR systems: In the multitude of information retrieval cases like search engines or recommender systems, the position of the resultant or recommended items in the list is important for the application of the retrieved information.
- For example, in a search engine or documentation retrieval environment or recommender system, all the artifacts are not of equal relevance to the users, and highly relevant documents or document components should be identified and ranked first for presentation.
- Therefore, the correctness of an item in the ranking list should be weighted by its position in the ranking rather than just by virtue of it being present or not present in the result set. Ranked metrics in information retrieval systems evaluation serve this purpose.
Some Evaluation Measures
The major approach to measuring the effectiveness of the information retrieval systems widely used in the unranked category are precision and recall.
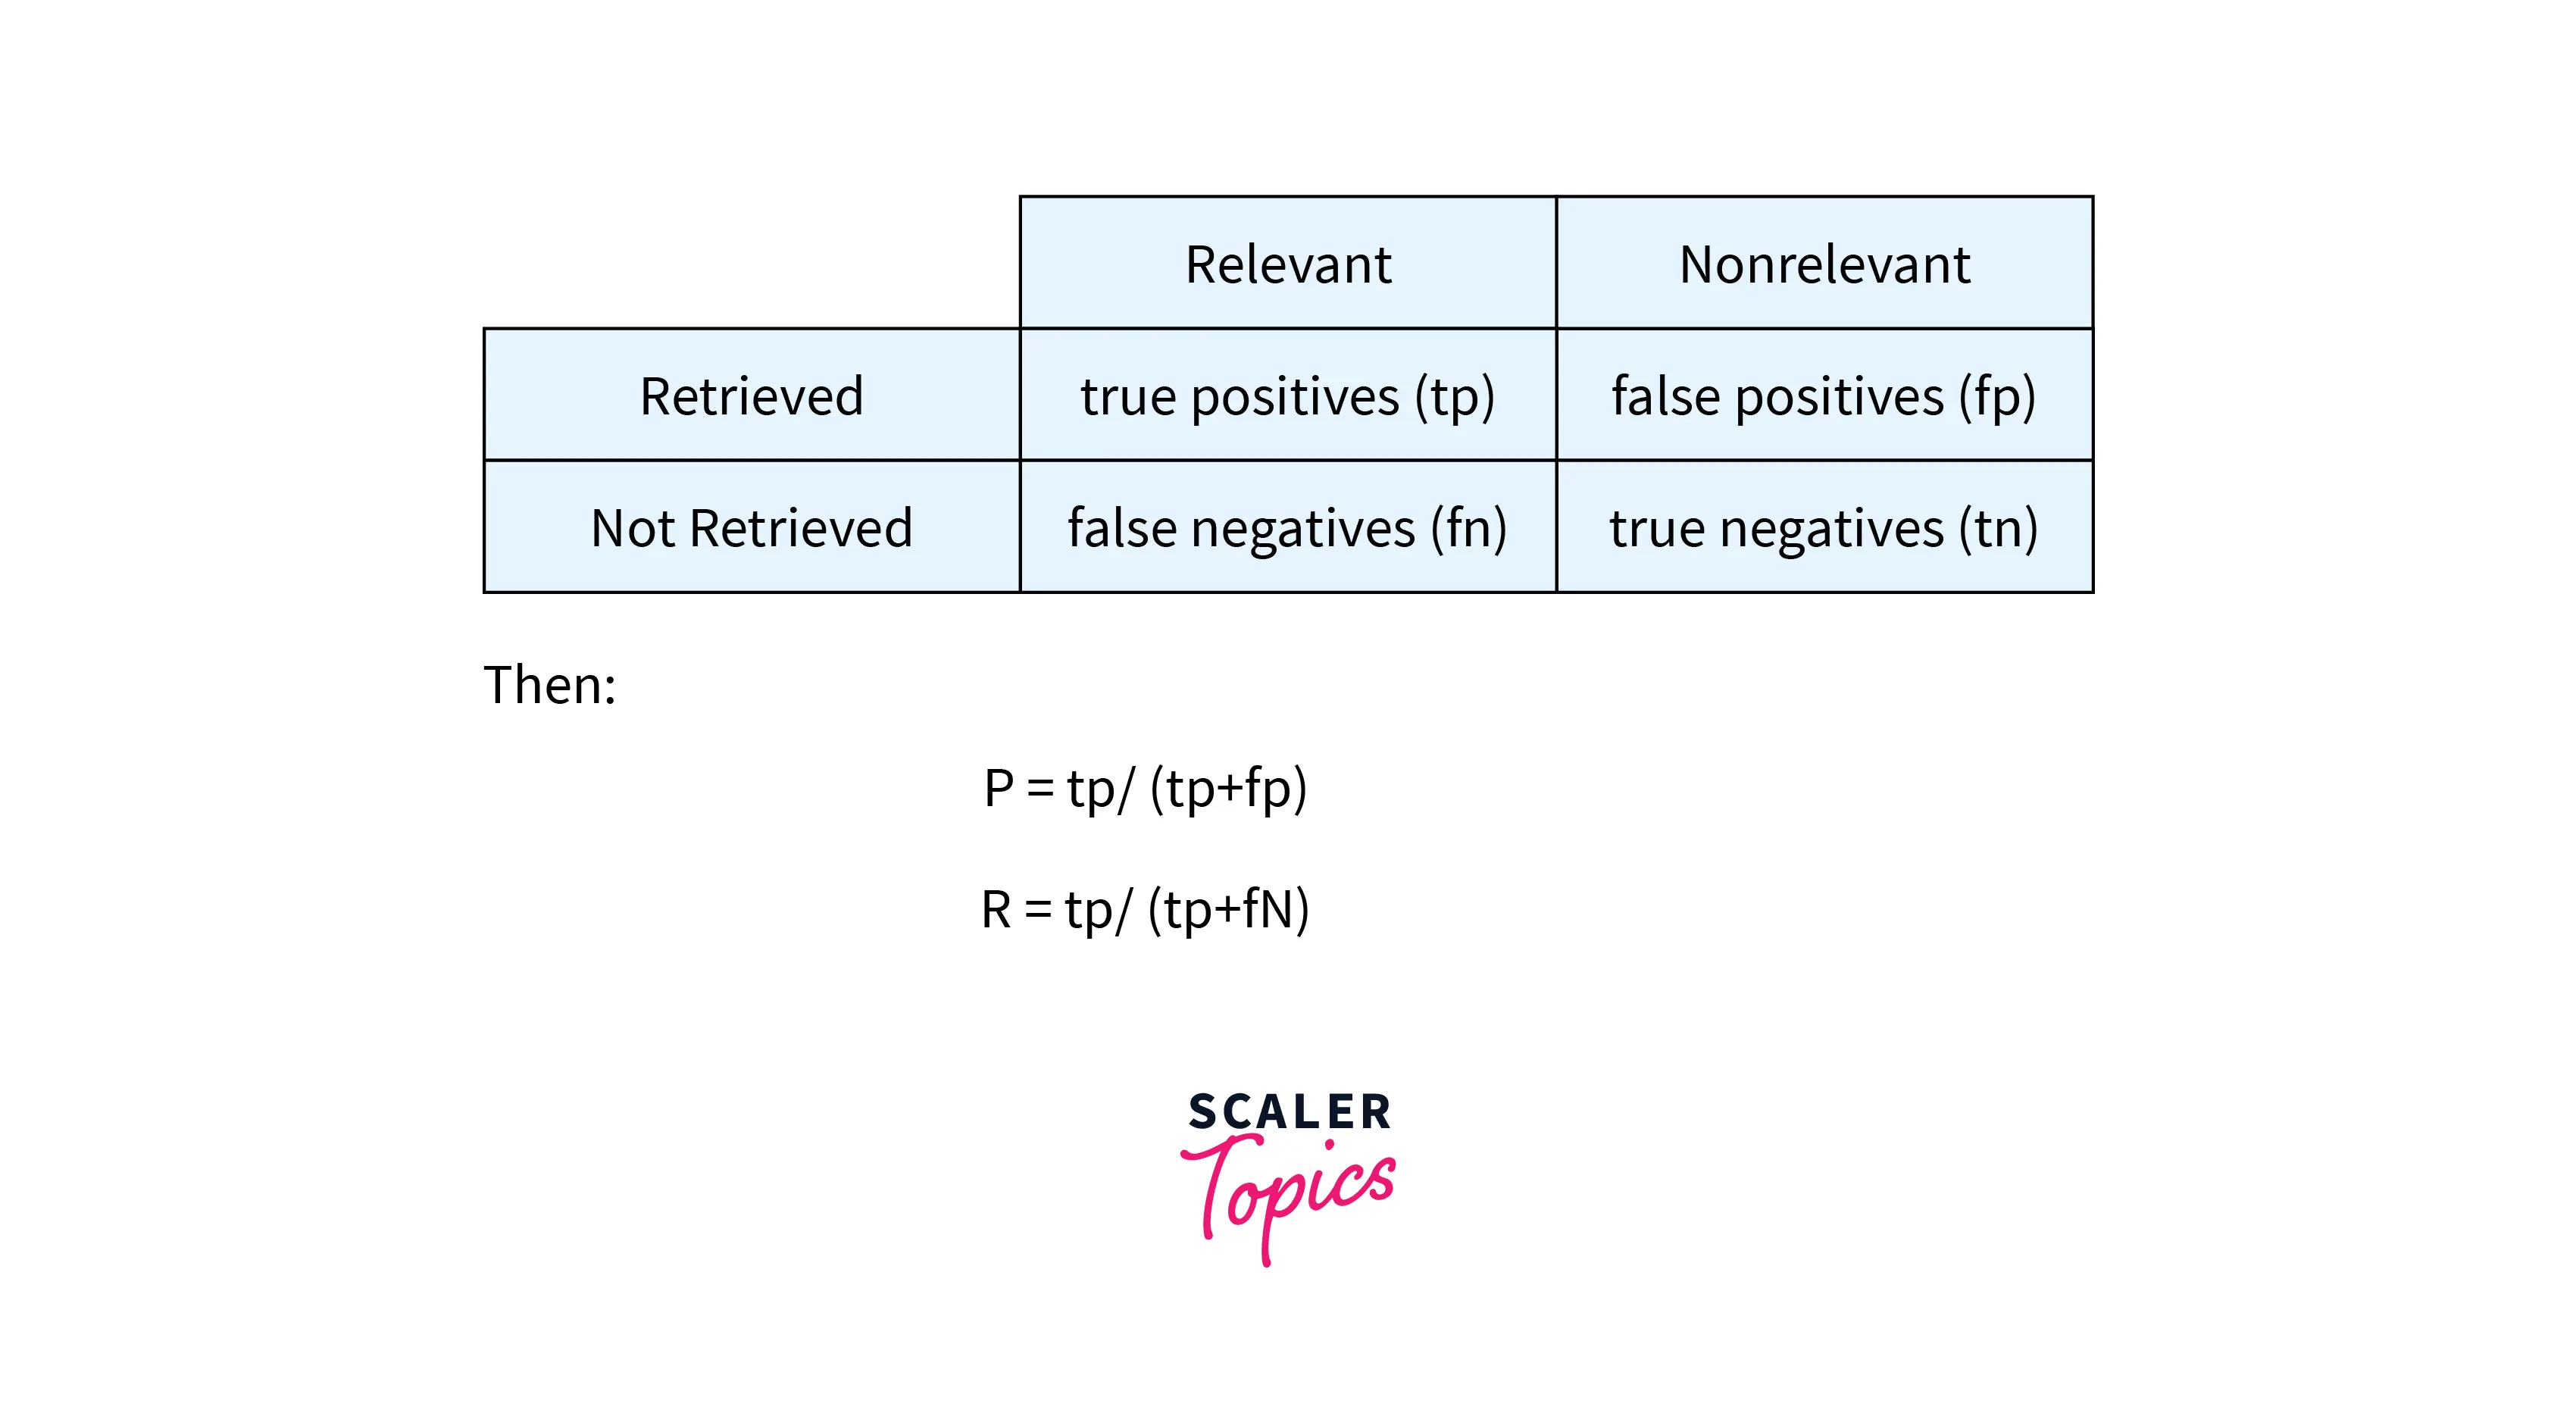
Model for evaluating metrics in IR system Suppose we consider an example of an information request I of a sample reference collection and its set R of relevant documents. We also assume that a given retrieval strategy that is being evaluated processes the information request I and generates a result of documented answer set A.
- Let |R| be the number of documents in this set.
- Denote |A| by the number of documents in the result set.
- Denote |Ra| be the number of documents in the intersection of the sets R and A.
Let us also define the different measures used in the construction of a confusion matrix with respect to relevant and non-relevant documents from output given by the IR system:
- True positive rate (also known as Sensitivity):
- True Negative rate (also known as Specificity):
- False positive rate :
- False negative rate :
Transform Your Career
Choose from our industry-leading programs designed for career success
Modern Software and AI Engineering Program
Master full-stack development with AI integration

Modern Data Science and ML with specialisation in AI
Advanced data science techniques with AI specialization
Advanced AIML with Specialisation in Agentic AI
Deep dive into AIML with focus on Agentic systems
DevOps, Cloud & AI Platform Engineering
Build and manage AI-powered cloud infrastructure
AI Engineering Advanced Certification by IIT-Roorkee
Premier AI engineering certification from IIT-Roorkee
Precision
Precision is a common parameter used to evaluate IR systems. Among all the retrieved documents, the number of documents that satisfy the user’s information need is called the precision of the system.
- Precision gives an estimate of how many samples have been wrongly identified among the retrieved documents.
- Mathematically it can be given as: Precision =
- We can also write precision in terms of confusion matrix formulation as Precision =
Recall
The recall is one of the other effectiveness measures of an IR system. It is the total number of closely related documents returned by the IR system when a user gives a query. Among all the relevant documents present in the corpus, the number of relevant documents system extracted from the corpus is called the recall.
- Recall gives an estimate of how many samples have been wrongly identified as belonging to relevant documents.
- Mathematically it can be defined as Recall =
- We can also write precision in terms of confusion matrix formulation as Recall =

What is the trade-off between Precision and Recall in IR systems?
-
If the system returns the documents even if they have very low relevance to the query statement but contain some query words, then the Recall value of the system increases but the precision decreases because of a lot of junk documents.
-
When the precision is very high during which the system returns the documents having very high relevance with the query statement, then in this case there are possibilities that the information retrieval system may skip some documents that may be useful for the user resulting in a decrease in Recall.
-
Precision as a metric in IR systems optimize the ability of how good we are in retrieving relevant items (already good rated) but too bigger a precision lowers the ability to give unique and new results each time (false positives).
-
Optimising for recall makes sense when the number of relevant items is less than retrieved items.
-
Measures of precision and recall concentrate the evaluation on the return of true positives, asking what percentage of the relevant documents have been found and how many false positives have also been returned.
F1-score
There are two main goals when designing an effective information retrieval system:
- They must retrieve the largest possible number of relevant documents (they should have a high recall) and
- They also must retrieve a very small number of irrelevant (that is high precision) documents.
- Unfortunately, it has been established that precision and recall are inversely related showing that - obtaining higher levels of precision can only be obtained through lower recall values.
- Due to this, in most modern evaluating systems, the F1 factor is used as a measure of combining both precision and recall into a single number.
F-score also called F-measure considers both the precision and recall for measuring the effectiveness of the information system by simply calculating the harmonic mean of recall and precision.
- Mathematically it can be defined as F1-score =
Accuracy
One of the easy and obvious alternatives to judging an information retrieval system is by its accuracy defined as the fraction of its classifications that are correct.
- As there are two actual classes relevant and non-relevant for our information retrieval system, we can think of the output as a two-class classifier which attempts to label them as such that it retrieves the subset of documents that it believes to be relevant.
- Mathematically accuracy score can be defined as Accuracy Score =
Why is accuracy not an appropriate measure for information retrieval problems?
- The data is extremely skewed with typically over 99.9% of the documents in the non-relevant category in almost all cases and a system tuned to maximize accuracy can appear to perform well by simply deeming all documents non-relevant to all queries.
- Although the system may look quite good on the surface, trying to label some documents as relevant will almost always lead to a high rate of false positives.
- However, labeling all documents as non-relevant is completely unsatisfying to an information retrieval system user as users are always going to want to see some documents and can be assumed to have a certain tolerance for seeing some false positives providing that they get some useful information.
Disadvantages of the Above Methods
- Accuracy is a better and effectiveness measure often used for evaluating machine learning classification problems but fails badly when there is skew in data
- We need to optimize both precision and recall together which is difficult to achieve simultaneously depending on the use case, which part is solved by combination metrics like F1-score but it has drawbacks of any metric which is a non-ranked metric.
- Unranked evaluation metrics in general like precision and recall, F1-score need a labeled data set with a single outcome per sample and does not work with a list of items in output.
- The items are either simply classified as good or bad and there is no notion of order or position of the result.
Some More Evaluation Metrics
Let us discuss a set of metrics that takes the relative position of result or user feedback into consideration while metric computation.
Turn Learning into Career Growth
Recall-Precision Graph
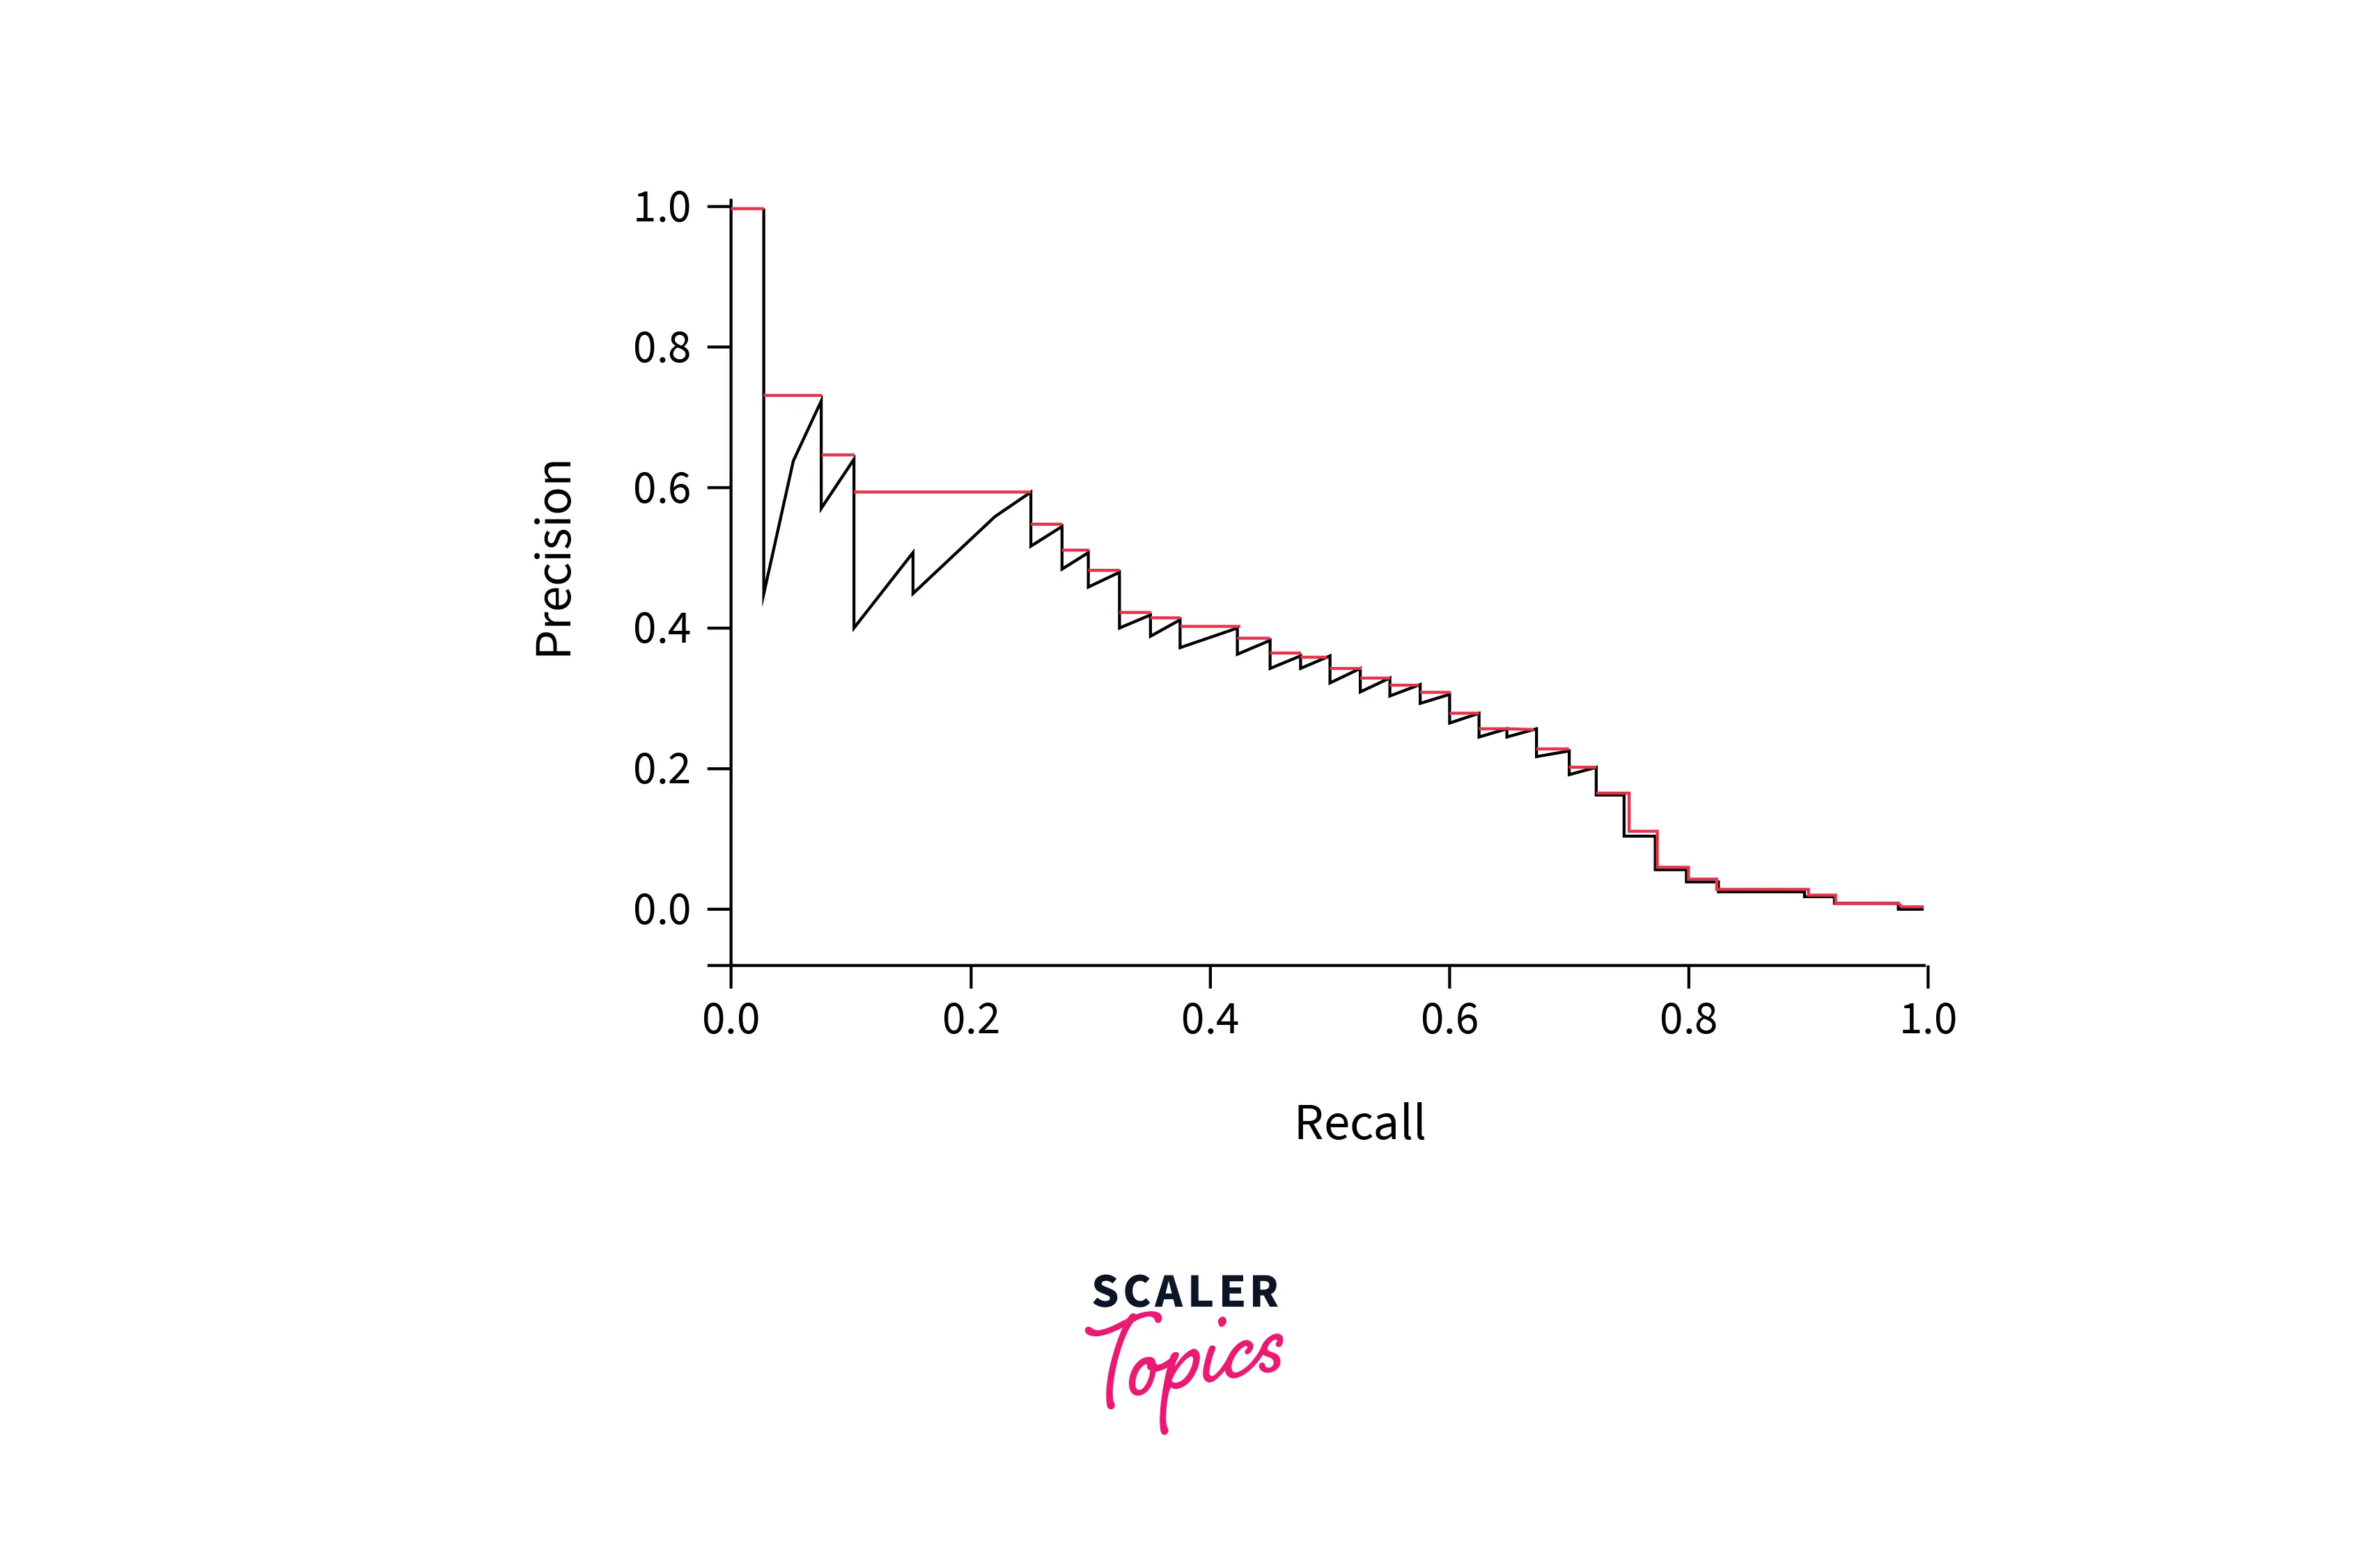
- Precision, recall, and the F-score measure are set-based measures basically computed using unordered sets of documents. We need to extend these measures to be able to evaluate the ranked retrieval results scenario that is now standard with most information retrieval systems.
- We get appropriate sets of retrieved documents naturally given by the top k retrieved documents in ranked retrieval scenarios. For each such set with different values of k, we compute the precision and recall values and plot a graph between precision and recall to get a precision-recall curve.
Interpretation of Precision-Recall graph:
- Precision-recall curves have a **distinctive saw-tooth **shape.
- If the k+1th document retrieved is non-relevant then recall is the same as for the top k documents but the value of precision will be dropped.
- If the document is relevant then both precision and recall increase and the curve jags up and to the right.
Interpolated Precision-Recall Graph
As we have seen some jags in the precision-recall graph, it is often useful to remove these jiggles and the standard way to do this is with an interpolated precision.
The interpolated precision at a certain recall level r is defined as the highest precision found for any recall level r' >= r:
- Mathematically interpolated precision is defined as:
- The justification for the interpolated precision-recall curve is that almost anyone would be prepared to look at a few more documents if it would increase the percentage of the viewed set that was relevant when the precision of the larger set is higher.
Precision at K
Need for Precision at K metric: In many information retrieval systems, the main consideration for the user regarding the quality of output is many good results there are on the first page or the first few (like three) pages. This leads to measuring precision at fixed low levels of retrieved results, such as 10 or 30 documents.
Precision at k metric: It is the proportion of documents/items in the top-k set that are relevant.
- Mathematically it can be defined as Precision@k = (# of recommended items @k that are relevant) / (# of recommended items @k)
- Ex: If precision at 10 in a top-10 recommendation problem is 80% - 80% of the recommendation I make are relevant to the user.
- Precision at k has the advantage of not requiring any estimate of the size of the set of relevant documents.
- The disadvantages with the metric are that it is the least stable of the commonly used evaluation measures and that it does not average well since the total number of relevant documents for a query has a strong influence on precision at k.
Recall at K
Recall at k is another commonly used metric like precision at K which gives the proportion of relevant items found in the top-k documents.
- Mathematically it can be defined as Recall@k = (# of recommended items @k that are relevant) / (total # of relevant items)
- Ex: If recall at 10 is 40% in our top-10 recommendation system. This means that 40% of the total number of relevant items appear in the top-k results.
R-Precision
R-precision is defined as the proportion of the top-R retrieved documents that are relevant where R is the number of relevant documents for the current query. Rank cutoff R is the point at which precision and recall are equal since at that point both are r/R.
- R-precision alleviates the problems of Precision at K by simply calculating the precision of the top documents returned from the set of known relevant documents .
- R-precision also adjusts for the size of the set of relevant documents.
- A perfect system could score one on this metric for each query whereas even a perfect system could only achieve a precision at 20 of 0.4 practically if there were only eight documents in the collection relevant to an information need.
- Averaging this measure across queries thus makes more sense.
- Like Precision at , R-precision describes only one point on the precision-recall curve rather than attempting to summarize effectiveness across the curve.
- R-precision turns out to be highly correlated with another important precision metric MAP empirically despite measuring only a single point on the curve.
Mean Average Precision (MAP)
Out of the many measures that have become commonly used in evaluating IR systems in recent years, Mean Average Precision (MAP) has become the most standard and it provides a single figure measure of quality across recall levels.
- MAP also has been shown to have especially good discrimination and stability among many evaluation measures.
- Average Precision is the average of the precision values obtained for the set of top k documents existing after each relevant document is retrieved from a single information need perspective.
- The precision metrics computed at different levels of k are then averaged out to get the metric over multiple information needs.
- Mathematically mean average precision is defined as:
- qj ∈ Q is a set of relevant documents for an information need: {d1,...dmj}
- Rjk is the set of ranked retrieval results from the top result until you get to document dk
- When a relevant document is not retrieved at all from the output, the precision value in the MAP equation is taken to be 0.
- For a single information need, the average precision approximates the area under the uninterpolated precision-recall curve, and MAP is roughly the average area under the precision-recall curve for a set of queries.
Scaler Placement Report and Statistics
Scaler learners achieved 2.5x salary growth with average post-Scaler CTC reaching ₹23L.
ROC
A ROC (ROC stands for Receiver Operating Characteristics) is a curve that plots the relationship between the True Positive Rate or sensitivity against and the False Positive Rate or (also 1 − specificity) and gives an idea of how one changes with other.
- Sensitivity is also just another term for recall and False Positive Rate (FPR) is given by FP/(FP+TN)
- For unranked result sets, specificity (given by TN/(FP+TN) ) is generally not seen as a very useful notion because the set of true negatives is always so large, its value would be almost 1 for all information needs and correspondingly the value of the false positive rate would be almost 0. Hence we plot the ROC curve.
- But instead, the ROC curves in most cases make sense when looking over the full retrieval spectrum of the output and it provides another way of looking at the data.
- An ROC curve always goes from the bottom left to the top right of the graph. For a good system, the graph climbs steeply on the left side.
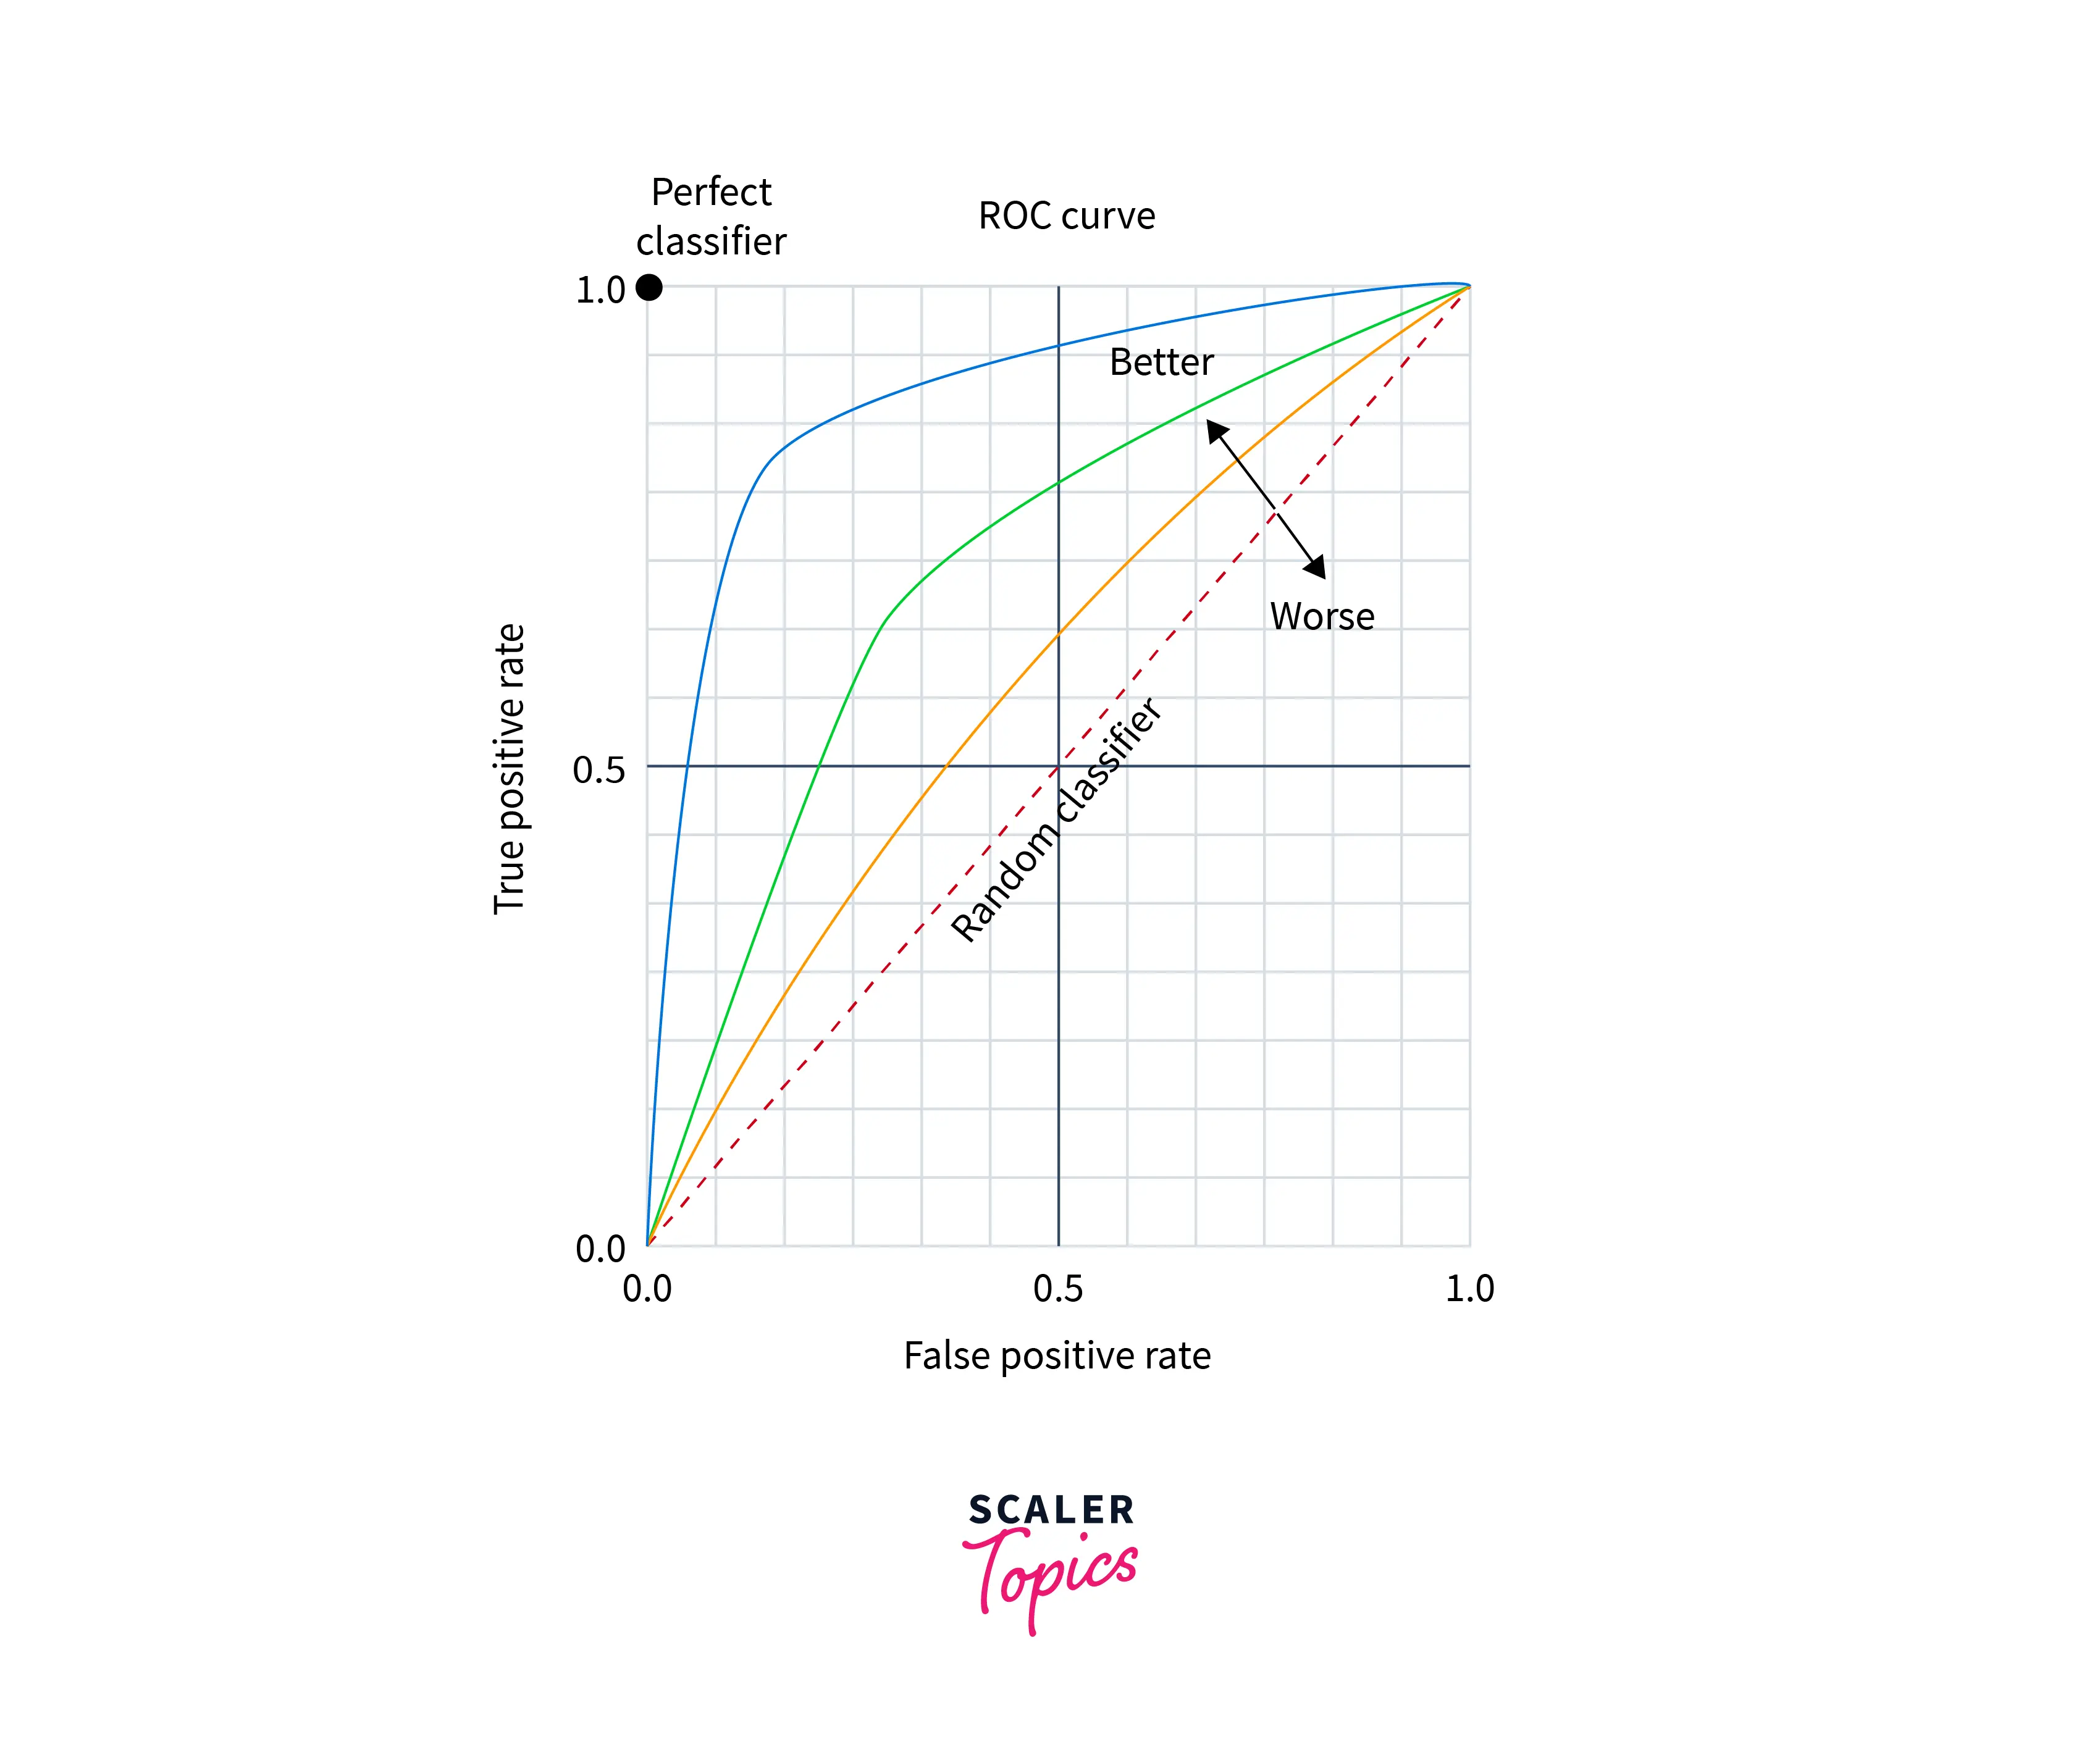
AUC (Area under Curve): In many problems under information retrieval, a common aggregate measure is to report the area under the ROC curve called AUC which is the ROC analog of MAP.
- Area Under Curve (AUC) can be used to evaluate the performance of the system based on the ROC curve. As the name suggests it is the area that the curve covers and ideally we would want that the AUC be as close to 1 as possible and be inclined towards the top-left corner of the ROC curve.
- As a baseline, a model with a ROC curve of X=Y line giving an AUC of 0.5 is the curve of a random model.
Choosing the ideal values of precision and recall from the ROC curve
- Let's say we get a Precision of 0.6 from the model (for a given cutoff). Then the Recall is roughly around 0.1. If we aim for a high recall let's say around 0.8, then precision is ~ 0.2.
- So if one increases (among precision and recall) the other decreases.
- Ideal values of Precision and Recall can only be achieved if we find a good balance between both.
- Need to have good balance between precision and recall and instead only use Precision: We would want a model that makes least number of wrong predictions which include False positives and False negatives.
- So, we optimize the models such that we would want both precision and recall metrics to be considerably high.
- The ideal cutoff can be found by simply plotting the ROC curve and by printing the coordinates of the points in the precision v/s recall curve based on one of the methods typically followed in literature.
- One approach is to take the point closest to (0,1), the corner point in the ROC plane which defines the optimal cut-point as the point minimizing the Euclidean distance between the ROC curve and the corner (0,1) point.
- One other approach is to define the optimal cut-point as the point maximizing the product of sensitivity and specificity.
- One other approach defines the optimal cut-point as the point maximizing the Youden function which is the difference between true positive rate and false positive rate over all possible cut-point values.
Normalized Discounted Cumulative Graph
A final approach that has seen increasing adoption, especially when employed with machine learning approaches to the ranking is measures of cumulative gain and its normalized versions normalized discounted cumulative gain (NDCG).
NDCG is based on the idea that the highly relevant documents are more useful than moderately relevant documents which are in turn more useful than irrelevant documents.
- Mathematically NDCG is defined as:
- NDCG is designed for situations of non-binary notions of relevance. NDCG is evaluated over some number k of top search results like precision at k.
- For a set of queries Q, let R(j, d) be the relevance score assessors given to document d for query j.
- Zkj is a normalization factor calculated to make it so that a perfect ranking’s NDCG at k for query j is 1. For queries for which k′ < k documents are retrieved, the last summation is done up to k′.
Limitations of Normalized Discounted Cumulative Gain (NDCG)
- NDCG metrics do not penalize the bad documents outputs. For Example, [3] and [3, 0, 0] have the same NDCG but in the second out there are two irrelevant documents.
- NDCG does not handle any missing relevant document in the output as there is no specific standard defined for the number of output documents.
- For example, two outputs [3, 3, 3] and [3, 3, 3, 3] of similar input are considered equally good. For output-1 the DCG3 is calculated but for output-2 the DCG4 is calculated.
- Normalized DCG may not be suitable to measure the performance of queries that may often have several equally good results.
Conclusion
- The process of evaluating the effectiveness of the results under a given query process is called effectiveness evaluation.
- The central goal of information retrieval systems is to fulfill or partially match this information need and present it with matching documents/items.
- UnRanked evaluation metrics do not consider user feedback while ranked ones take the position of an item in the ranking to compute metrics.
- The major approach to measuring the effectiveness of the information retrieval systems widely used in the unranked category are precision and recall.
- Precision is defined as the number of documents satisfying the user’s information among all the retrieved documents & Recall is the number of relevant documents system extracted among all the relevant documents.
- The F-score considers both the precision and recall for evaluation and is computed as the harmonic mean of recall and precision.