Confidence Intervals in Inferential Statistics

Overview
Statistics is one of the most essential skills required to build a career as a Data Scientist. Statistics is a branch of mathematics discipline that is related to the collection, analysis, interpretation, and presentation of data. It utilizes various mathematical models and methods to derive valuable insights and predict the future from data. The field of statistics can be divided into two major categories - Descriptive and Inferential Statistics. Descriptive statistics are used for summarizing and describing the characteristics of sampled data without generating any inferences about the larger population. Inferential statistics analyze sample data to make inferences about a larger population.
Pre-Requisites
To get into the field of Inferential Statistics, you should have a good understanding of the concepts mentioned below -
- Familiarity with Probability and basic understanding of Probability Distributions in Data Science.
- Familiarity with Descriptive Statistics.
What is Inferential Statistics?
- Inferential statisticsis a field in the statistics discipline that utilizes various mathematical models and methods on sample data to make inferences or predictions about a larger population. This process of inferring insights from sample data is called Inferential Statistics.
- The goal of inferential statistics is to use the sample data to extract insights and conclusions about the population that the sample represents. To do this, inferential statistics uses various techniques, such as hypothesis testing, regression analysis, analysis of variance (ANOVA), etc.
- One of the key concepts in inferential statistics is statistical significance. This refers to the probability that the results of a study occurred by chance or it was due to the true effect on the population.
- Let’s understand inferential statistics with an example. Suppose a Data Scientist is interested in understanding the relationship between education level and income. The Data Scientist can collect education and income data for a random sample of the larger population. Further, she can utilize inferential statistics to analyze the data and test whether the relationship between education level and income is statistically significant.
Transform Your Career
Choose from our industry-leading programs designed for career success
Modern Software and AI Engineering Program
Master full-stack development with AI integration

Modern Data Science and ML with specialisation in AI
Advanced data science techniques with AI specialization
Advanced AIML with Specialisation in Agentic AI
Deep dive into AIML with focus on Agentic systems
DevOps, Cloud & AI Platform Engineering
Build and manage AI-powered cloud infrastructure
AI Engineering Advanced Certification by IIT-Roorkee
Premier AI engineering certification from IIT-Roorkee
Why Do We Need Inferential Statistics?
Let’s review a few of the benefits of using Inferential Statistics -
- Inferential Statistics can help conclude a small sample about the larger population.
- It can help test whether results from collected samples are statistically significant to the larger population or not.
- Inferential Statistics can compare two models to find which one is more statistically significant.
- Inferential Statistics can help determine whether to add or remove a variable to improve the model's accuracy during feature selection.
Statistical Terminologies
This article will use the terminologies below to explain various concepts related to Inferential Statistics.
- Population - It is a set of similar items or events which is of interest to the underlying question or experiment.
- Sample - It is a smaller number of observations drawn from a population.
- Statistic - It is a Single measure of some feature/attribute of a sample data, For example, the mean or median value of income collected for a sampled population.
- Population Statistic - It is a summary measure of a characteristic of a population. For example, the mean income of a population is a population statistic.
- Sample Statistic - It is a summary measure of a characteristic of a sample drawn from the population. For example, the mean of income collected for all individuals in the sample population.
- Standard Deviation - It explains the variability in the data. It is denoted by σ.
- Standard Error - It measures the amount of error or uncertainty in a sample statistic. It is denoted as σ/√n, where n is the sample size.
Confidence Intervals & Point Estimates
Sampling Distribution
- A sampling distribution can be defined as the distribution of a sample statistic (mean, median, mode, etc.) for a large number of samples drawn from the same population.
- For example, let’s say we are interested in the mean income of a population. We could draw a large number of samples from the population and compute the mean income of each sample. The resulting distribution of these sample means would represent the sampling distribution of the mean income.
- Sampling Distribution can help in the estimation of population statistics. Let’s understand in the subsequent section how it can be done.
Turn Learning into Career Growth
Central Limit Theorem
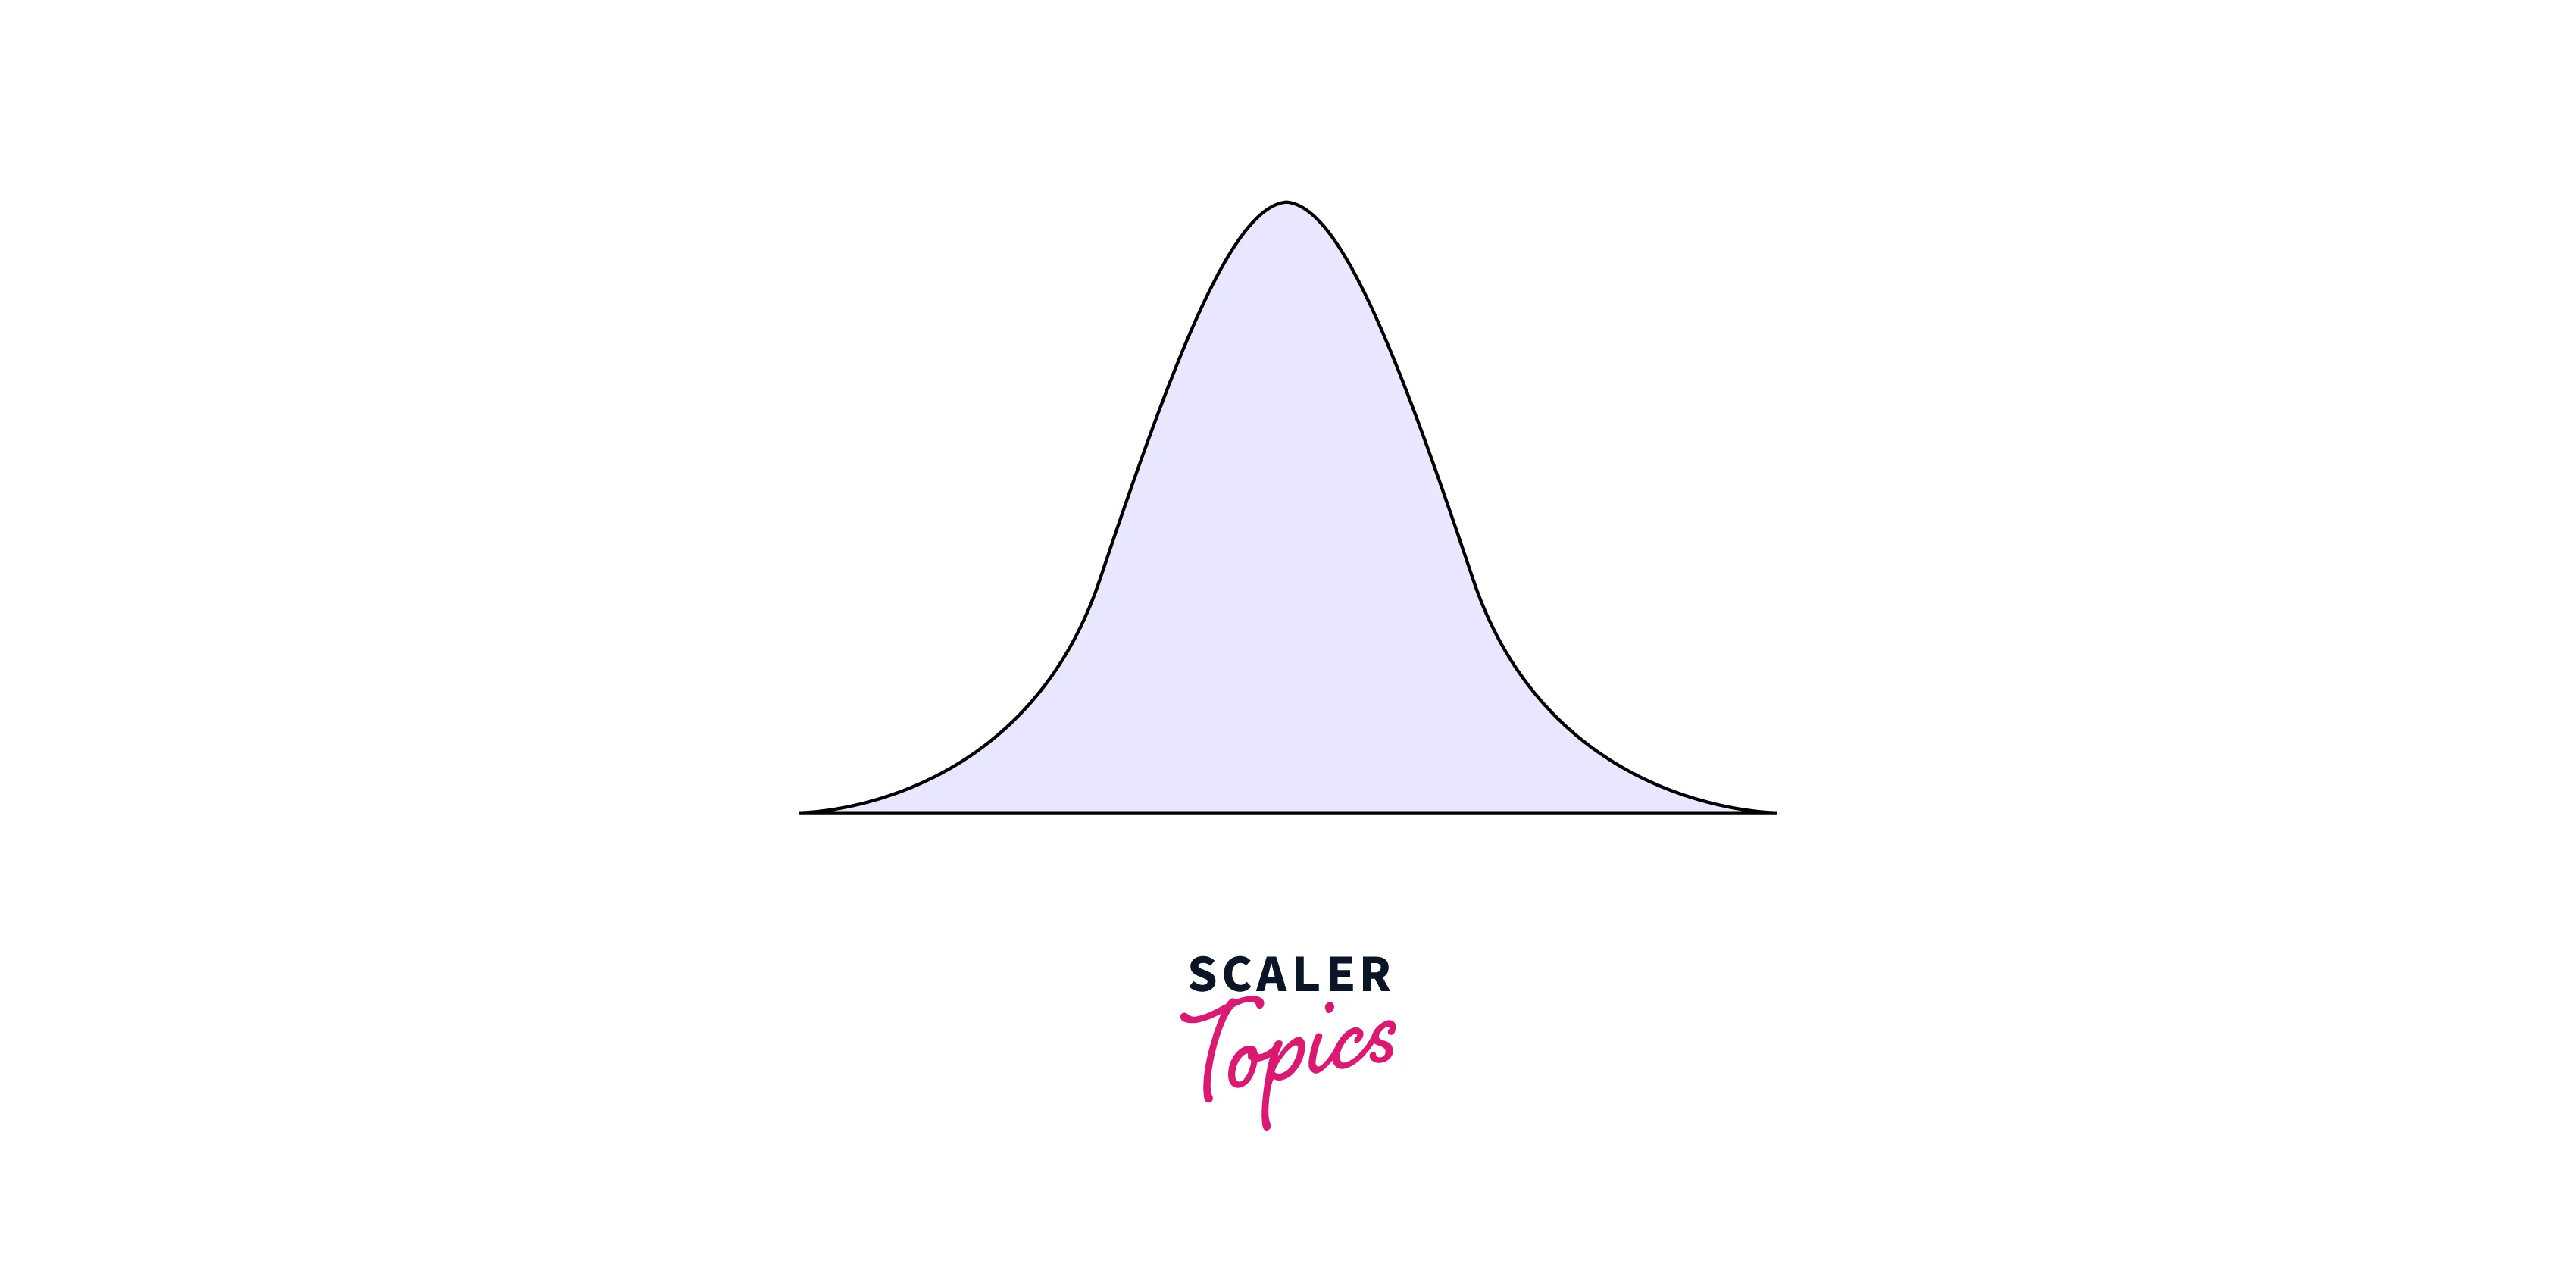
- The Central Limit Theorem (CLT) states that, given a large number of samples, the sampling distribution of the sample mean (sample statistic) will become a normal distribution, irrespective of the shape of the underlying population distribution. This holds as long as the samples are drawn randomly from the larger population.
- For example, if you plot the mean income for each sample drawn from the population, it should look like a normal distribution, as shown in the below figure.
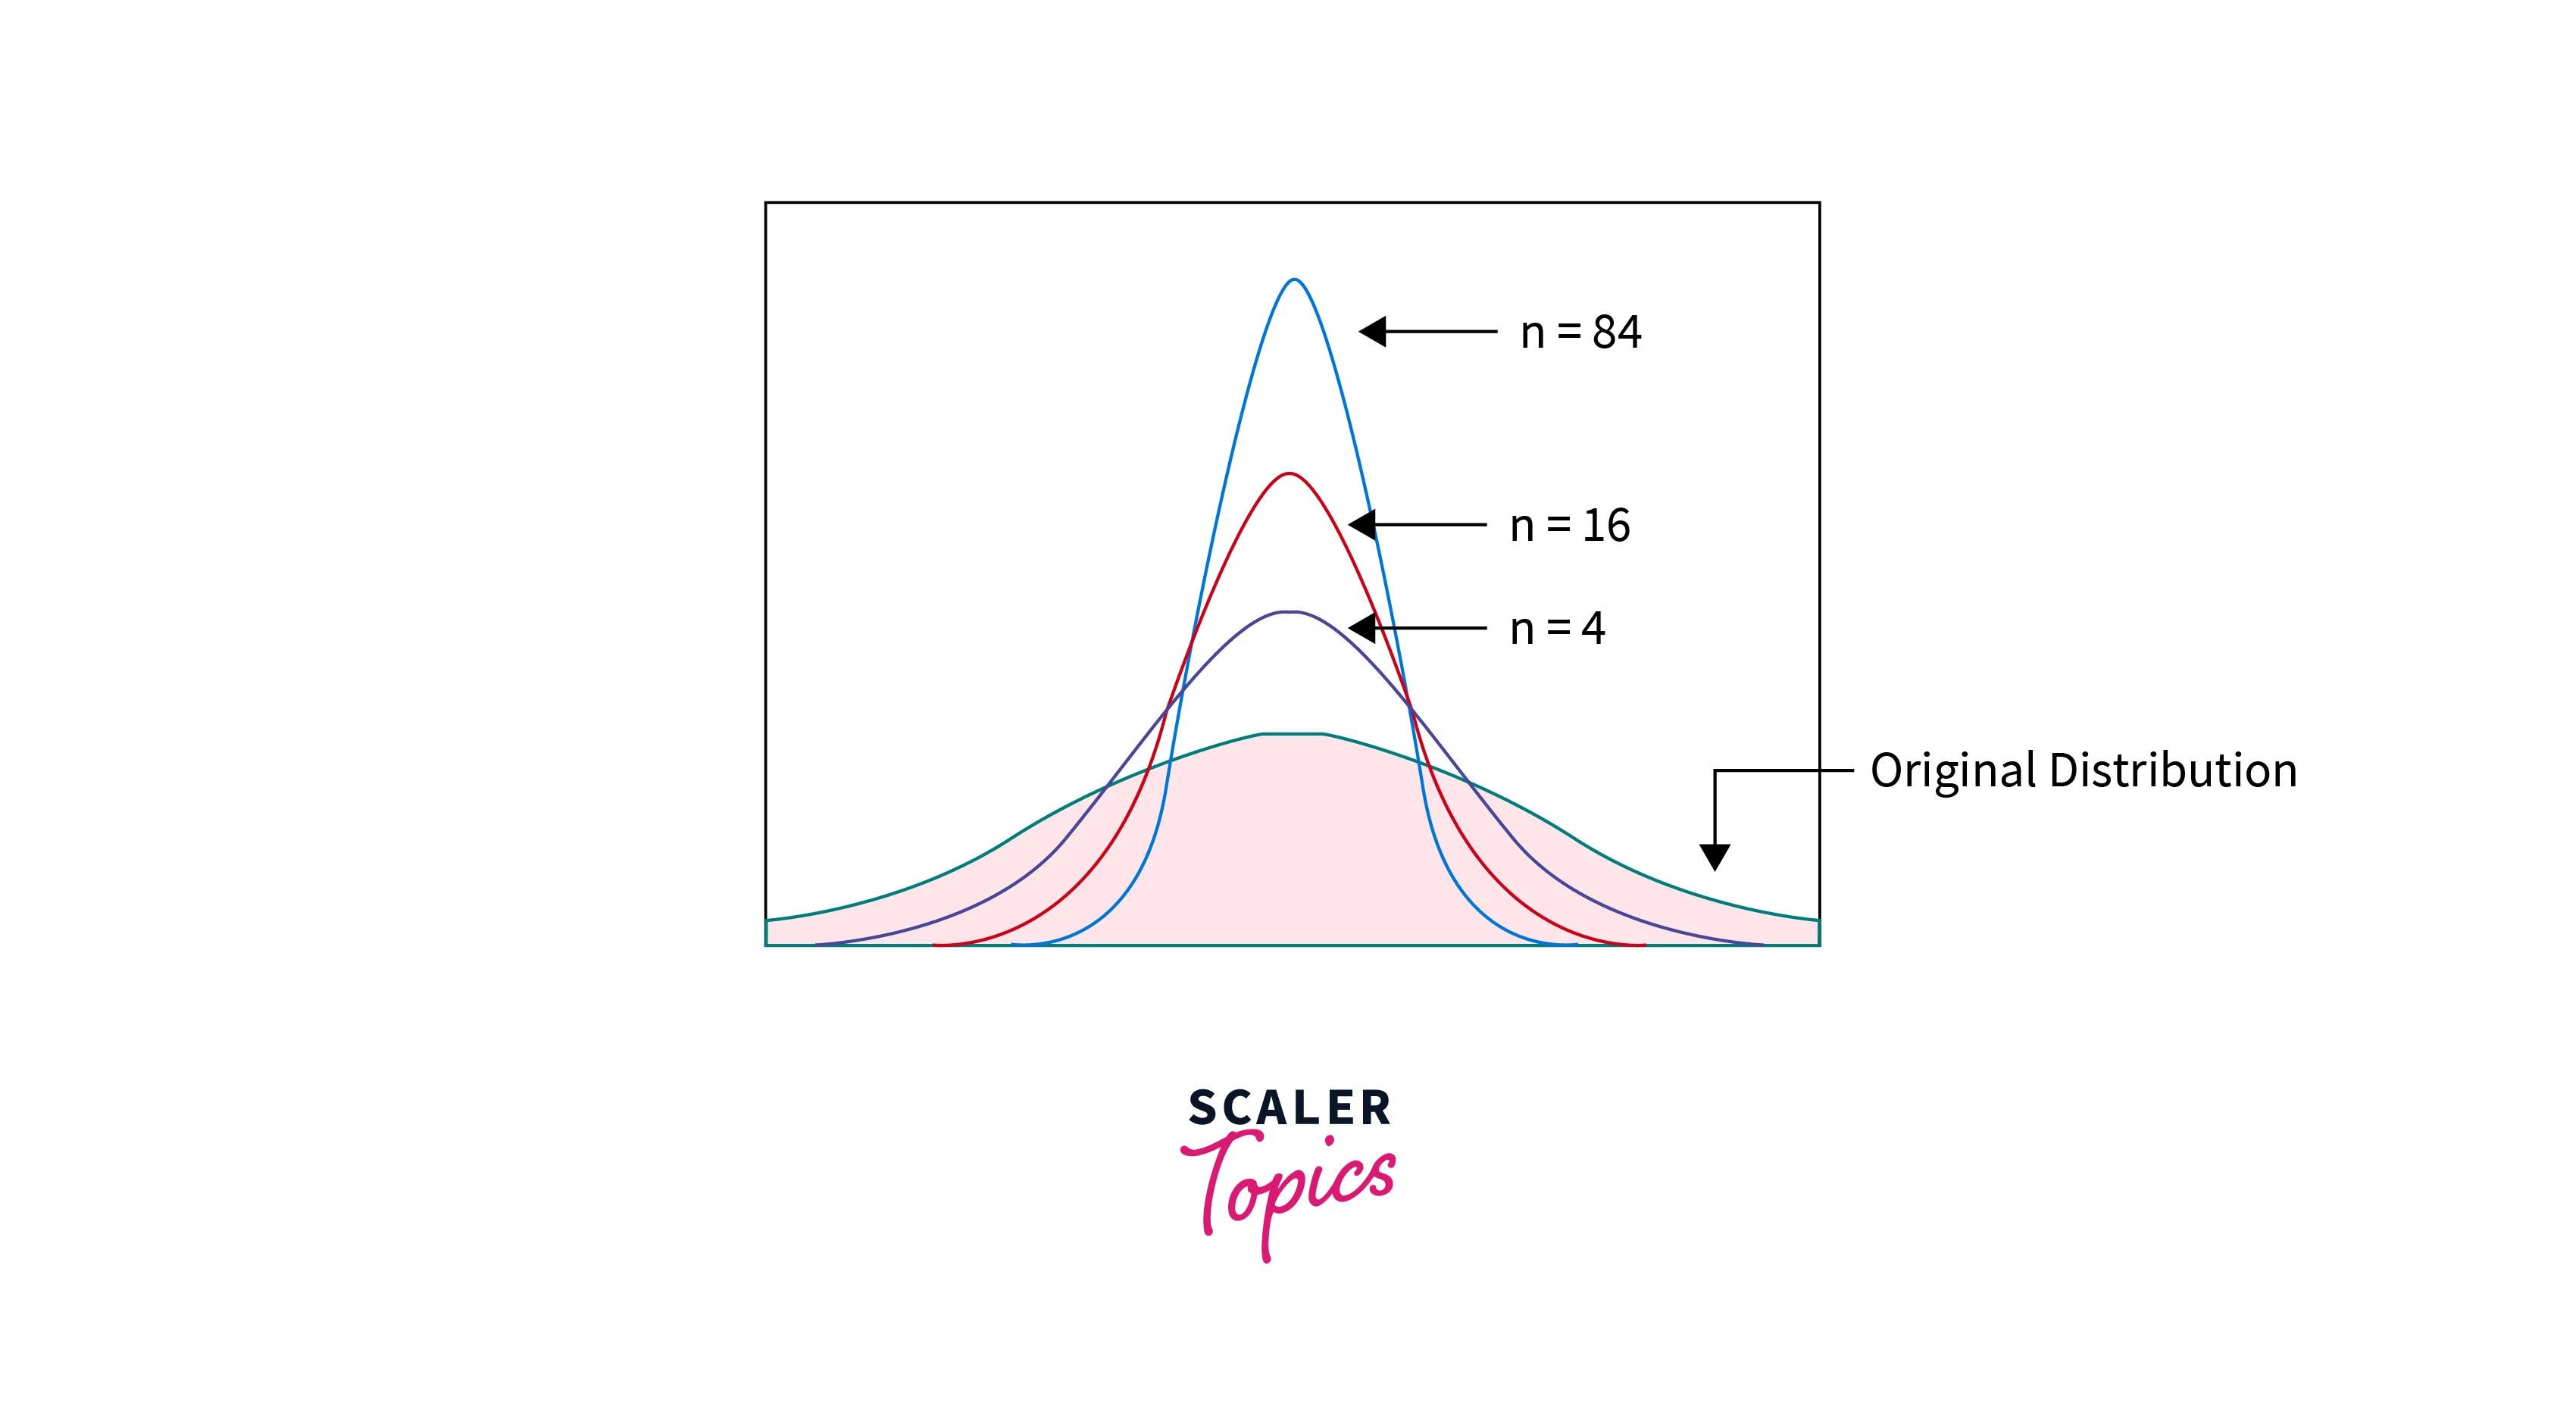
- This means that using CLT, we can estimate the population means by plotting the sampling distribution of the sample mean. Irrespective of the population distribution, it can help estimate the population statistic. Also, if we increase the sample size, the sample mean will become more normally distributed around the population mean, and variability will decrease, giving us a better estimate of the population statistic.
Bootstrapping - Sampling Distribution Method
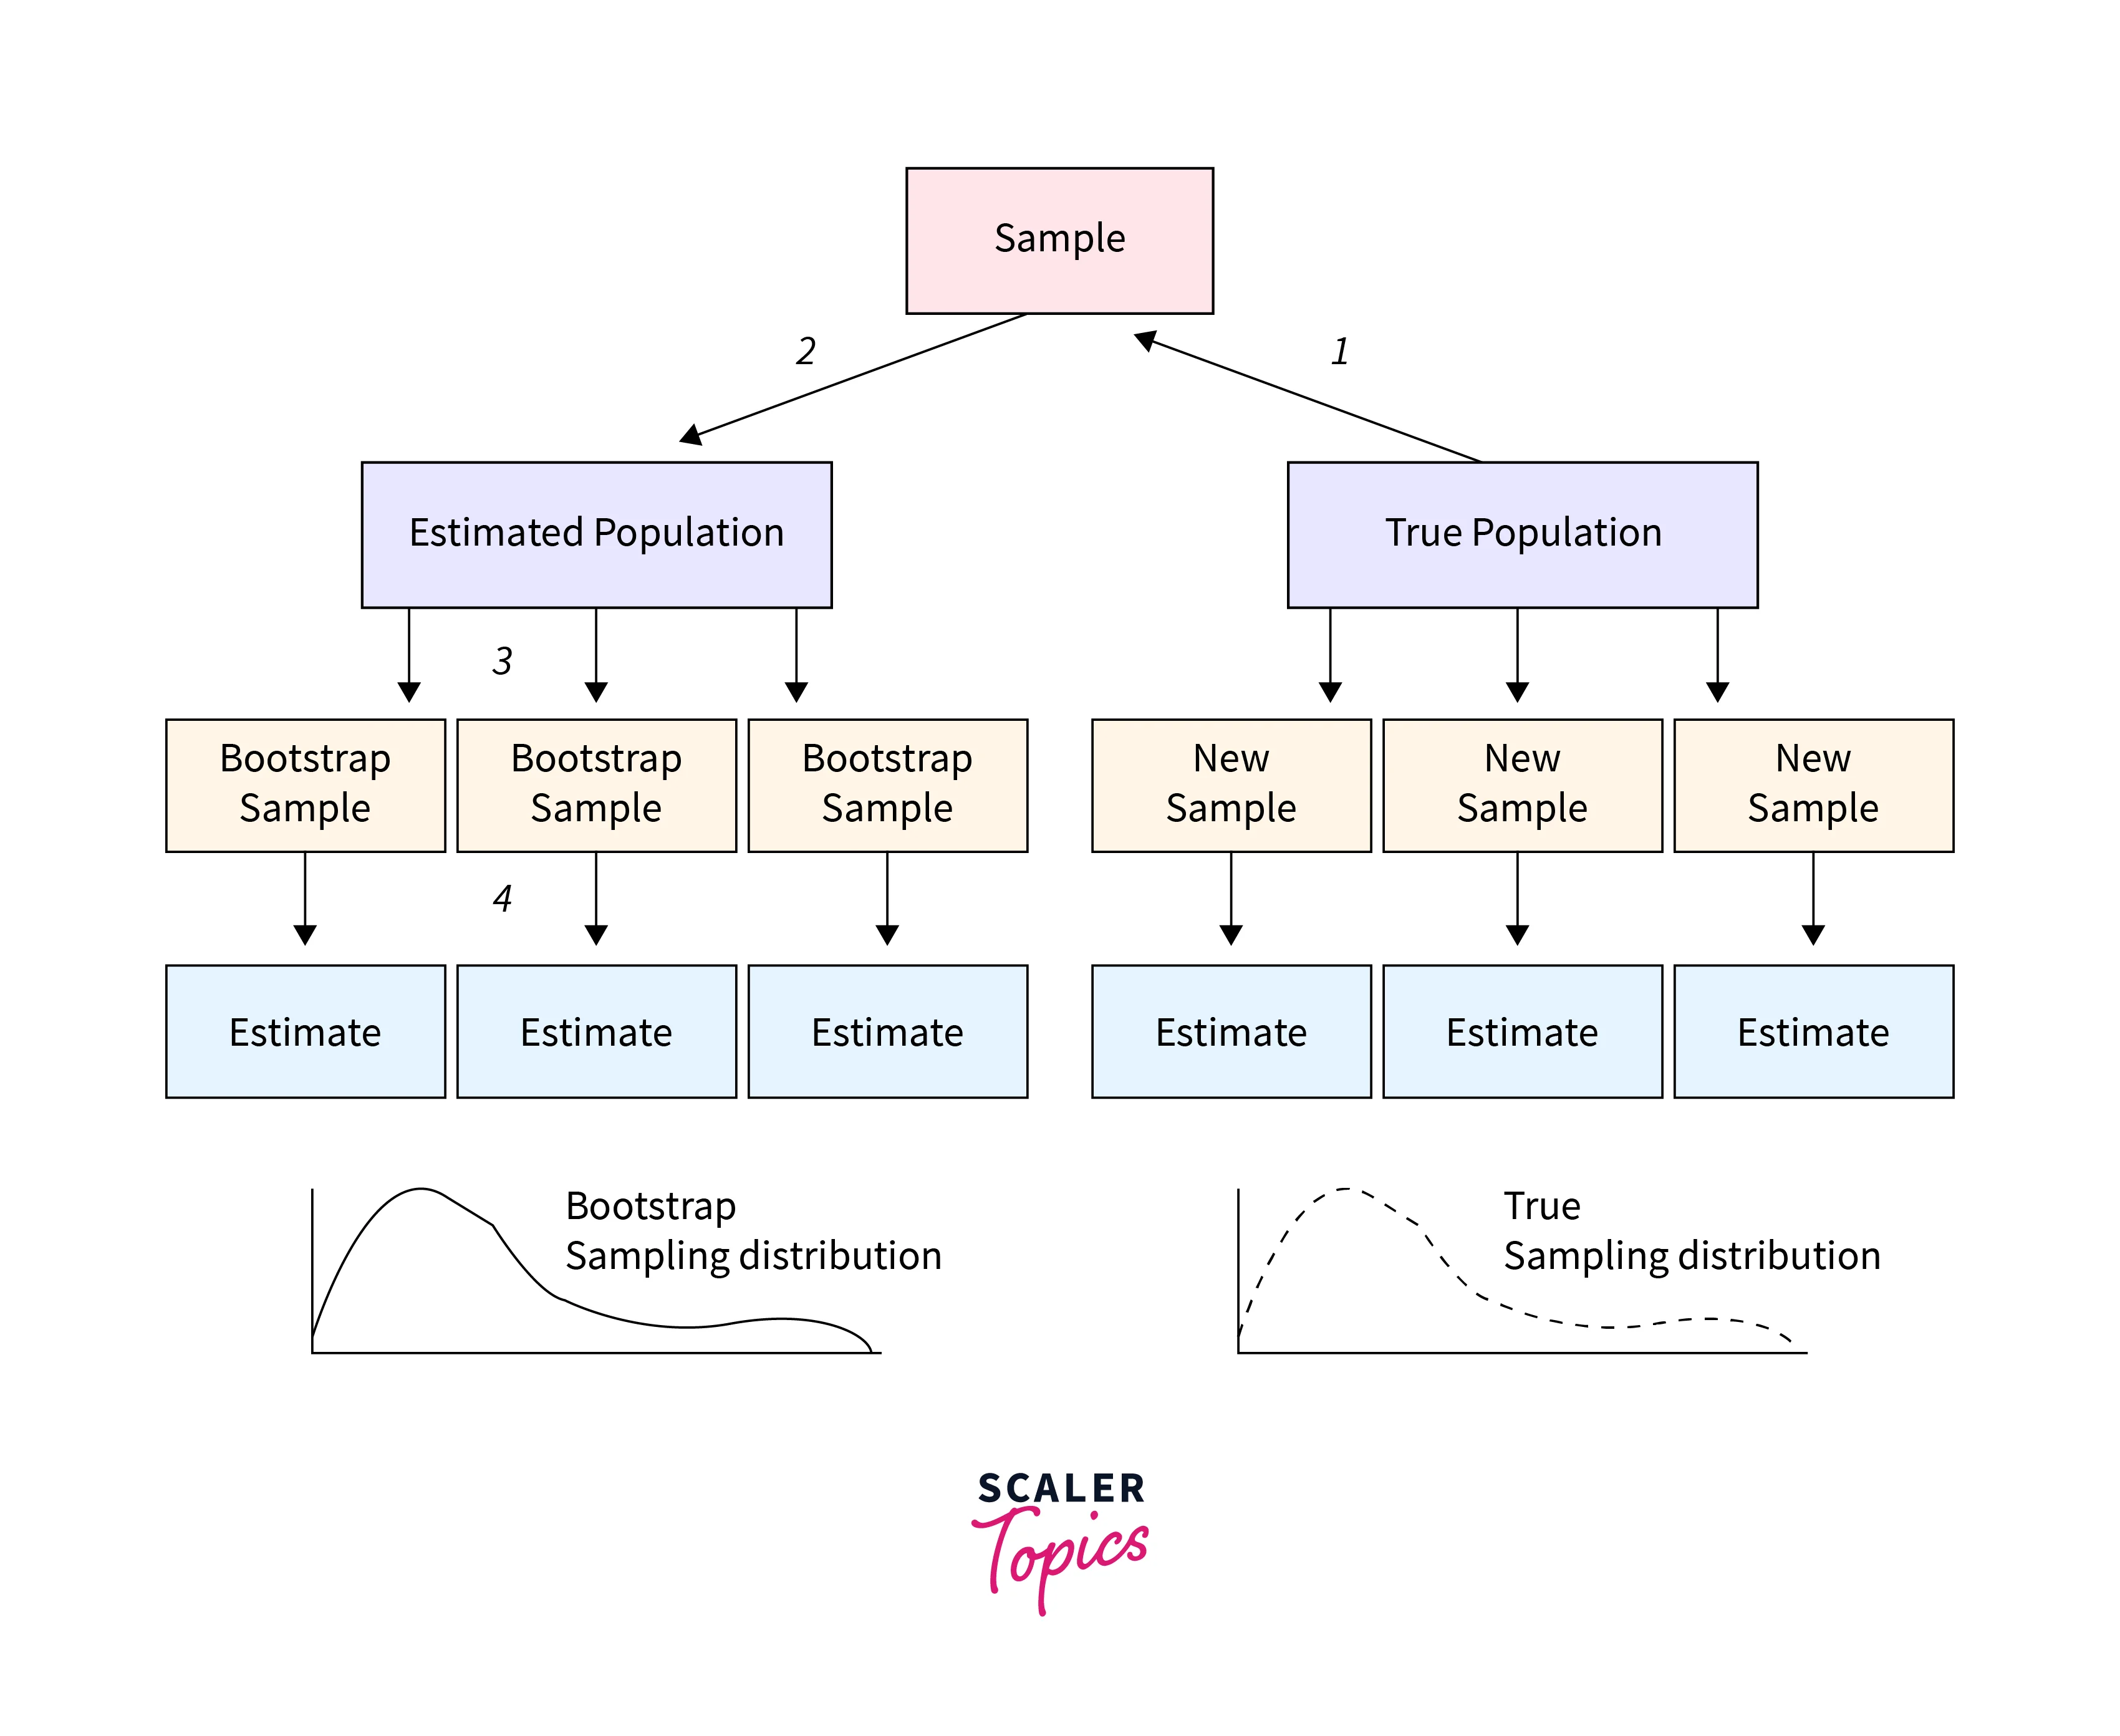
- Bootstrapping is a procedure to construct a sampling distribution that uses resampling a dataset to create many simulated samples.
- The idea behind bootstrapping is to simulate the sampling process to generate the sampling distribution of a sample statistic. By repeatedly drawing samples with replacement and computing the sample statistic for each sample, we can generate a large number of sample statistics, which can be used to construct the sampling distribution. It is a useful method when studying the entire population is not feasible.
- Let’s understand it with an example. Suppose we want to estimate the mean height of a given population of adult females. We collect height data for randomly selected 500 adult females whose sample mean is 154 cm. To generate sampling distribution using the bootstrapping method, we will create a new sample by resampling the original sample with a replacement. This way, some observations would be included multiple times, and others might not. Once a new sample is created, we can compute its mean. We repeat this process many times and plot the sample mean. The resulting distribution of these sample means would be our sampling distribution.
- Given our sample data, the above sampling distribution can estimate the possible range of values for the population's mean height. We can use the sampling distribution to construct confidence intervals or to conduct hypothesis tests about the population mean height.
Point Estimates
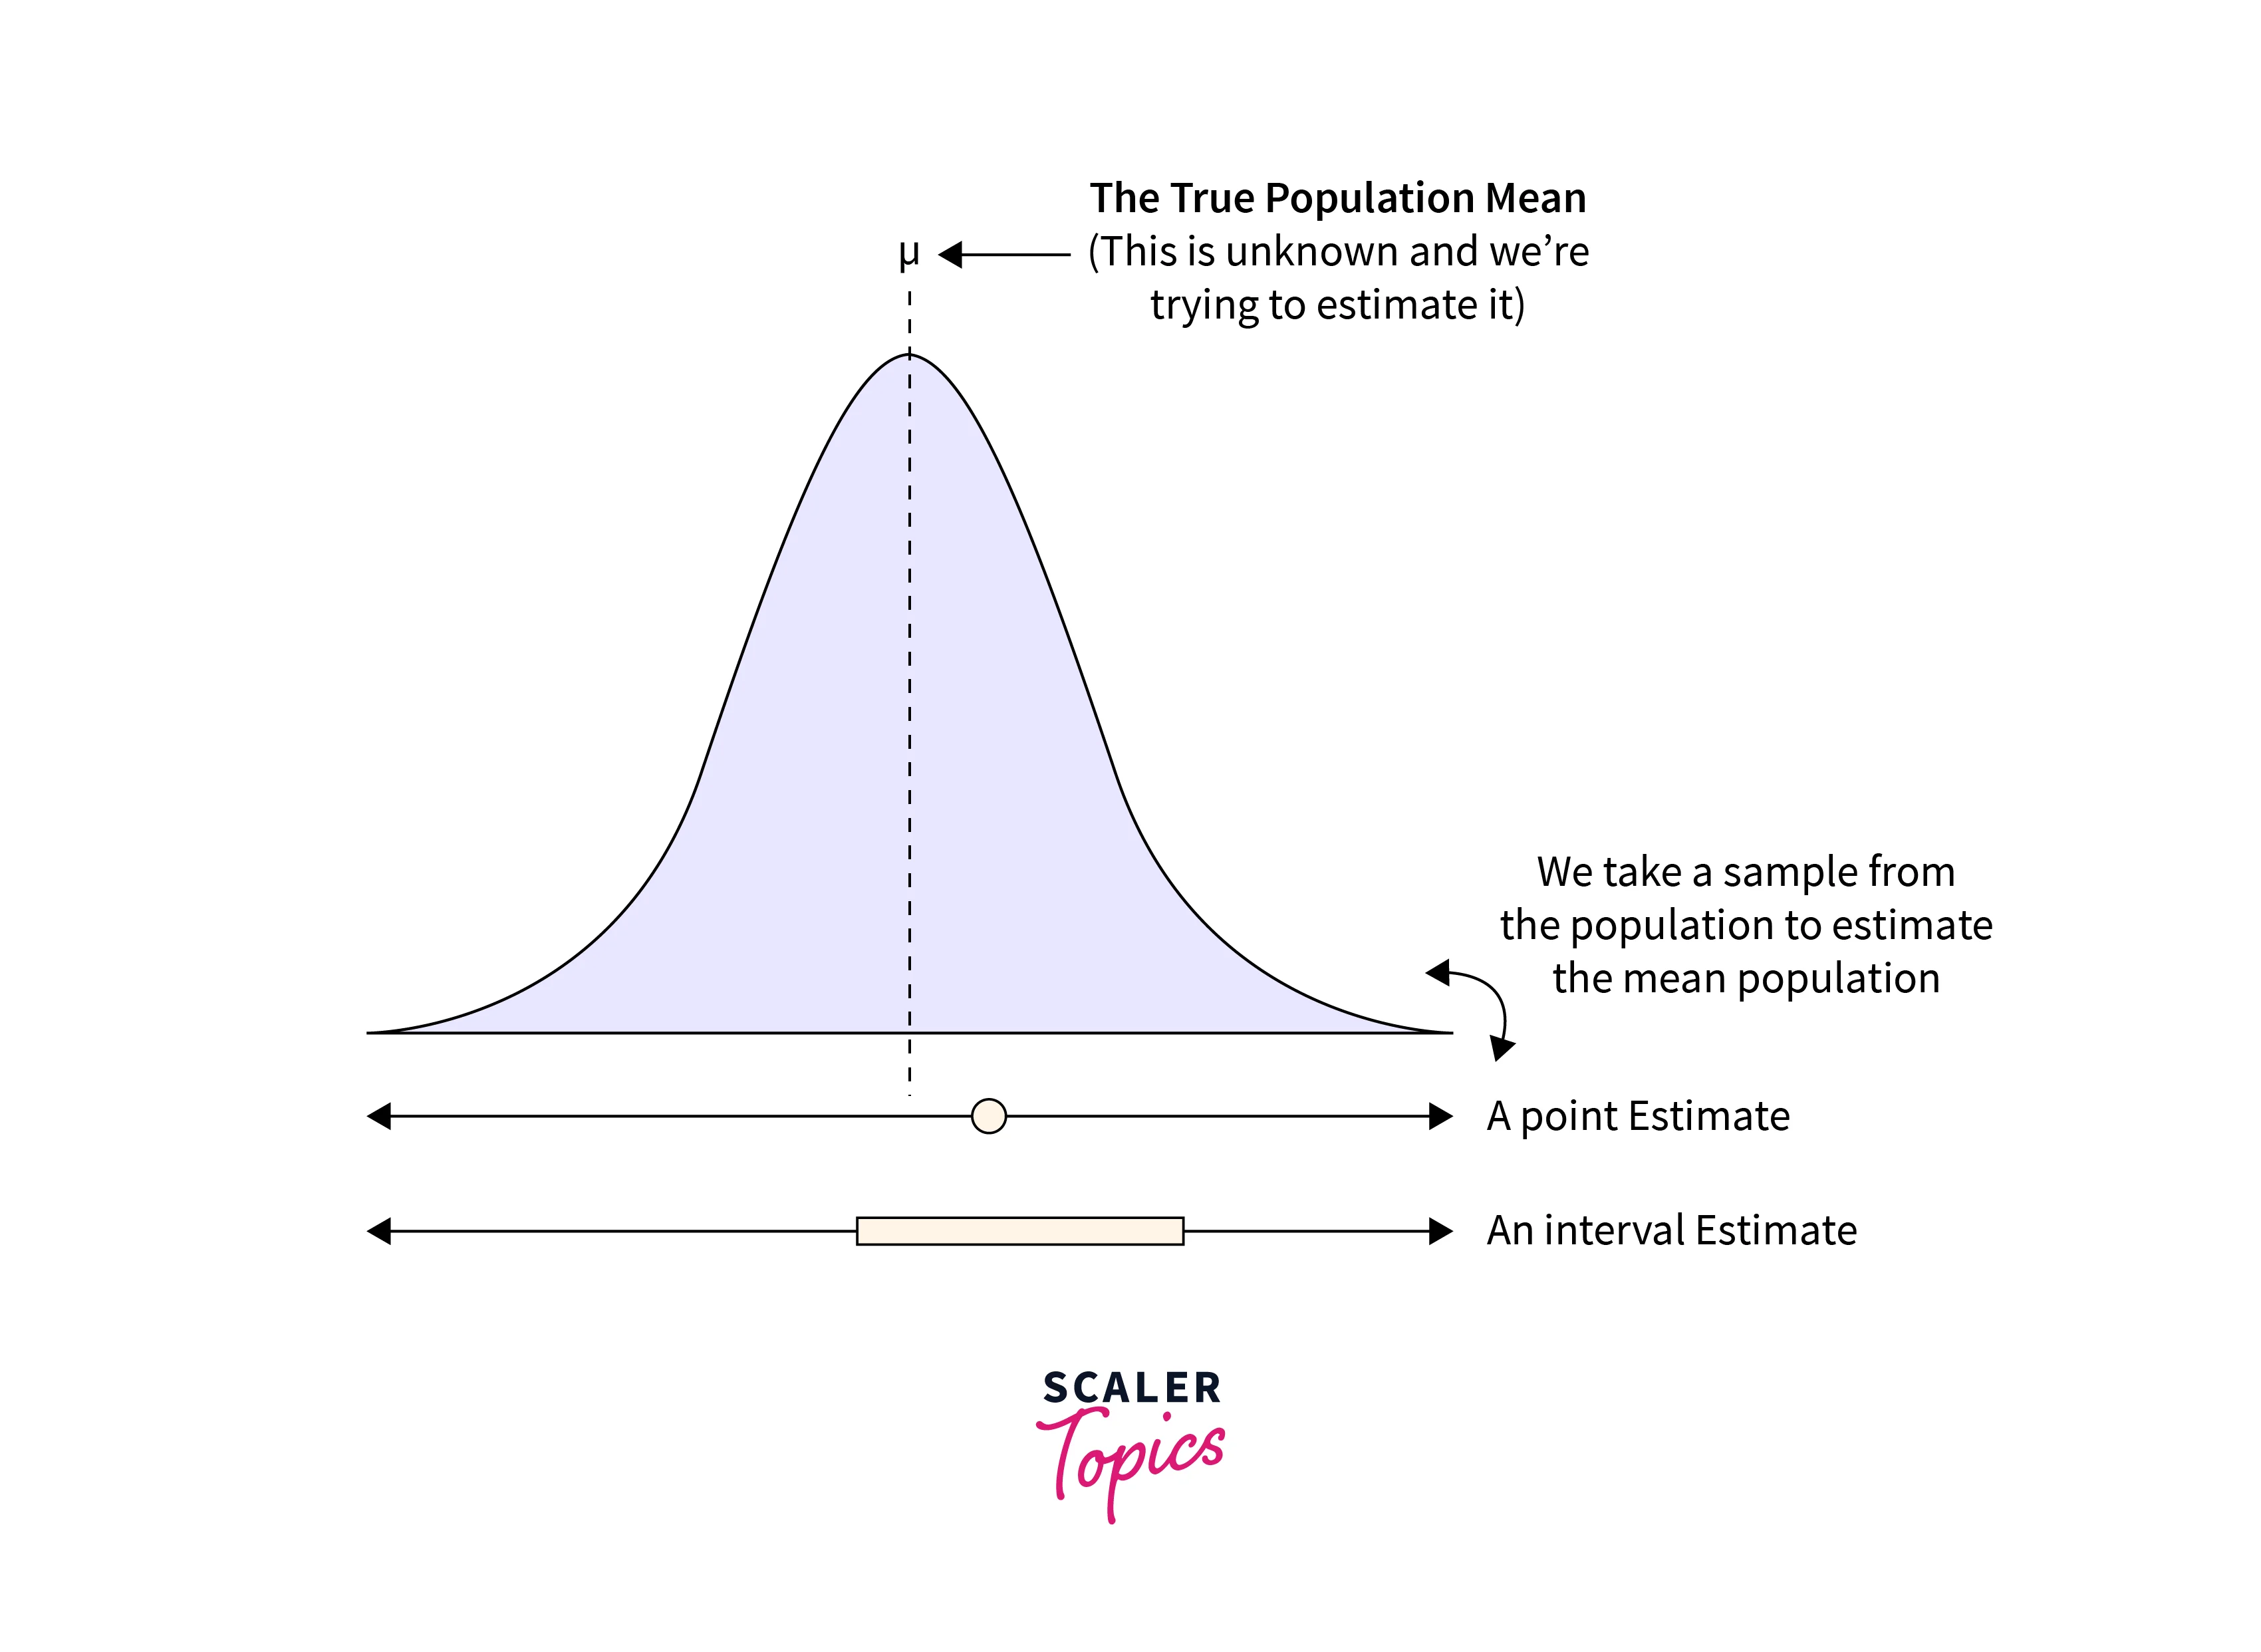
- A Point estimate is a single value, often a sample statistic, used to estimate a population statistic. It is an Inferential Statistics method that uses sample data to infer conclusions about the population.
- Point estimates typically use sample statistics, such as the sample mean. For example, if we are interested in the mean income of a population, we could calculate the sample mean income from a random sample of individuals and use this value as our point estimate of the population's mean income.
- Point estimates are useful as they provide a single, concise value that can be used to summarize the results of a sample and infer conclusions about the population. However, these are subject to sampling error, so they may not be inaccurate.
Confidence Intervals
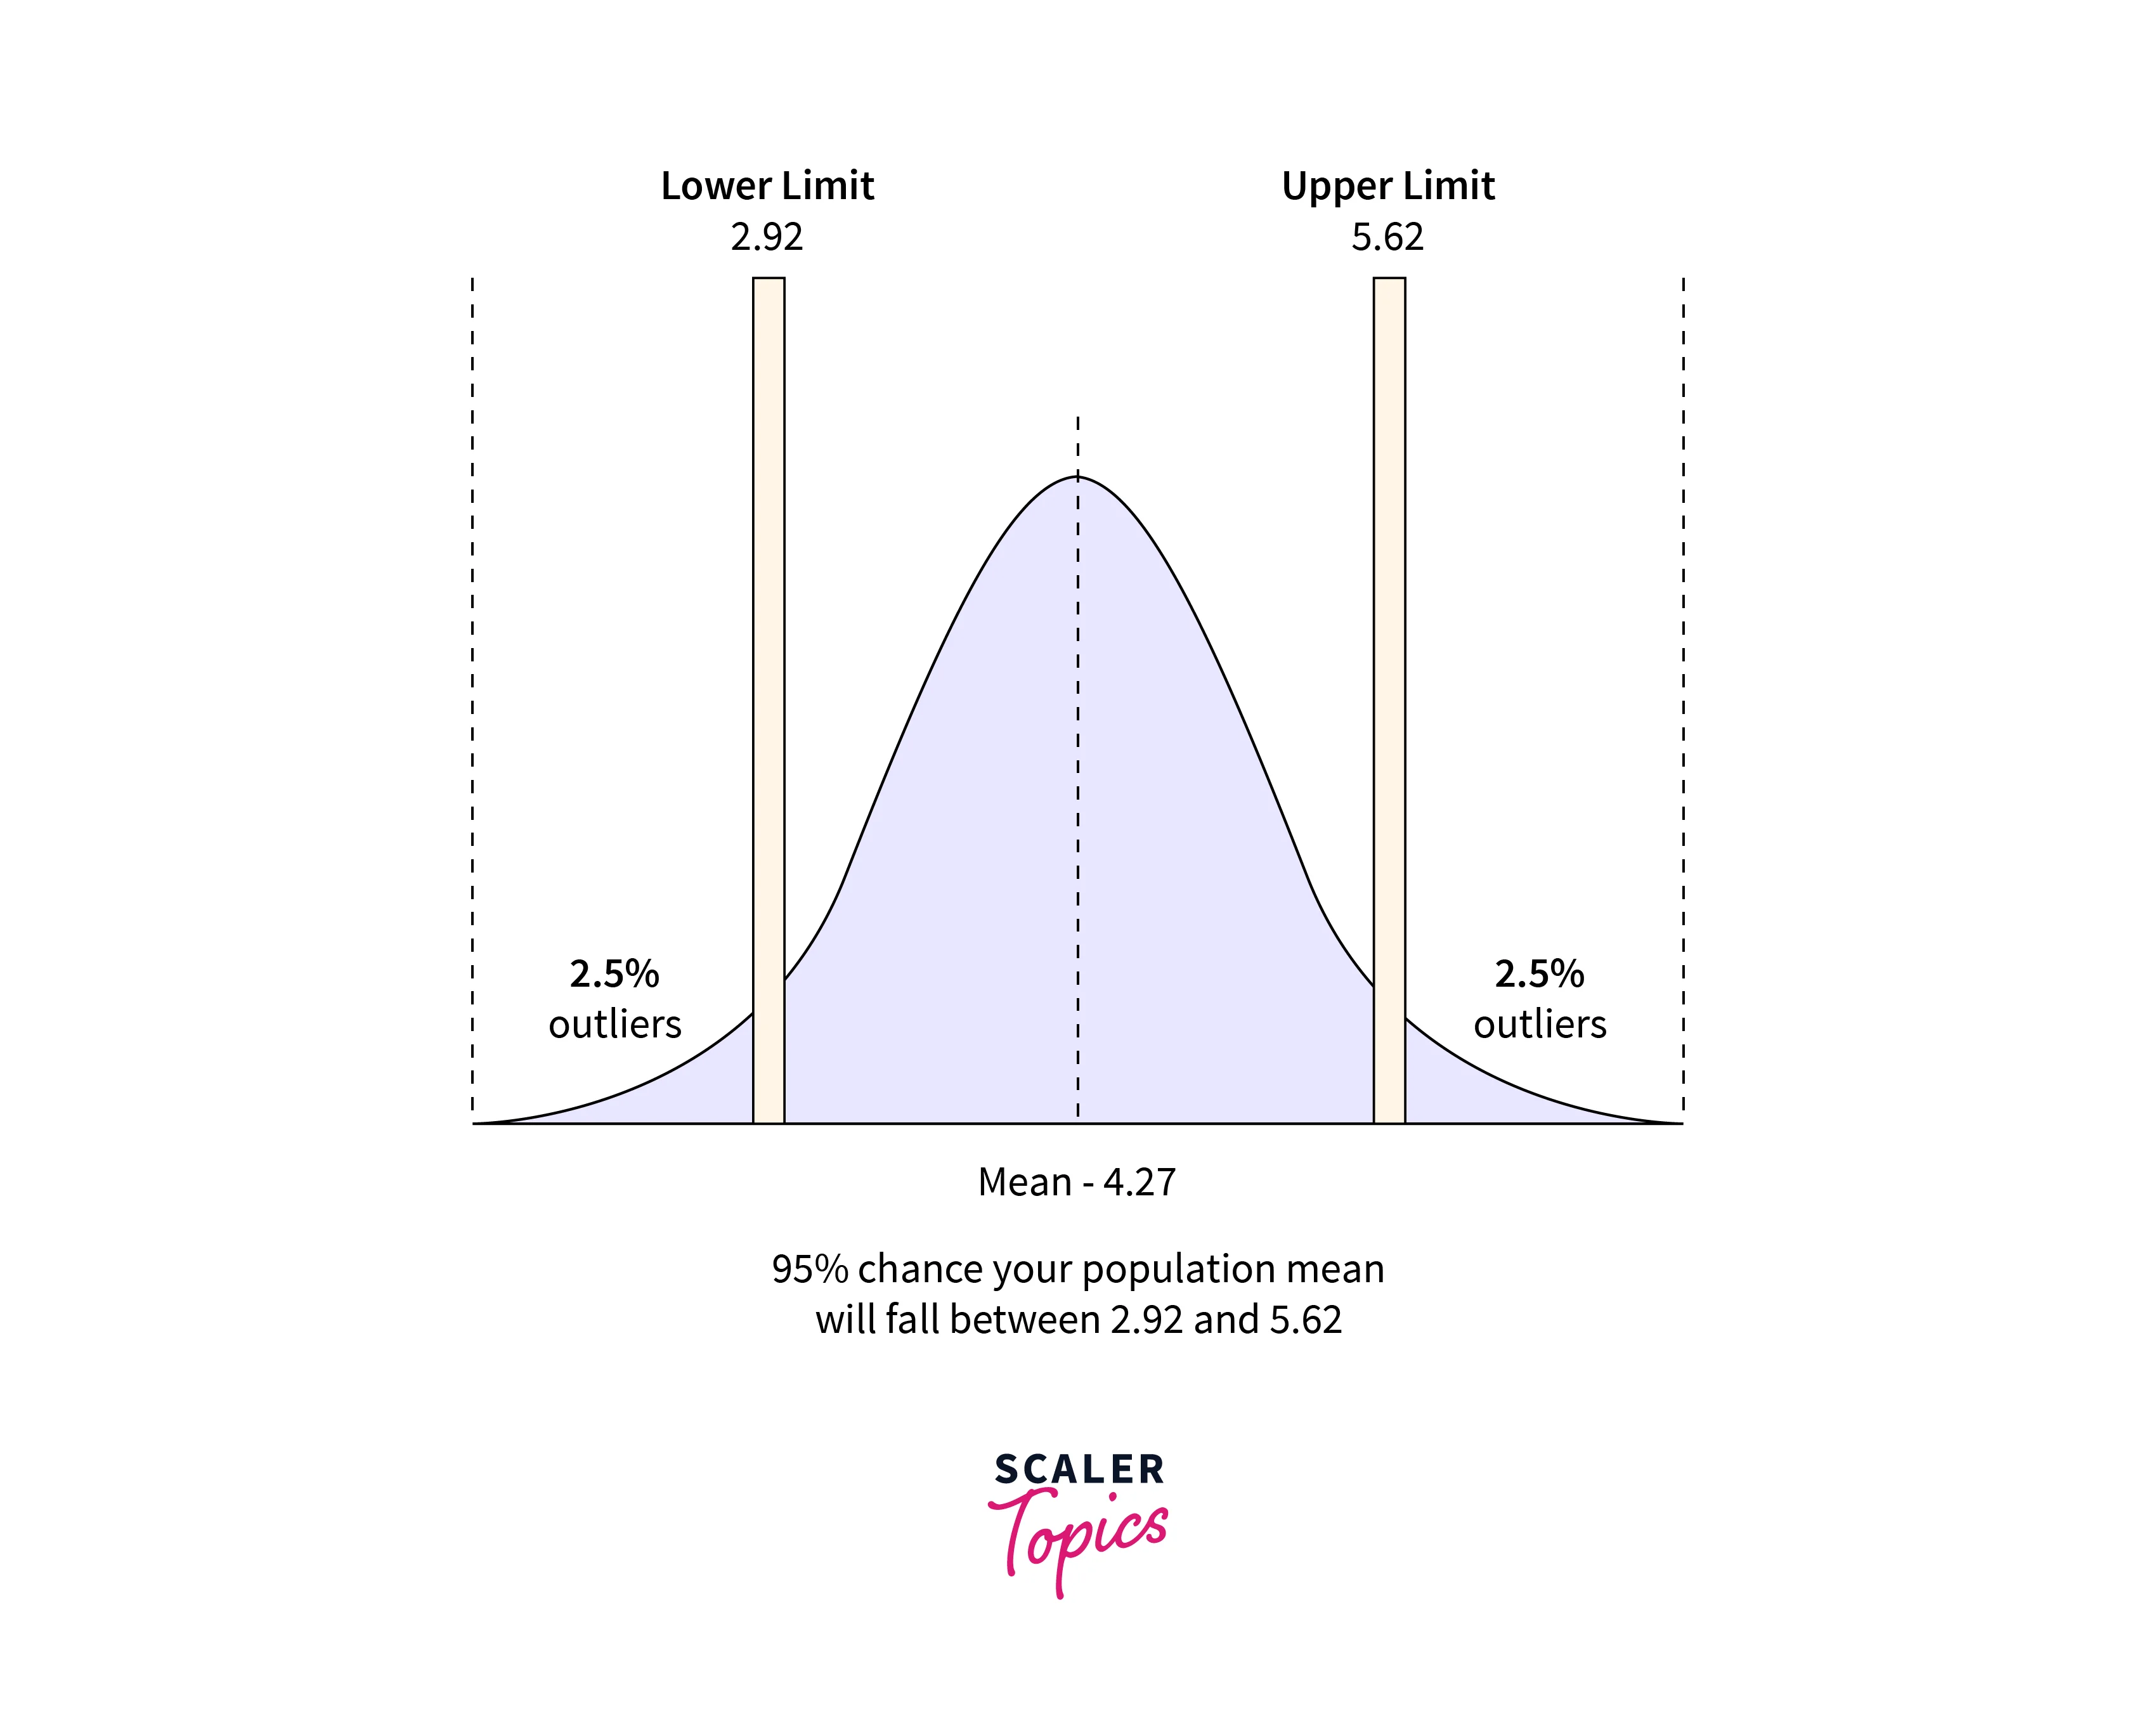
- A Confidence Interval is a range of reasonable values for a population statistic based on sample data. It measures uncertainty around a Point Estimate of a population statistic.
- Confidence Interval uses the level of confidence, generally expressed as a percentage, and it represents the probability that the confidence interval will contain the true population parameter/statistic. For example, a Confidence Interval with a 95% confidence level indicates a 95% probability that the actual population means will be within our confidence interval.
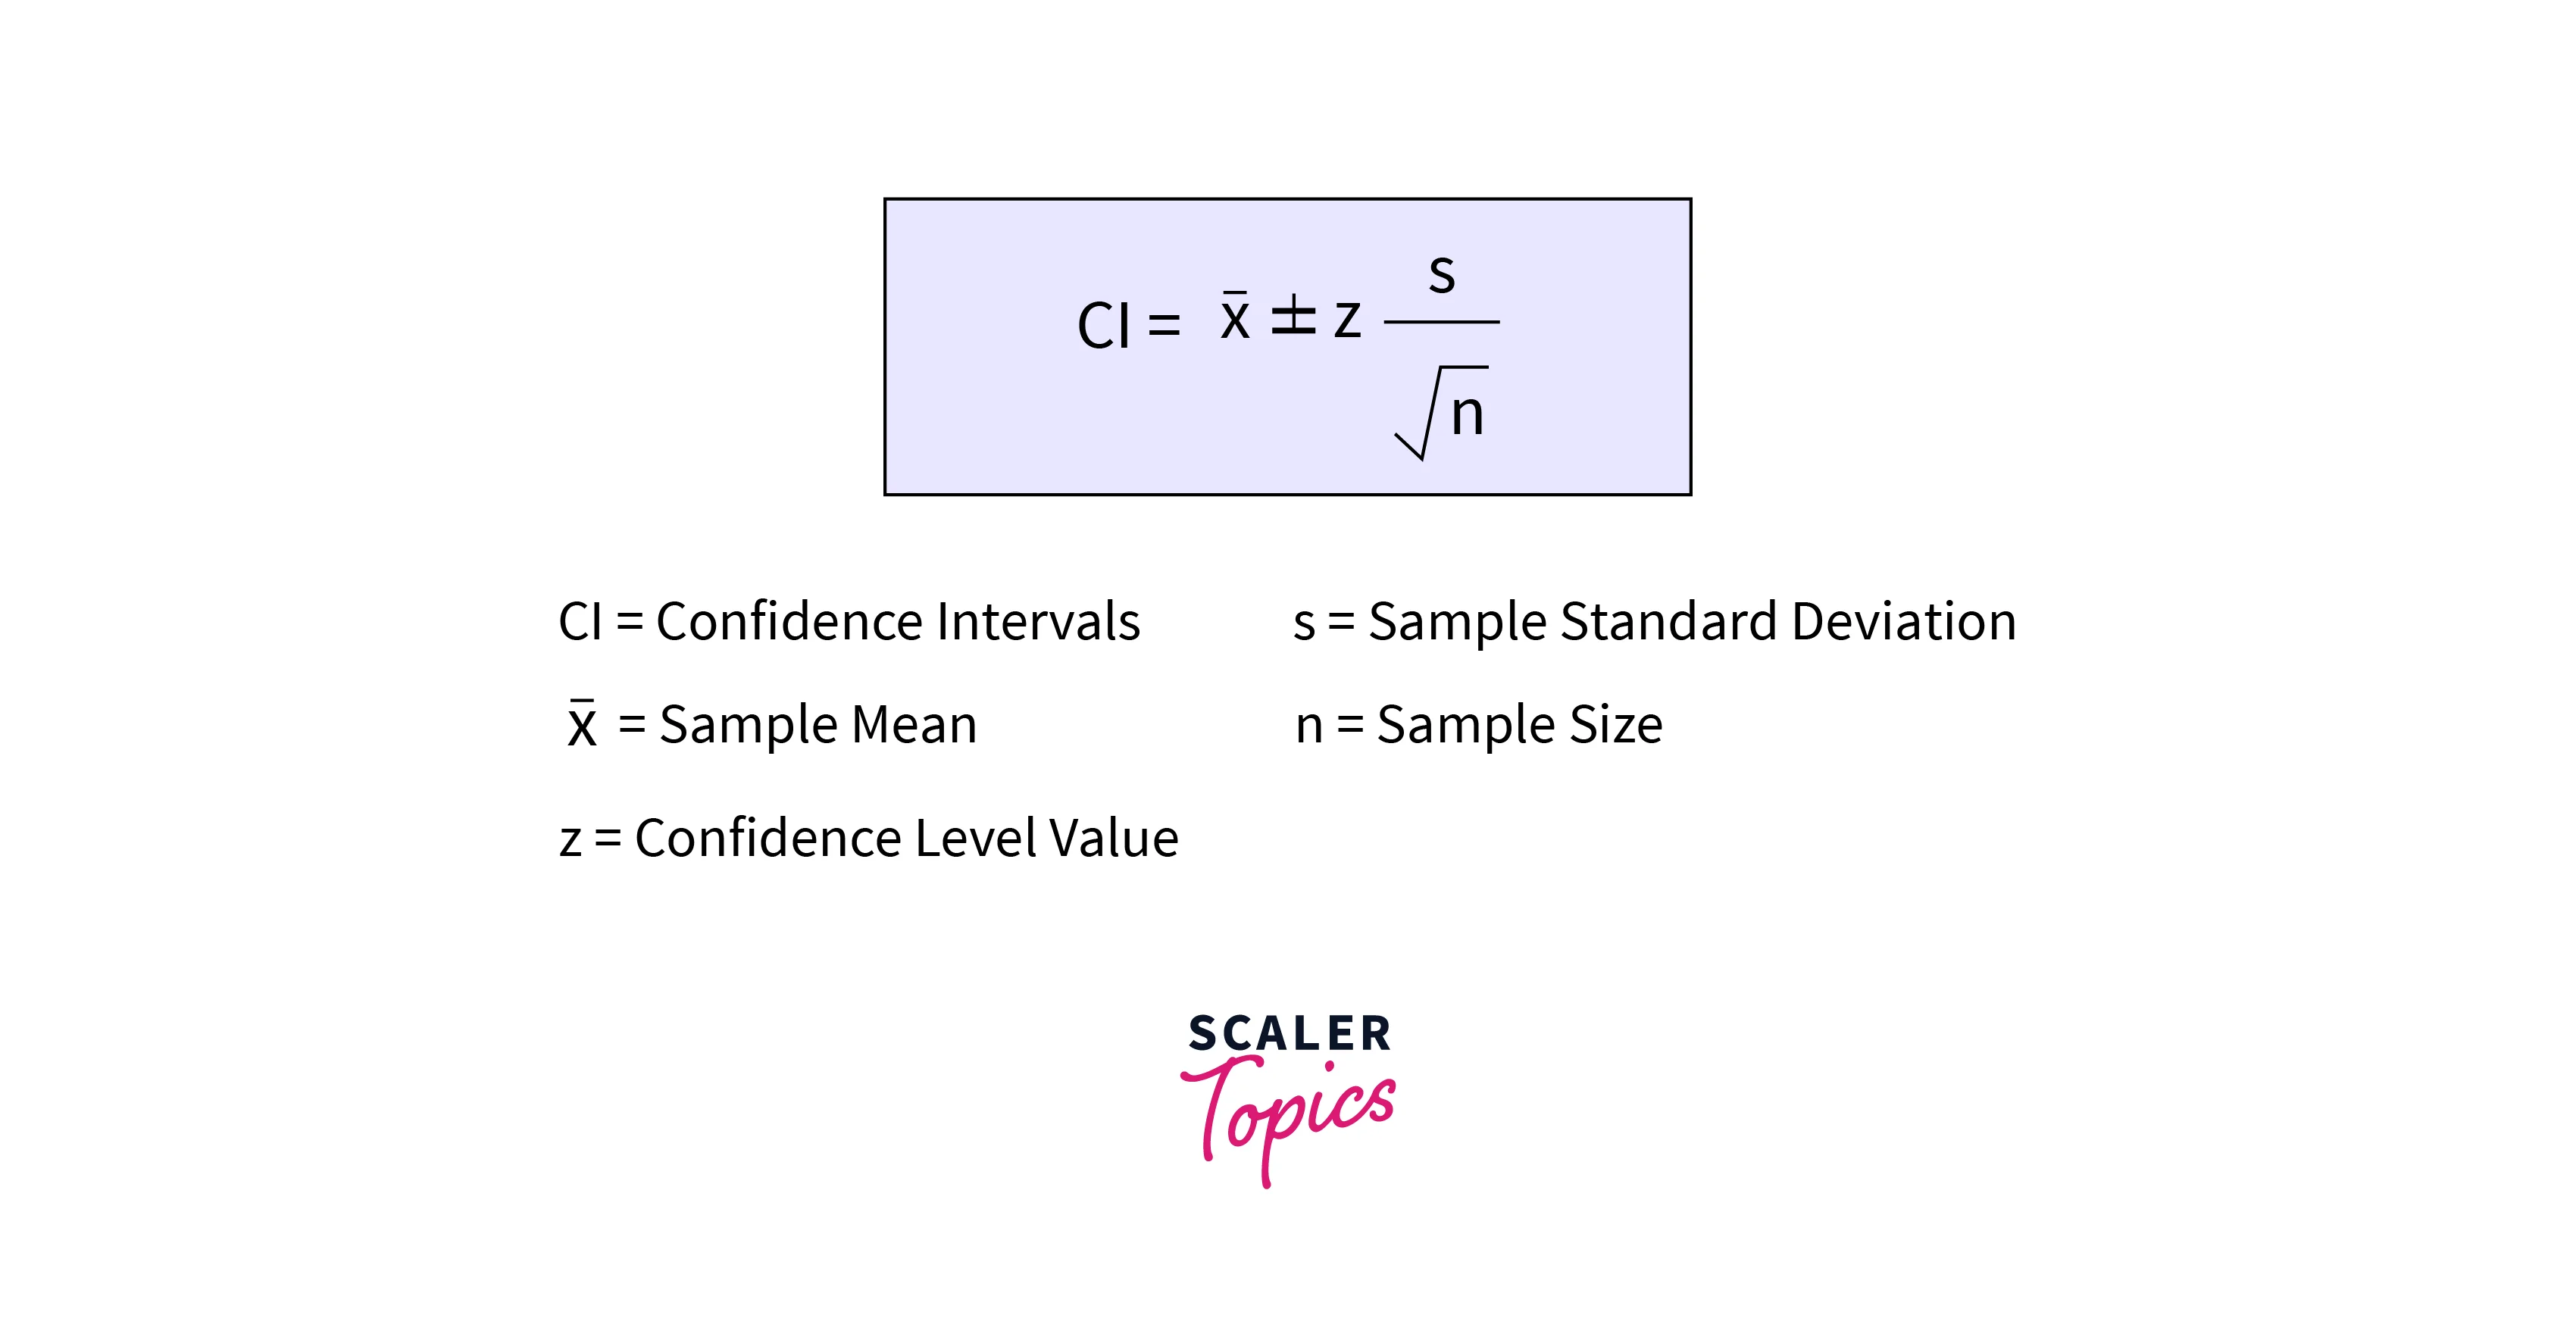
- Confidence Interval can be computed using the below formula -
Difference between Inferential Statistics and Descriptive Statistics
Let’s understand the difference between both Inferential and Descriptive Statistics below table -
| Factor | Inferential Statistics | Descriptive Statistics |
| Definition | It uses sample data to draw inferences about a population. | It summarizes the characteristics of a sample without making predictions about the population |
| Goals | Testing hypotheses and inferring conclusions about a population | describing and summarizing the characteristics of a sample |
| Techniques used | Hypothesis Testing, Regression Analysis, ANOVA | Mean, Median, Range, Standard Deviation |
| Output | Output is in the form of probability. | The output generally includes charts, graphs, tables, etc. |
| Statistical Significance | It uses statistical significance methods to compute the probability of whether results occurred by chance. | Typically does not use Statistical Significance. |
Conclusion
* Inferential Statistics utilizes a wide range of mathematical models and methods on sample data to draw inferences or predictions about a larger population. It can help understand a larger population from a sample, compare models, and identify statistically significant features.
- Inferential Statistics uses techniques such as Sampling distributions , Confidence Intervals,Point Estimates, hypothesis testing, Regression Analysis, ANOVA, etc.