

Machine Learning Evaluation Metrics : Precision, Recall, F1 & More
Ask someone to build a model and most people can do it by Friday afternoon at this point, scikit-learn made sure of that. Ask them to defend why they picked F1 over recall, or RMSE over MAE, and the room goes quiet. That gap, between training a model and actually knowing whether it's any good, is what this article is for.
One running scenario carries the whole classification half: a 1,000-patient cancer screening model. One small housing example carries the regression half. Every metric below gets computed from the same numbers, so you can actually compare them instead of memorising formulas in isolation, which, let's be honest, is how most people forget them by the next interview anyway.
What Are Evaluation Metrics in Machine Learning?
Evaluation metrics are quantitative measures of how well a model's predictions match reality. That's it, that's the whole definition. The catch is that classification and regression problems need completely different metrics, because "predicted the wrong category" and "predicted a number that's off by 12" aren't measurable the same way. Using an accuracy score on a house-price model, or MAE on a spam filter, doesn't just give you a slightly wrong answer, it gives you a meaningless one.
Why Accuracy Alone Is Misleading
Here's the scenario this whole article runs on: a screening model checks 1,000 patients for a rare cancer. In the real population, 50 of them actually have it, 5%. Rare, but not vanishingly so.
Now imagine a genuinely lazy model. One that never even looks at the scan and just predicts "no cancer" for every single patient. What's its accuracy?
950 correct out of 1000 = 95.0% accuracy
A model that catches zero cancers, ever, scores 95%. That's not a typo, and it's not a trick question either, it's just what accuracy does on imbalanced data. It rewards you for agreeing with the majority class, and in most of the interesting real-world problems (fraud, disease, churn, fraud again because fraud comes up constantly), the majority class is "nothing happened," which is exactly the case you don't care about detecting.
If this were a leaderboard, the do-nothing model would be sitting comfortably above most people's actual submissions. Which should tell you something uncomfortable about how often accuracy gets quoted in a meeting as if it settles the argument on its own.
Build an AI-First Career, Master the Complete Skillset
Choose from our industry-leading programs designed for career success
Modern Software and AI Engineering Program
Master full-stack development with AI integration


 +1000 more
Modern Data Science and ML with specialisation in AI
Advanced data science techniques with AI specialization
+1000 moreAdvanced AIML with Specialisation in Agentic AI
Deep dive into AIML with focus on Agentic systems
+1000 moreDevOps, Cloud & AI Platform Engineering
Build and manage AI-powered cloud infrastructure
+1000 moreAI Engineering Advanced Certification by IIT-Roorkee
Premier AI engineering certification from IIT-Roorkee

AI Forward Deployed Engineer Program
Full-stack engineering, production AI and client-facing consulting
+1000 moreThe Confusion Matrix: Foundation of Classification Metrics
Every classification metric below comes out of the same four numbers. Here's the confusion matrix for a slightly-less-lazy model that actually tries:
| Predicted: Cancer | Predicted: No Cancer | |
|---|---|---|
| Actual: Cancer | TP = 40 | FN = 10 |
| Actual: No Cancer | FP = 90 | TN = 860 |
• TP (True Positive) = 40, correctly caught actual cancer
• FN (False Negative) = 10, missed cancer, told the patient they're fine
• FP (False Positive) = 90, false alarm, scared a healthy patient
• TN (True Negative) = 860, correctly cleared a healthy patient
Every metric from here on is just a different ratio carved out of these same four numbers. Nothing hidden, nothing estimated.
Stop learning AI in fragments—master a structured AI Engineering Course with hands-on GenAI systems with IIT Roorkee CEC Certification
:::


AI Engineering Course Advanced Certification by IIT-Roorkee CEC
A hands on AI engineering program covering Machine Learning, Generative AI, and LLMs - designed for working professionals & delivered by IIT Roorkee in collaboration with Scaler.
Enrol Now
Classification Metrics
These build on the logistic regression type of model most classifiers you'll meet early on are built as, so the confusion matrix above applies almost everywhere in this family.
Accuracy
Accuracy = (TP + TN) / Total = (40 + 860) / 1000 = 0.9000
90% sounds respectable right up until you remember the always-negative model scored 95% by doing nothing at all. Our actual model is, technically, worse than doing nothing, at least by this one metric. That's the whole problem with accuracy in one sentence.
Precision
Precision = TP / (TP + FP) = 40 / 130 = 0.3077
Plain English: of everyone the model flagged as "cancer," how many actually had it? Just under a third. The other two thirds are healthy people getting an anxious phone call and an unnecessary follow-up biopsy. Low precision is expensive in a very specific, very human way, it's the metric for when false alarms cost real money or real trust (fraud review queues, spam folders, content moderation flags).
Somewhere, a product manager is currently insisting their spam filter is "basically perfect" because it catches everything. Ask them what percentage of flagged emails were actually spam before you agree.
How Scaler Transformed Careers in Different Fields
Scaler learners achieved 2.5x salary growth with average post-Scaler CTC reaching ₹23L.
 Google
 Amazon
 Microsoft
 Flipkart
 Adobe1200+ more
Recall (Sensitivity)
Recall = TP / (TP + FN) = 40 / 50 = 0.8000
Of everyone who actually had cancer, how many did the model catch? 80%, which sounds a lot better than the precision number, and in this specific scenario, it should be the number you actually care about. Missing a real cancer case (a false negative) is a fundamentally worse outcome than a false alarm. Recall is the metric for exactly that asymmetry.
F1 Score
F1 = 2 * (Precision * Recall) / (Precision + Recall) = 0.4444
F1 is the harmonic mean of precision and recall, not the plain average, and that's deliberate. A harmonic mean punishes imbalance between the two. If precision is 0.31 and recall is 0.80, a plain average would give you a comfortable-looking 0.555. The harmonic mean gives you 0.4444 instead, dragging the score down toward whichever number is worse. That's the point, F1 refuses to let one great score paper over one terrible one.
Specificity and ROC-AUC
Specificity = TN / (TN + FP) = 860 / 950 = 0.9053
Specificity is recall's mirror image, of everyone actually healthy, how many did the model correctly clear. High specificity here (90.5%) means the model is decent at leaving healthy people alone, even though its precision on the positive class is rough.
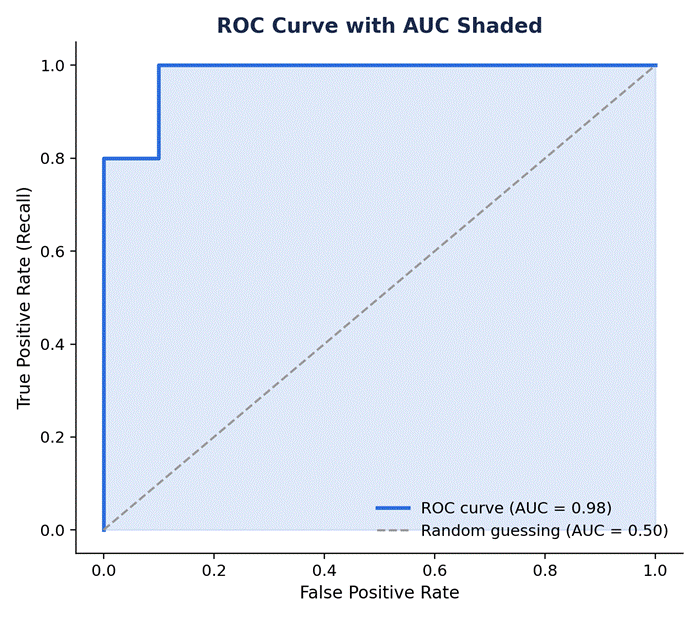
ROC-AUC answers a different question entirely: instead of judging one threshold, it asks how good is this model's ranking, across every possible threshold at once. Sweep the decision threshold from strict to lenient, plot the true positive rate against the false positive rate at each point, and the area under that curve is the AUC. A perfect ranking model scores 1.0. Random guessing scores 0.5. On a small illustrative ranking set built from this same style of screening data, the model came out to an AUC of 0.98, which is very good, and also a reminder that AUC is a ranking measure, not a promise about any one threshold you'll actually deploy with.
Turn Learning into Career Growth
Log Loss
Quick honourable mention since it comes up in anything probability-based: log loss doesn't just check if you got the label right, it punishes confident wrong answers much harder than uncertain ones.
• Predicting 0.95 for an actual positive costs about 0.05 in log loss, barely a dent
• Predicting 0.05 for that same actual positive costs about 3.0, a genuinely large penalty
The lesson: being confidently wrong is punished far more than being cautiously wrong. Useful whenever calibrated probabilities matter, not just the final yes or no.
Quick summary of everything above, side by side:
| Metric | Formula | Value | Use when |
|---|---|---|---|
| Accuracy | (TP+TN) / total | 0.9000 | Classes are roughly balanced |
| Precision | TP / (TP+FP) | 0.3077 | False alarms are expensive |
| Recall | TP / (TP+FN) | 0.8000 | Missed positives are expensive |
| Specificity | TN / (TN+FP) | 0.9053 | You care about correctly clearing negatives |
| F1 Score | 2 * (P*R) / (P+R) | 0.4444 | You need one number balancing precision and recall |
Regression Metrics
Switching examples now, since none of the metrics above make sense for a linear regression problem. Predicting house prices, five actual sales versus five predictions:
| House | Actual price (lakh) | Predicted price (lakh) |
|---|---|---|
| 1 | 50 | 55 |
| 2 | 60 | 58 |
| 3 | 80 | 75 |
| 4 | 40 | 45 |
| 5 | 100 | 90 |
MAE = 5.4000 | MSE = 35.8000 | RMSE = 5.9833 | R² = 0.9228
• MAE (Mean Absolute Error): the average miss, in the same units as the target. Off by 5.4 lakh on average. Simple, robust to outliers, doesn't panic over one bad prediction.
• RMSE (Root Mean Squared Error): squares the errors before averaging, so the one house we missed by 10 lakh (house 5) gets punished harder than the smaller misses. RMSE of 5.98 versus MAE of 5.4, that gap is basically a tell that one prediction is dragging the score.
• R²: how much of the variance in actual prices the model explains, 92.28% here, which is solid. Worth knowing R² can go negative if a model is worse than just guessing the average every time, it's not bounded at zero the way people often assume.
• Adjusted R²: plain R² goes up if you add literally any feature, even a useless one, adjusted R² penalises that. Worth reaching for the moment you're comparing models with different numbers of features.
How to Choose the Right Metric (Decision Table)
This is really the whole point of the article, everything above was groundwork. The actual skill is picking the metric that matches what an error costs you, not the one that happens to look best. If you want the deeper trade-off behind why models sometimes optimise the wrong thing entirely, our piece on bias and variance is the natural companion read.
| Situation | Reach for | Why |
|---|---|---|
| Imbalanced classes (fraud, disease, churn) | F1 or Recall | Accuracy hides how badly you're missing the minority class |
| False positives are costly (spam folder, fraud review queue) | Precision | You're paying, in money or trust, for every wrong positive call |
| Missed positives are costly (cancer screening, fraud) | Recall | A miss here is far worse than a false alarm |
| Comparing models across thresholds | ROC-AUC | Threshold-free, tells you ranking quality overall |
| Regression with outliers in the data | MAE | Doesn't let a handful of extreme errors dominate the score |
| Regression where big misses are unacceptable | RMSE | Squares errors first, so large mistakes get punished harder |
Evaluating Reliably: Train/Test Splits and Cross-Validation
None of the numbers above mean anything if they're measured on the same data the model trained on. A model that's memorised its training set will look flawless and fall apart the moment it sees anything new, which is the least fun way to find out your metric was lying to you the whole time.
A model scoring beautifully on training data and poorly on everything else has a name, overfitting, and it's exactly why every metric in this article should be reported on held-out data, never on the data the model already knows the answers to.
Computing Every Metric in Python (scikit-learn)
Here's the confusion-matrix scenario and the regression example, both computed with scikit-learn instead of by hand:
Actual output from running that, not paraphrased:
Notice sklearn's own numbers match the hand-computed ones above exactly, which is the entire point of showing both. If you want guided practice actually building and evaluating models rather than just reading someone else's, Scaler's free Supervised Learning course is built around exactly that.
Want to reason about models like a working data scientist? Explore Scaler's AI & ML Program to take this from metric literacy to actually building and shipping models.
FAQs
What are evaluation metrics in machine learning?
Quantitative measures of prediction quality: accuracy, precision, recall, F1, and ROC-AUC for classification, MAE, RMSE, and R² for regression.
What is the difference between precision and recall?
Precision asks, of everything predicted positive, how much was actually right. Recall asks, of everything actually positive, how much did the model catch. Optimise precision when false alarms are costly, recall when misses are costly.
Why is accuracy not a good metric for imbalanced data?
A model can score high accuracy by always predicting the majority class, 95% here while catching zero actual cancer cases. Use F1, recall, or AUC instead.
What is a good F1 score?
Context-dependent. Compare against a baseline for your dataset and class balance rather than chasing an absolute number, though above 0.7 is often considered solid in practice.
What is the difference between RMSE and MAE?
Both measure average error. RMSE squares errors first, so it punishes large mistakes harder, MAE treats all errors proportionally and stays more robust to outliers.
Which evaluation metric should I use for my model?
Start from what an error actually costs you: imbalanced classes call for F1 or recall, costly false positives call for precision, threshold-free comparison calls for ROC-AUC, regression with outliers calls for MAE, and regression where big misses are unacceptable calls for RMSE.




